| Param | Original file | Final file |
|---|---|---|
| Filename | modeM0/AS1A11_005T05_9000004744_32900cztM0_level2.evt | modeM0/AS1A11_005T05_9000004744_32900cztM0_level2_quad_clean.evt |
| Size (bytes) | 57,170,880 | 11,678,400 |
| Size | 54.5 MB | 11.1 MB |
| Events in quadrant A | 280,860 | 79,390 |
| Events in quadrant B | 399,236 | 79,904 |
| Events in quadrant C | 389,874 | 78,343 |
| Events in quadrant D | 624,394 | 72,815 |
| Mode SS | |||
|---|---|---|---|
| Quadrant | BADHDUFLAG | Total packets | Discarded packets |
| A | 0 | 10 | 0 |
| B | 0 | 10 | 0 |
| C | 0 | 10 | 0 |
| D | 0 | 10 | 0 |
| Mode M9 | |||
|---|---|---|---|
| Quadrant | BADHDUFLAG | Total packets | Discarded packets |
| A | 0 | 15 | 0 |
| B | 0 | 15 | 0 |
| C | 0 | 15 | 0 |
| D | 0 | 16 | 0 |
| Mode M0 | |||
|---|---|---|---|
| Quadrant | BADHDUFLAG | Total packets | Discarded packets |
| A | 0 | 1138 | 1 |
| B | 0 | 1534 | 1 |
| C | 0 | 1500 | 1 |
| D | 0 | 2237 | 1 |
| Quadrant | Total seconds | Saturated seconds | Saturation percentage |
|---|---|---|---|
| A | 497 | 1 | 0.201207% |
| B | 497 | 26 | 5.231388% |
| C | 497 | 30 | 6.036217% |
| D | 497 | 54 | 10.865191% |
Noise dominated data is calculated using 1-second bins in cleaned event files. If a bin has >2000 counts, and if more than 50% of those come from <1% of pixels, then it is considered to be noise-dominated and hence unusable.
| Quadrant | # 1 sec bins | Bins with >0 counts | Bins with >2000 counts | High rate bins dominated by noise | Noise dominated (total time) | Noise dominated (detector-on time) | Marked lightcurve |
|---|---|---|---|---|---|---|---|
| A | 497 | 497 | 0 | 0 | 0.00% | 0.00% | 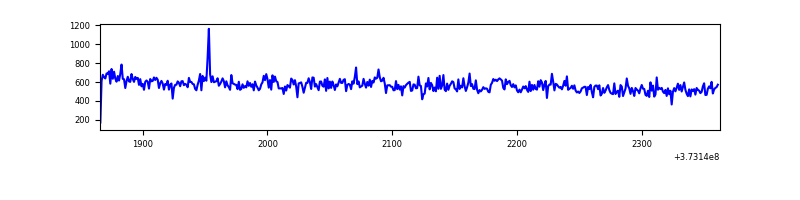 |
| B | 497 | 497 | 16 | 16 | 3.22% | 3.22% | 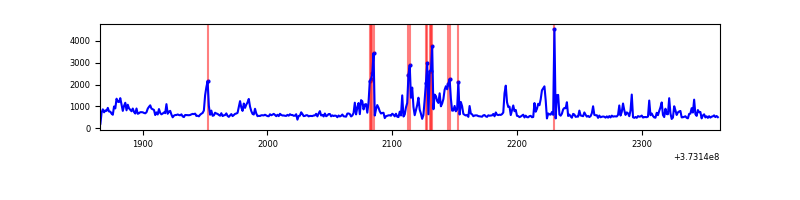 |
| C | 497 | 497 | 23 | 23 | 4.63% | 4.63% | 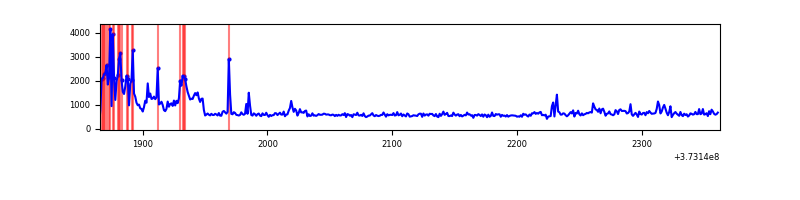 |
| D | 497 | 497 | 25 | 25 | 5.03% | 5.03% | 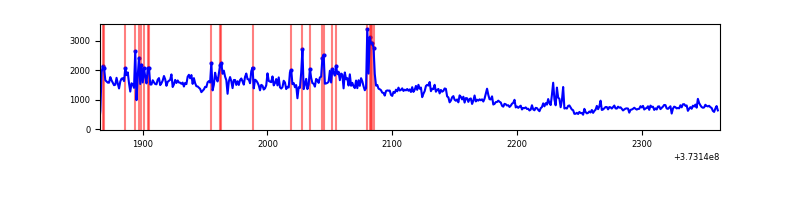 |
Top three noisy pixels from each quadrant. If the there are fewer than three noisy pixels in the level2.evt file, extra rows are filled as -1
| Pixel properties | Quadrant properties | ||||||
|---|---|---|---|---|---|---|---|
| Quadrant | DetID | PixID | Counts | Sigma | Mean | Median | Sigma |
| A | 14 | 63 | 7492 | 469.33 | 69 | 68 | 15.8 |
| A | 13 | 6 | 2020 | 123.4 | 69 | 68 | 15.8 |
| A | 9 | 143 | 1017 | 59.99 | 69 | 68 | 15.8 |
| B | 5 | 172 | 109194 | 7294.34 | 68 | 66 | 15.0 |
| B | 0 | 219 | 8965 | 594.83 | 68 | 66 | 15.0 |
| B | 15 | 201 | 8371 | 555.12 | 68 | 66 | 15.0 |
| C | 0 | 10 | 94572 | 5375.3 | 67 | 68 | 17.6 |
| C | 0 | 207 | 13431 | 760.07 | 67 | 68 | 17.6 |
| C | 14 | 67 | 12483 | 706.15 | 67 | 68 | 17.6 |
| D | 8 | 195 | 221057 | 12225.76 | 67 | 65 | 18.1 |
| D | 10 | 203 | 52459 | 2898.55 | 67 | 65 | 18.1 |
| D | 2 | 249 | 26757 | 1476.66 | 67 | 65 | 18.1 |
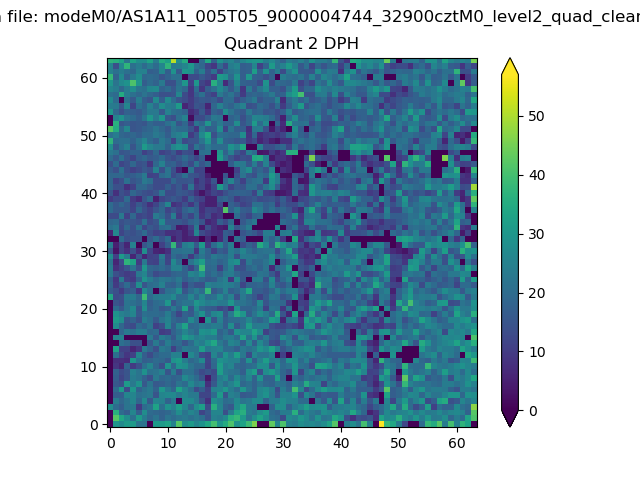
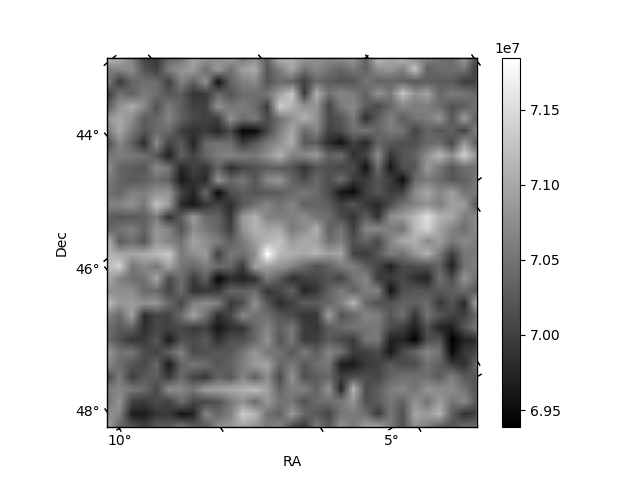
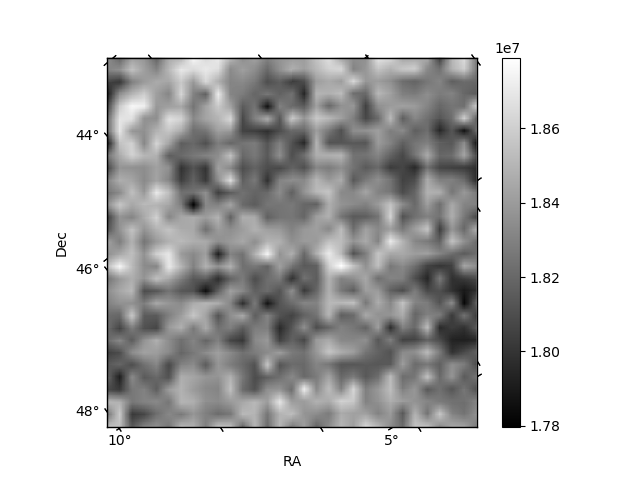
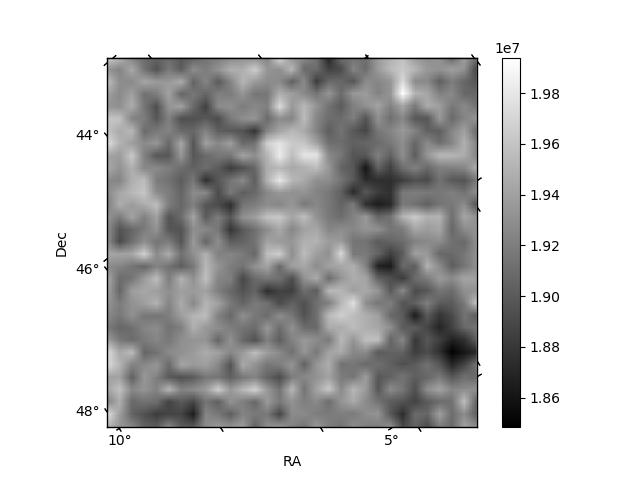
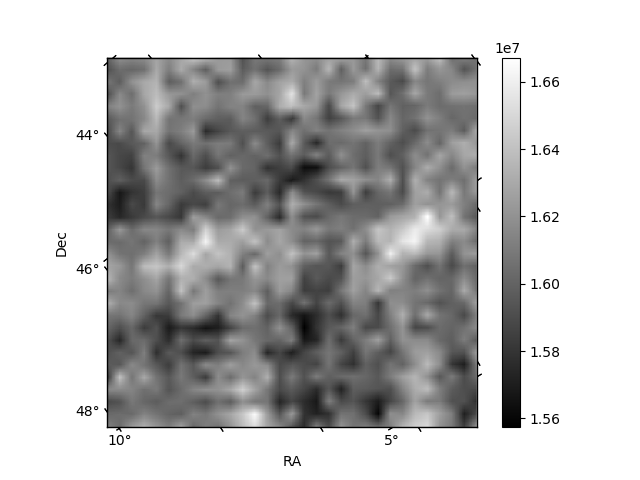
Histogram calculated using DETX and DETY for each event in the final _common_clean file
| Quadrant A | 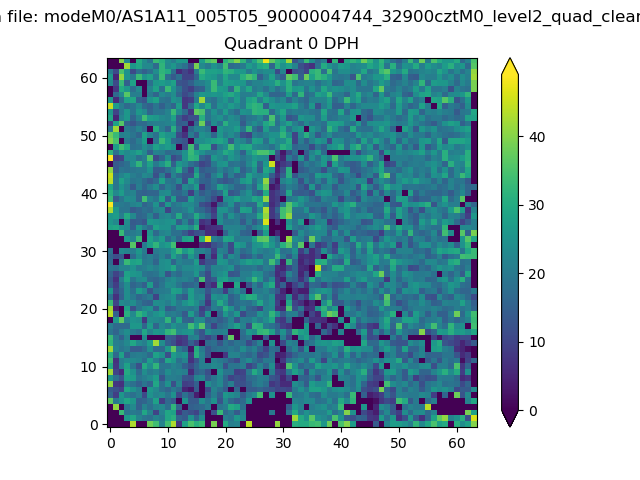 |
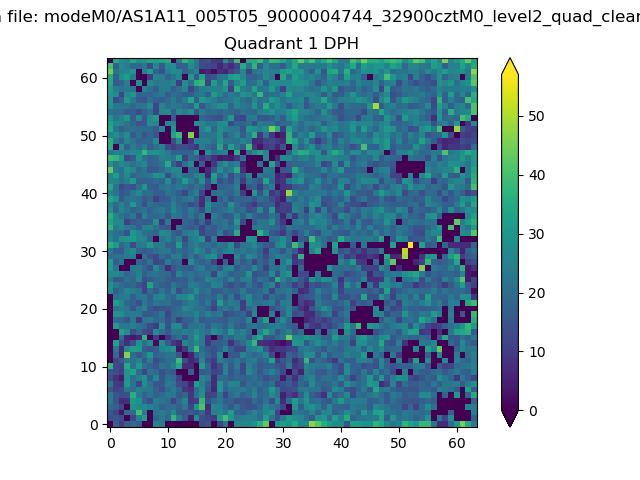 |
Quadrant B |
|---|---|---|---|
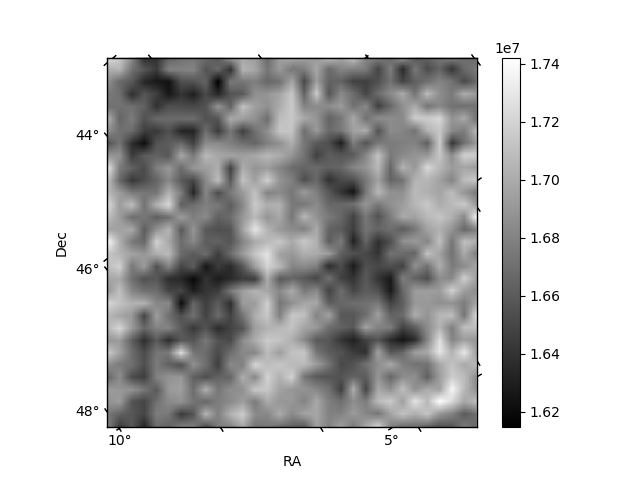
| Quadrant D | 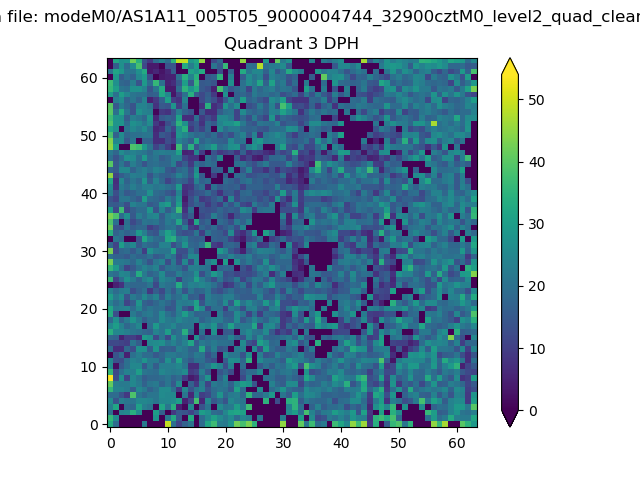 |
 |
Quadrant C |
| Plot type | Count rate plots | Images |
|---|---|---|
| Comparison with Poisson distribution Blue bars denote a histogram of data divided into 1 sec bins. Red curve is a Poisson curve with rate = median count rate of data. |
 |
 |
| Quadrant-wise count rates Data is divided into 100 sec bins |
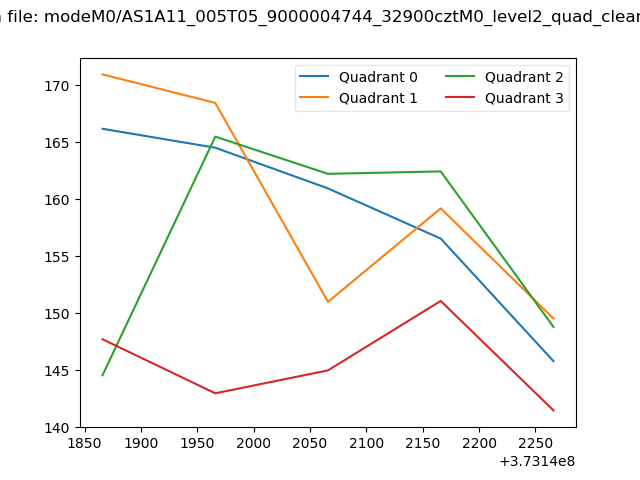 |
|
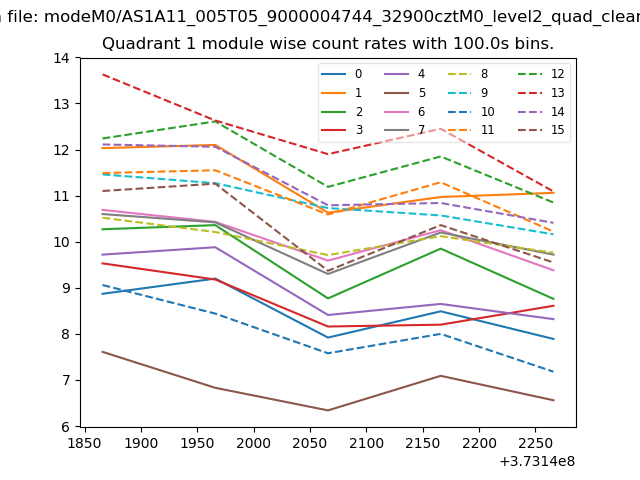
| Module-wise count rates for Quadrant A Data is divided into 100 sec bins |
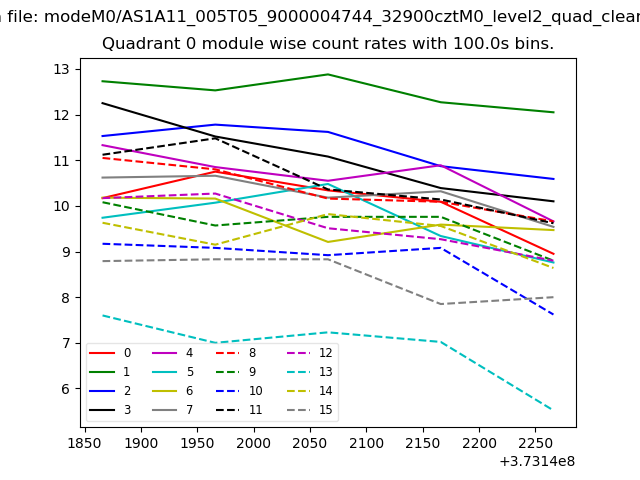 |
 |
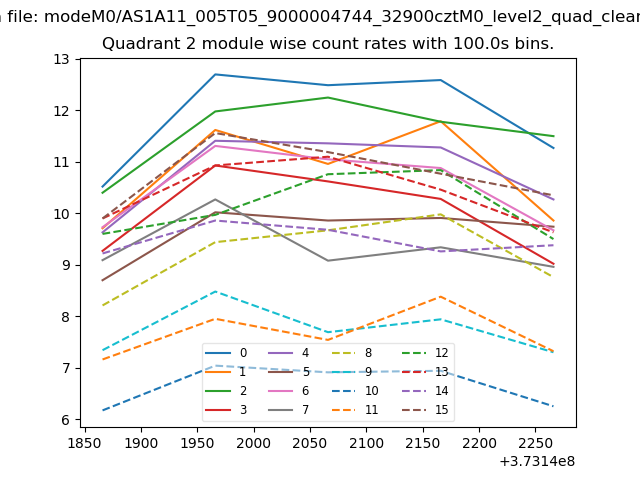
| Module-wise count rates for Quadrant B Data is divided into 100 sec bins |
 |
 |
| Module-wise count rates for Quadrant C Data is divided into 100 sec bins |
 |
 |
| Module-wise count rates for Quadrant D Data is divided into 100 sec bins |
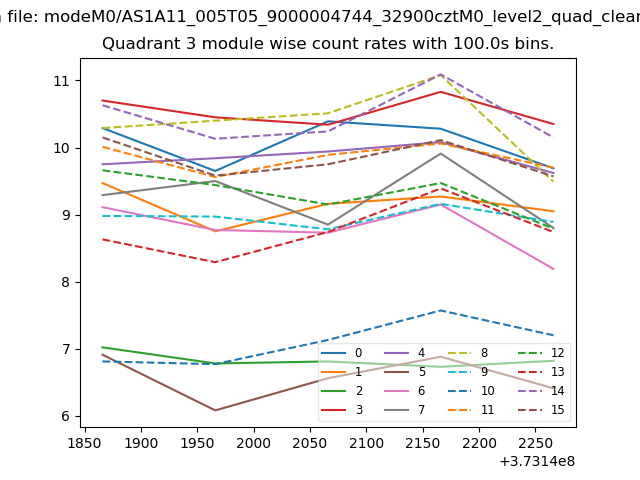 |
 |
| Parameter | Plot |
|---|---|
| CZT HV Monitor | 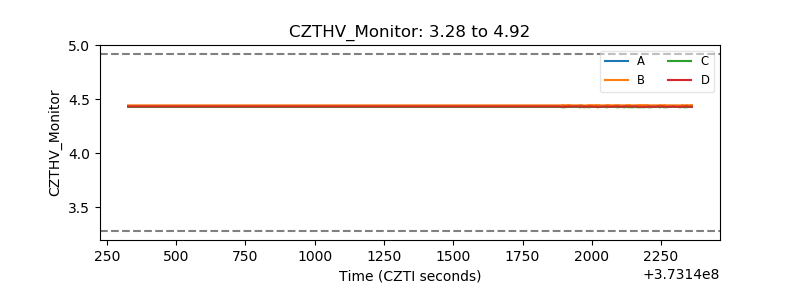 |
| D_VDD |  |
| Temperature 1 | 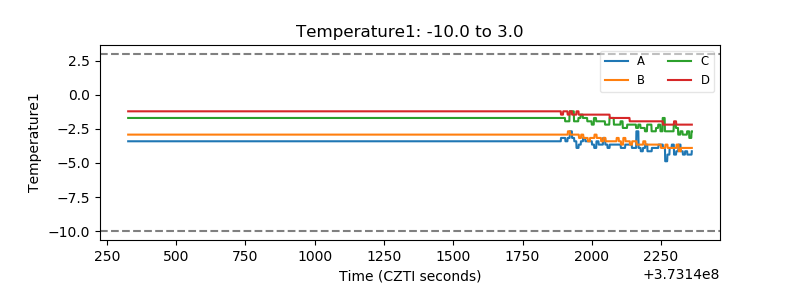 |
| Veto HV Monitor | 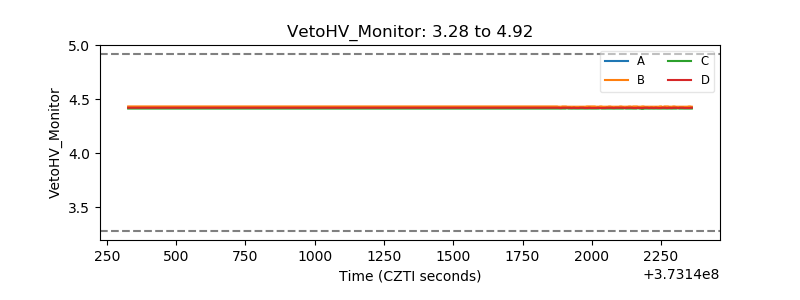 |
| Veto LLD | 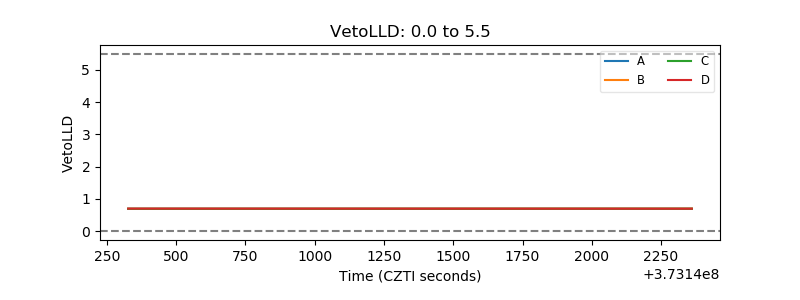 |
| Alpha Counter | 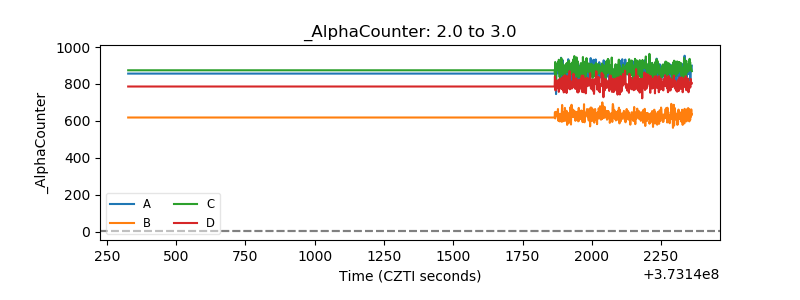 |
| _CPM_Rate | 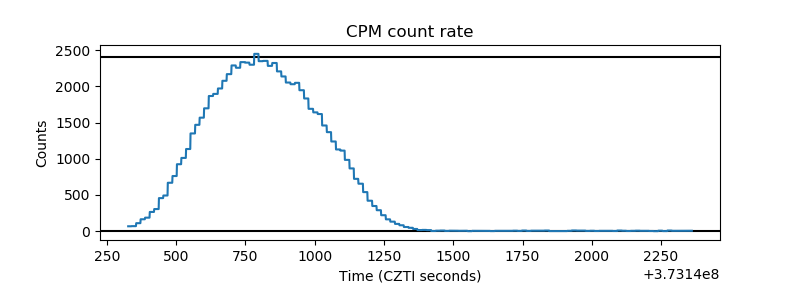 |
| CZT Counter | 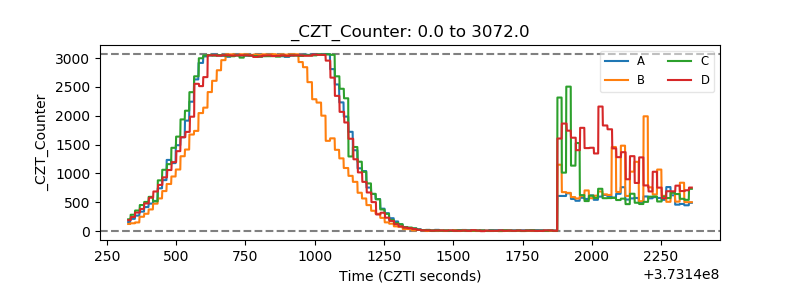 |
| +2.5 Volts monitor |  |
| +5 Volts monitor |  |
| _ROLL_ROT | 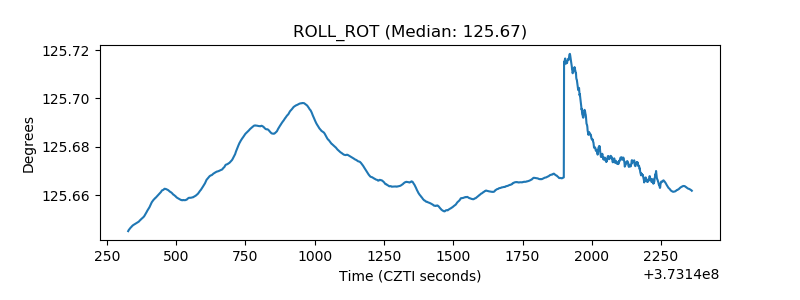 |
| _Roll_DEC |  |
| _Roll_RA | 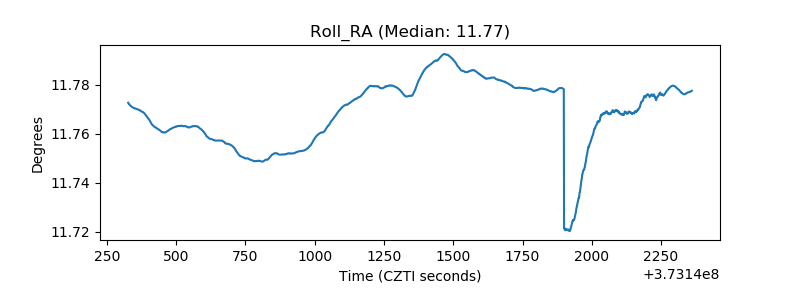 |
| Veto Counter | 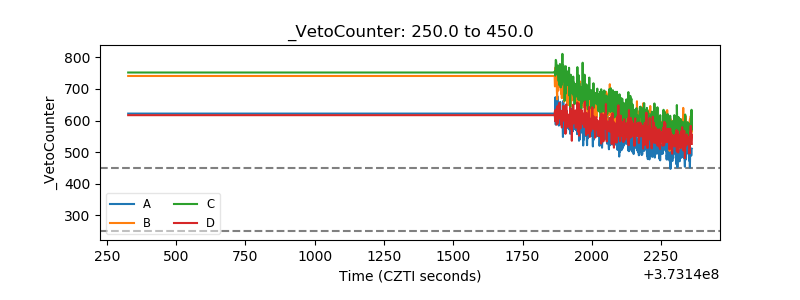 |