| Param | Original file | Final file |
|---|---|---|
| Filename | modeM0/AS1A11_007T06_9000004746cztM0_level2.fits | modeM0/AS1A11_007T06_9000004746cztM0_level2_quad_clean.evt |
| Size (bytes) | 147,182,400 | 40,147,200 |
| Size | 140.4 MB | 38.3 MB |
| Events in quadrant A | 933,728 | 57,833 |
| Events in quadrant B | 890,262 | 57,750 |
| Events in quadrant C | 919,828 | 58,992 |
| Events in quadrant D | 724,368 | 50,294 |
| Mode SS | |||
|---|---|---|---|
| Quadrant | BADHDUFLAG | Total packets | Discarded packets |
| A | 0 | 292 | 0 |
| B | 0 | 292 | 0 |
| C | 0 | 292 | 0 |
| D | 0 | 292 | 0 |
| Mode M9 | |||
|---|---|---|---|
| Quadrant | BADHDUFLAG | Total packets | Discarded packets |
| A | 0 | 61 | 0 |
| B | 0 | 61 | 0 |
| C | 0 | 61 | 0 |
| D | 0 | 61 | 0 |
| Mode M0 | |||
|---|---|---|---|
| Quadrant | BADHDUFLAG | Total packets | Discarded packets |
| A | 0 | 29167 | 0 |
| B | 0 | 33581 | 0 |
| C | 0 | 31643 | 0 |
| D | 0 | 65492 | 0 |
| Quadrant | Total seconds | Saturated seconds | Saturation percentage |
|---|---|---|---|
| A | 14323 | 20 | 0.139636% |
| B | 14323 | 342 | 2.387768% |
| C | 14323 | 150 | 1.047267% |
| D | 14323 | 2054 | 14.340571% |
Noise dominated data is calculated using 1-second bins in cleaned event files. If a bin has >2000 counts, and if more than 50% of those come from <1% of pixels, then it is considered to be noise-dominated and hence unusable.
| Quadrant | # 1 sec bins | Bins with >0 counts | Bins with >2000 counts | High rate bins dominated by noise | Noise dominated (total time) | Noise dominated (detector-on time) | Marked lightcurve |
|---|---|---|---|---|---|---|---|
| A | 20392 | 14323 | 0 | 0 | 0.00% | 0.00% |  |
| B | 20392 | 14311 | 0 | 0 | 0.00% | 0.00% |  |
| C | 20392 | 14321 | 0 | 0 | 0.00% | 0.00% | 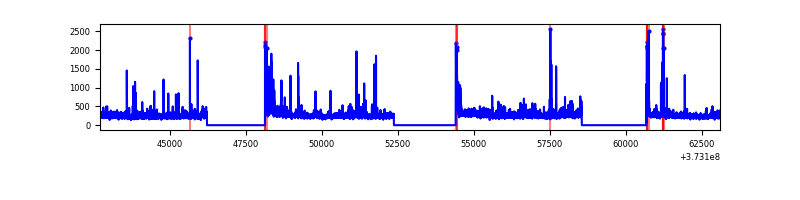 |
| D | 20392 | 14320 | 0 | 0 | 0.00% | 0.00% |  |
Top three noisy pixels from each quadrant. If the there are fewer than three noisy pixels in the level2.evt file, extra rows are filled as -1
| Pixel properties | Quadrant properties | ||||||
|---|---|---|---|---|---|---|---|
| Quadrant | DetID | PixID | Counts | Sigma | Mean | Median | Sigma |
| A | 0 | 29 | 759 | 8.51 | 244 | 232 | 61.9 |
| A | 7 | 110 | 753 | 8.42 | 244 | 232 | 61.9 |
| A | 9 | 19 | 746 | 8.3 | 244 | 232 | 61.9 |
| B | 2 | 9 | 740 | 10.78 | 236 | 228 | 47.5 |
| B | 3 | 80 | 691 | 9.75 | 236 | 228 | 47.5 |
| B | 3 | 17 | 622 | 8.3 | 236 | 228 | 47.5 |
| C | 1 | 81 | 755 | 8.31 | 243 | 231 | 63.0 |
| C | 3 | 202 | 750 | 8.23 | 243 | 231 | 63.0 |
| C | 1 | 80 | 740 | 8.07 | 243 | 231 | 63.0 |
| D | 6 | 67 | 562 | 6.62 | 207 | 190 | 56.2 |
| D | 7 | 3 | 558 | 6.55 | 207 | 190 | 56.2 |
| D | 6 | 38 | 534 | 6.12 | 207 | 190 | 56.2 |
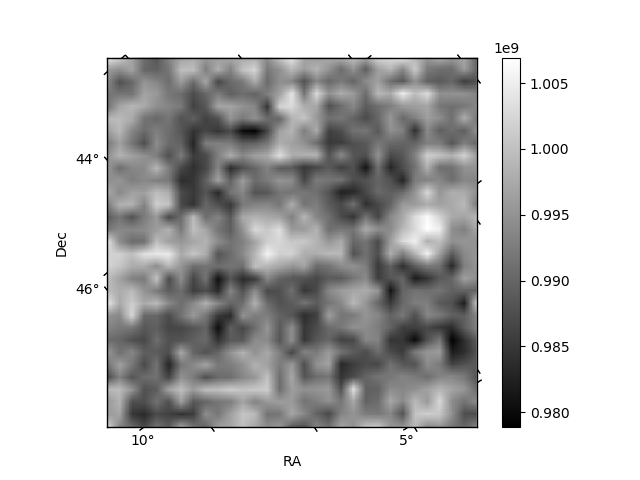
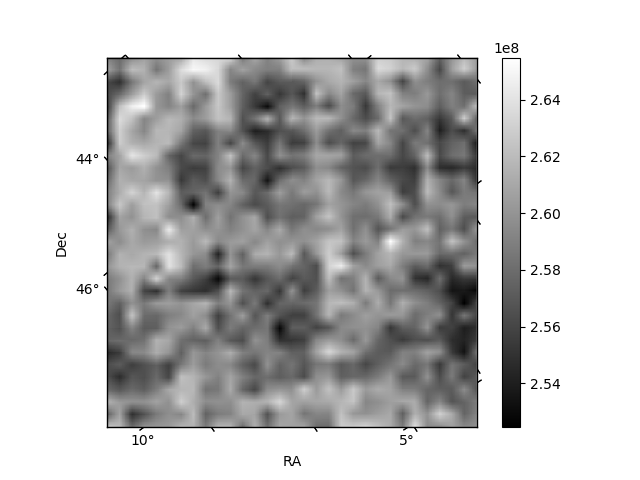
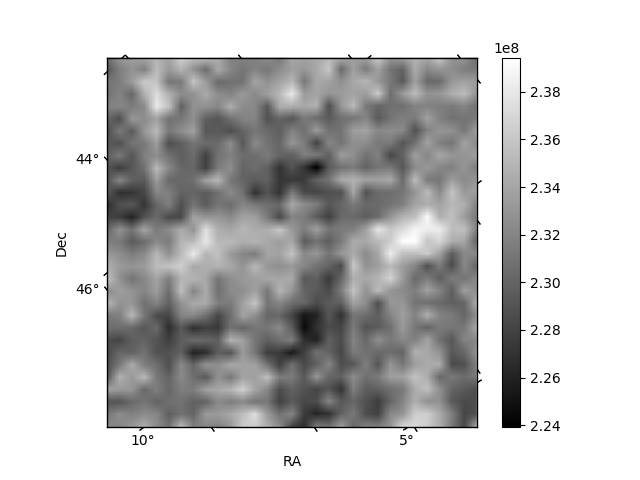
Histogram calculated using DETX and DETY for each event in the final _common_clean file
| Quadrant A | 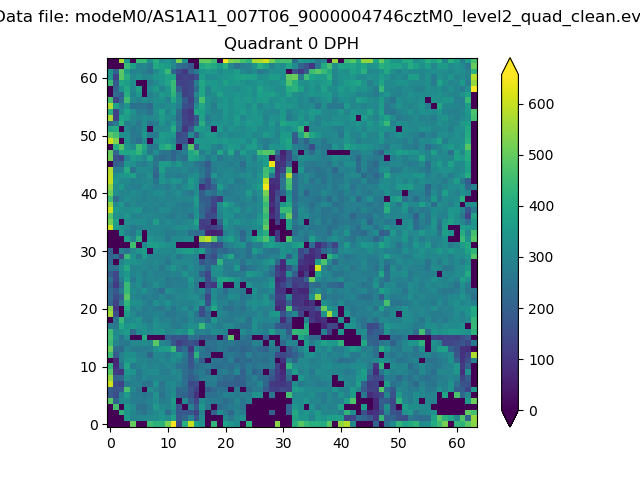 |
 |
Quadrant B |
|---|---|---|---|
| Quadrant D | 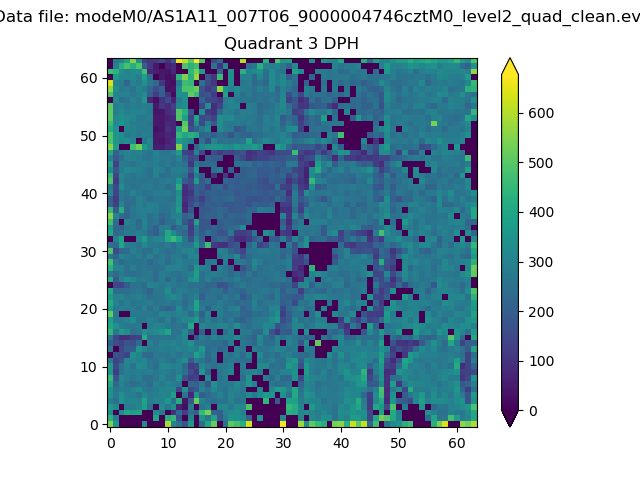 |
 |
Quadrant C |
| Plot type | Count rate plots | Images |
|---|---|---|
| Comparison with Poisson distribution Blue bars denote a histogram of data divided into 1 sec bins. Red curve is a Poisson curve with rate = median count rate of data. |
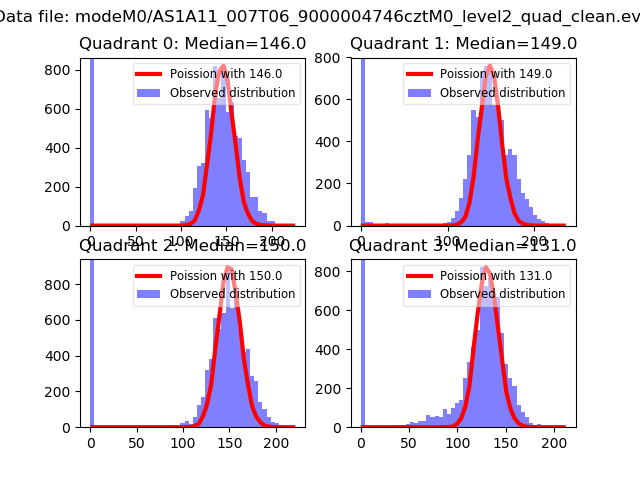 |
 |
| Quadrant-wise count rates Data is divided into 100 sec bins |
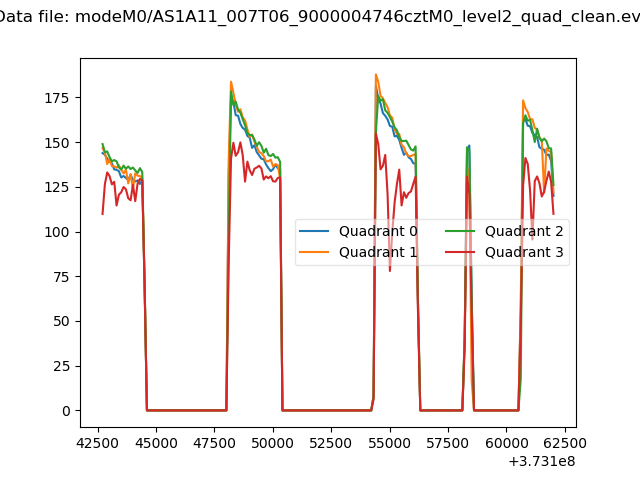 |
|
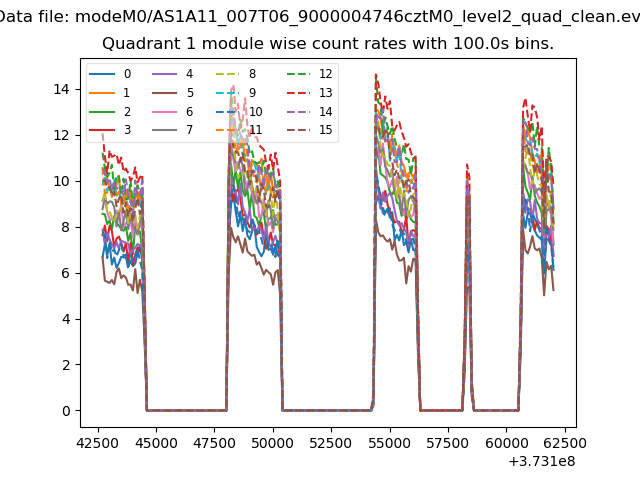
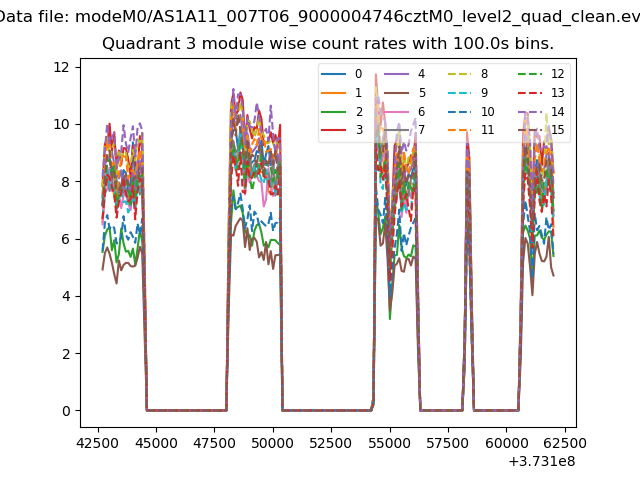
| Module-wise count rates for Quadrant A Data is divided into 100 sec bins |
 |
 |
| Module-wise count rates for Quadrant B Data is divided into 100 sec bins |
 |
 |
| Module-wise count rates for Quadrant C Data is divided into 100 sec bins |
 |
 |
| Module-wise count rates for Quadrant D Data is divided into 100 sec bins |
 |
 |
| Parameter | Plot |
|---|---|
| CZT HV Monitor | 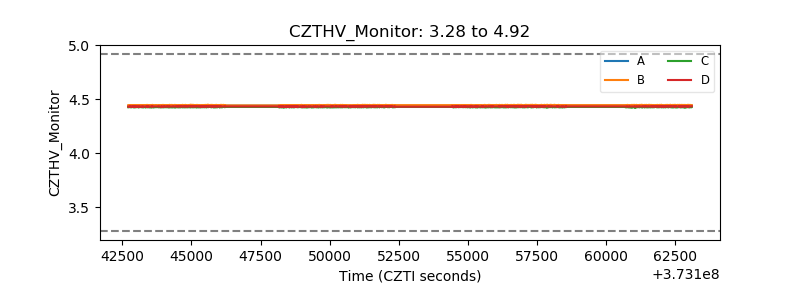 |
| D_VDD | 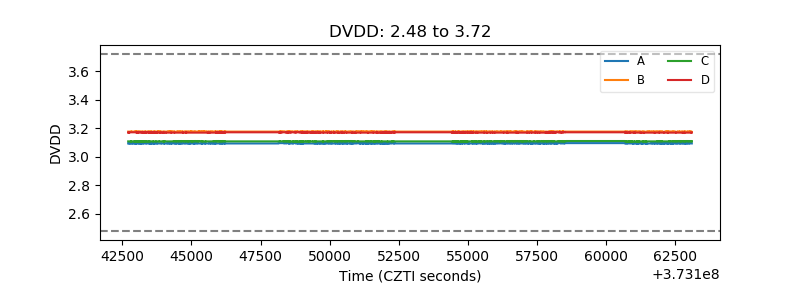 |
| Temperature 1 | 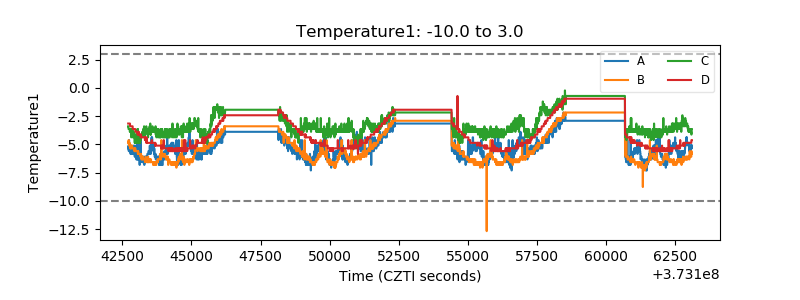 |
| Veto HV Monitor |  |
| Veto LLD |  |
| Alpha Counter |  |
| _CPM_Rate |  |
| CZT Counter |  |
| +2.5 Volts monitor |  |
| +5 Volts monitor | 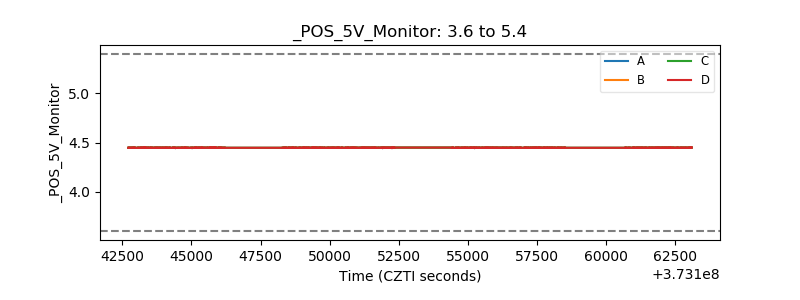 |
| _ROLL_ROT |  |
| _Roll_DEC | 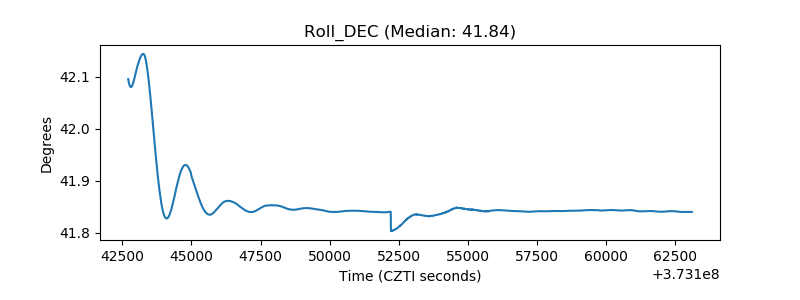 |
| _Roll_RA | 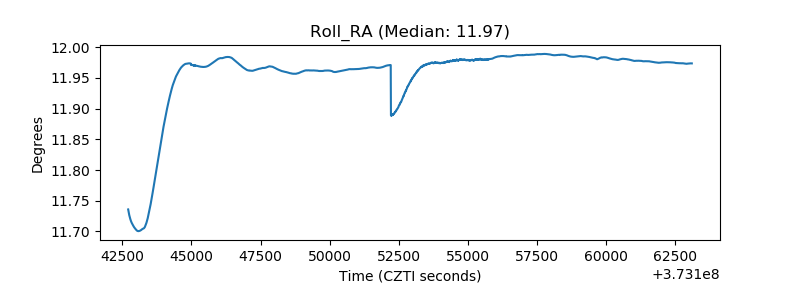 |
| Veto Counter | 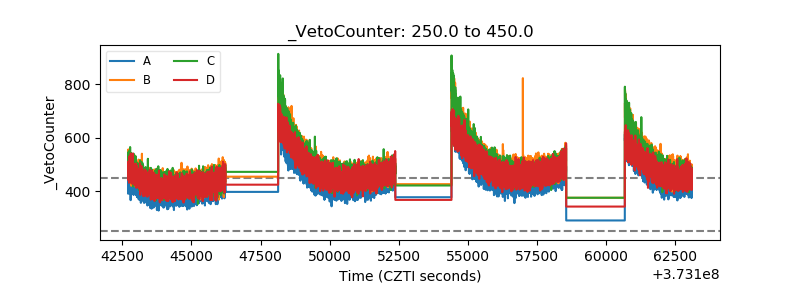 |