| Param | Original file | Final file |
|---|---|---|
| Filename | modeM0/AS1A11_007T06_9000004746_32900cztM0_level2.evt | modeM0/AS1A11_007T06_9000004746_32900cztM0_level2_quad_clean.evt |
| Size (bytes) | 386,559,360 | 59,618,880 |
| Size | 368.7 MB | 56.9 MB |
| Events in quadrant A | 2,014,335 | 380,395 |
| Events in quadrant B | 2,328,386 | 388,954 |
| Events in quadrant C | 2,333,876 | 388,928 |
| Events in quadrant D | 4,736,548 | 342,284 |
| Mode SS | |||
|---|---|---|---|
| Quadrant | BADHDUFLAG | Total packets | Discarded packets |
| A | 0 | 88 | 0 |
| B | 0 | 88 | 0 |
| C | 0 | 88 | 0 |
| D | 0 | 88 | 0 |
| Mode M9 | |||
|---|---|---|---|
| Quadrant | BADHDUFLAG | Total packets | Discarded packets |
| A | 0 | 20 | 0 |
| B | 0 | 20 | 0 |
| C | 0 | 20 | 0 |
| D | 0 | 20 | 0 |
| Mode M0 | |||
|---|---|---|---|
| Quadrant | BADHDUFLAG | Total packets | Discarded packets |
| A | 0 | 8772 | 2 |
| B | 0 | 9626 | 1 |
| C | 0 | 9667 | 1 |
| D | 0 | 17081 | 1 |
| Quadrant | Total seconds | Saturated seconds | Saturation percentage |
|---|---|---|---|
| A | 4326 | 4 | 0.092464% |
| B | 4326 | 38 | 0.878410% |
| C | 4326 | 56 | 1.294498% |
| D | 4326 | 362 | 8.368007% |
Noise dominated data is calculated using 1-second bins in cleaned event files. If a bin has >2000 counts, and if more than 50% of those come from <1% of pixels, then it is considered to be noise-dominated and hence unusable.
| Quadrant | # 1 sec bins | Bins with >0 counts | Bins with >2000 counts | High rate bins dominated by noise | Noise dominated (total time) | Noise dominated (detector-on time) | Marked lightcurve |
|---|---|---|---|---|---|---|---|
| A | 6238 | 4327 | 0 | 0 | 0.00% | 0.00% | 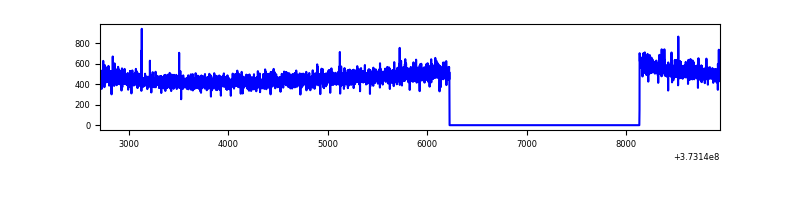 |
| B | 6238 | 4327 | 27 | 27 | 0.43% | 0.62% | 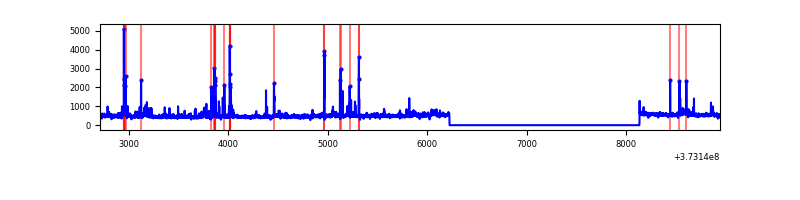 |
| C | 6238 | 4327 | 34 | 34 | 0.55% | 0.79% | 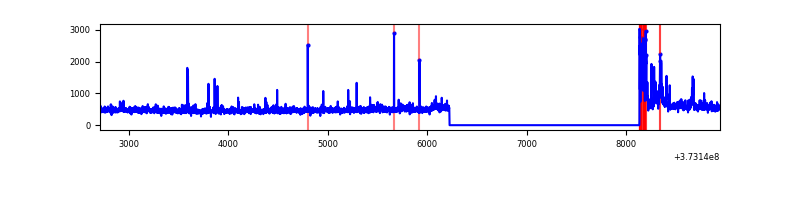 |
| D | 6238 | 4327 | 370 | 370 | 5.93% | 8.55% | 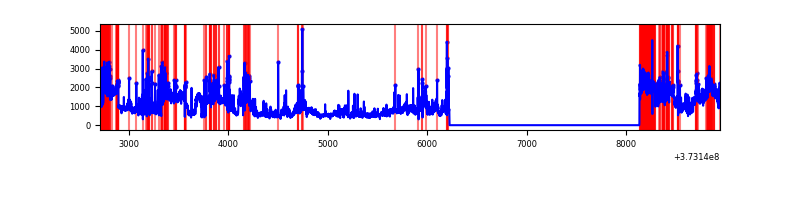 |
Top three noisy pixels from each quadrant. If the there are fewer than three noisy pixels in the level2.evt file, extra rows are filled as -1
| Pixel properties | Quadrant properties | ||||||
|---|---|---|---|---|---|---|---|
| Quadrant | DetID | PixID | Counts | Sigma | Mean | Median | Sigma |
| A | 14 | 63 | 13169 | 123.52 | 514 | 505 | 102.5 |
| A | 13 | 254 | 8316 | 76.19 | 514 | 505 | 102.5 |
| A | 13 | 6 | 7896 | 72.09 | 514 | 505 | 102.5 |
| B | 5 | 172 | 147583 | 1515.9 | 519 | 506 | 97.0 |
| B | 0 | 219 | 34777 | 353.22 | 519 | 506 | 97.0 |
| B | 0 | 197 | 27306 | 276.22 | 519 | 506 | 97.0 |
| C | 0 | 10 | 189403 | 1605.92 | 509 | 515 | 117.6 |
| C | 14 | 67 | 106767 | 903.35 | 509 | 515 | 117.6 |
| C | 1 | 241 | 14775 | 121.24 | 509 | 515 | 117.6 |
| D | 8 | 195 | 1701544 | 14006.69 | 486 | 476 | 121.4 |
| D | 2 | 250 | 389814 | 3205.83 | 486 | 476 | 121.4 |
| D | 12 | 227 | 335251 | 2756.56 | 486 | 476 | 121.4 |
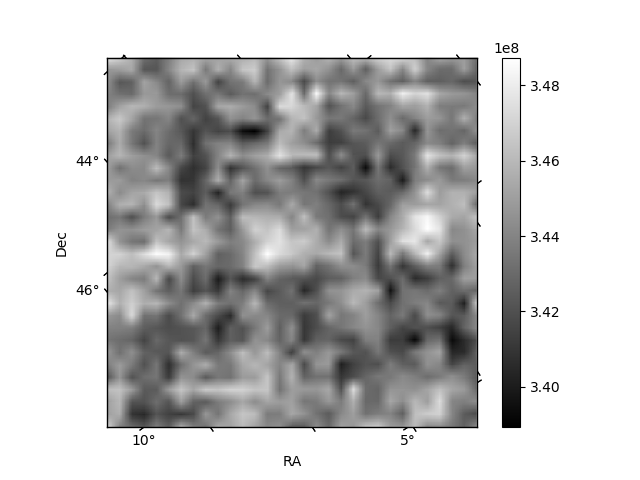
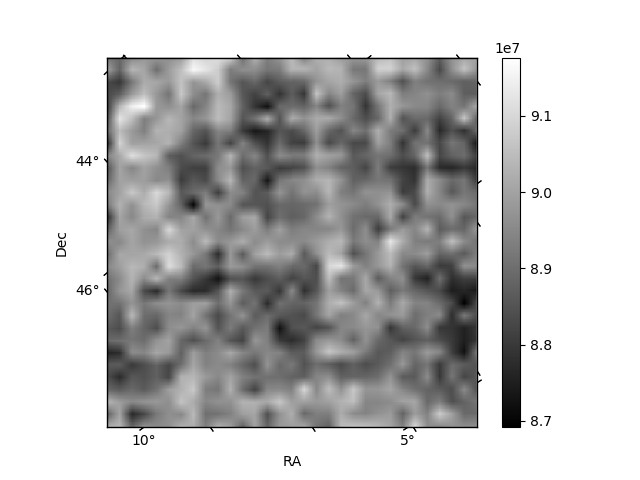
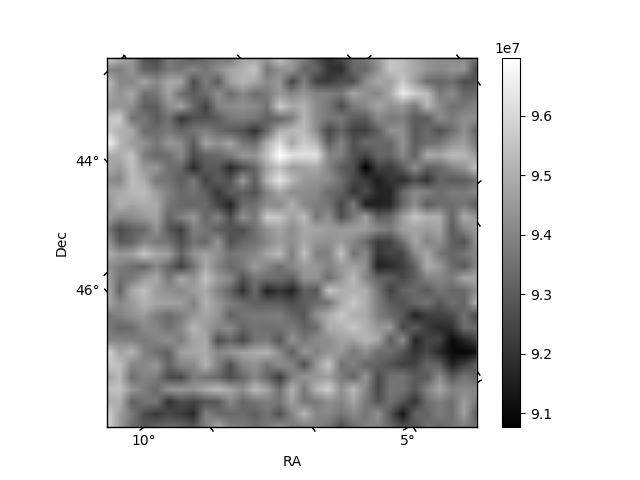
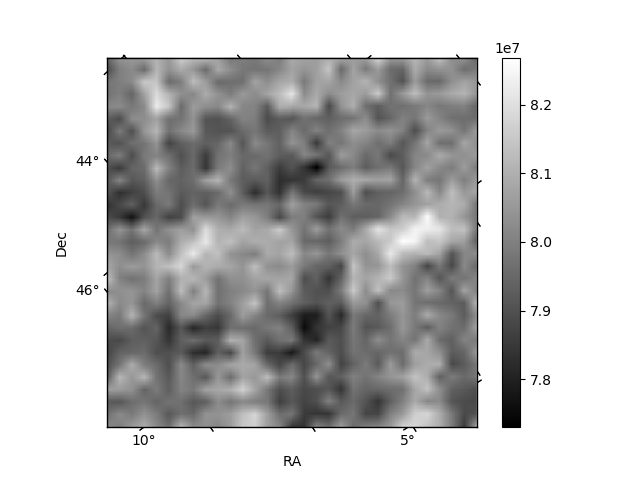
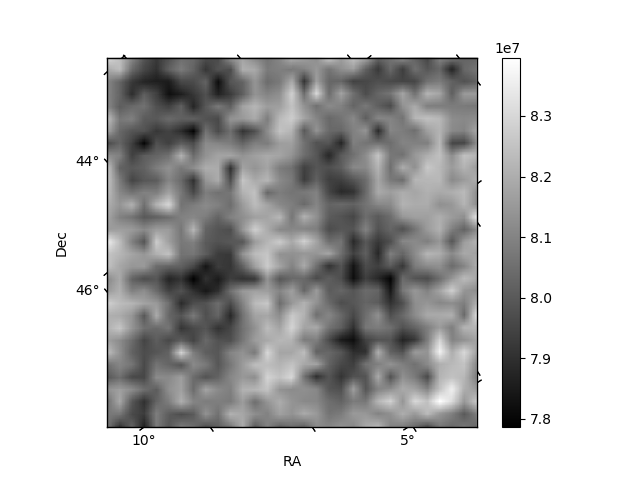
Histogram calculated using DETX and DETY for each event in the final _common_clean file
| Quadrant A | 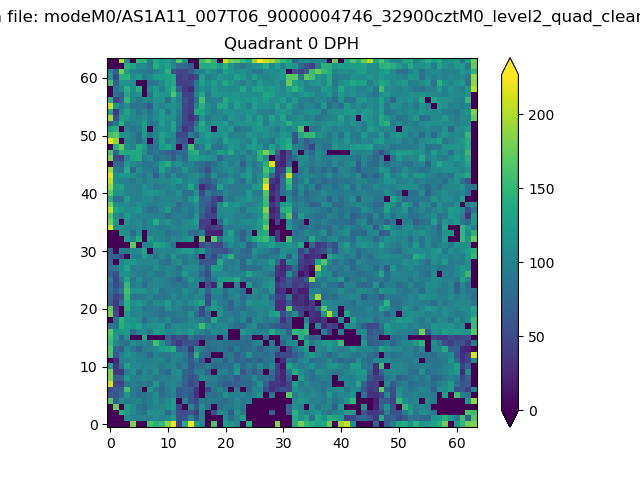 |
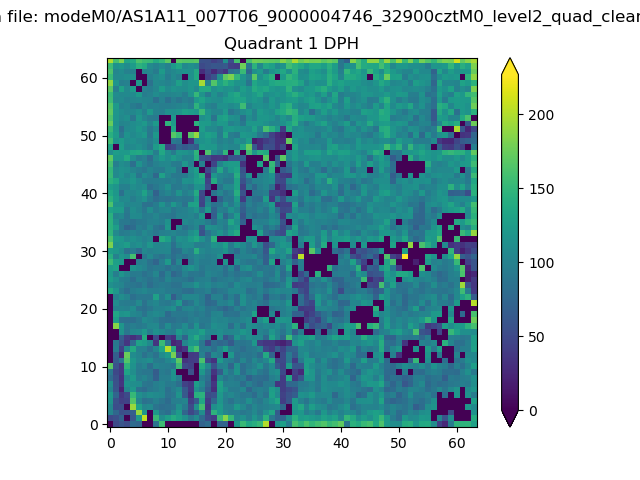 |
Quadrant B |
|---|---|---|---|
| Quadrant D |  |
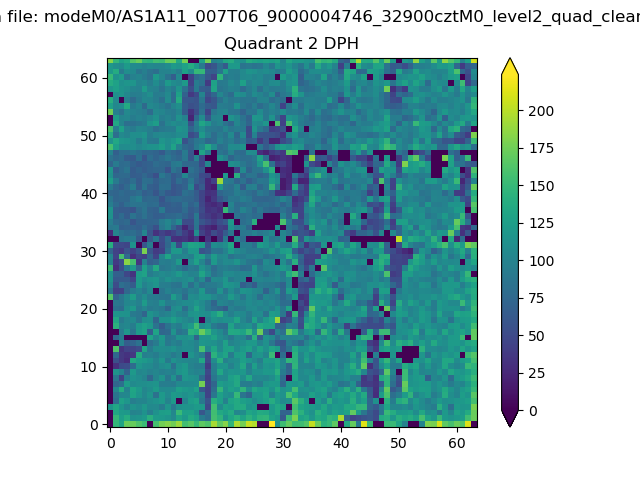 |
Quadrant C |
| Plot type | Count rate plots | Images |
|---|---|---|
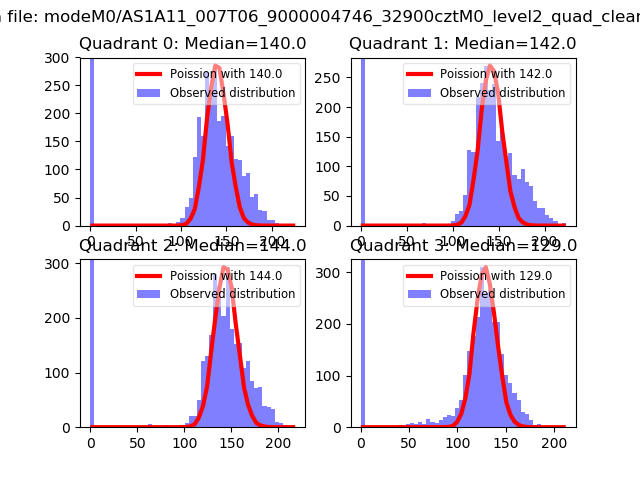
| Comparison with Poisson distribution Blue bars denote a histogram of data divided into 1 sec bins. Red curve is a Poisson curve with rate = median count rate of data. |
 |
 |
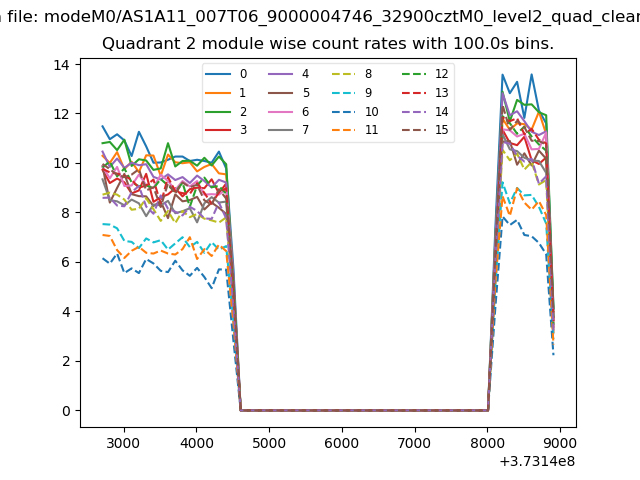
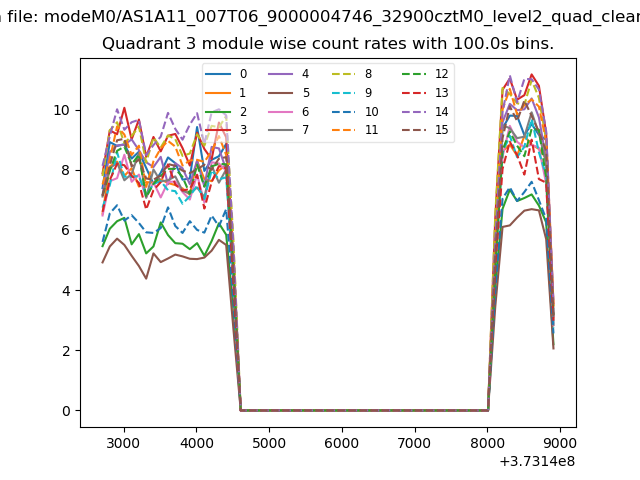
| Quadrant-wise count rates Data is divided into 100 sec bins |
 |
|
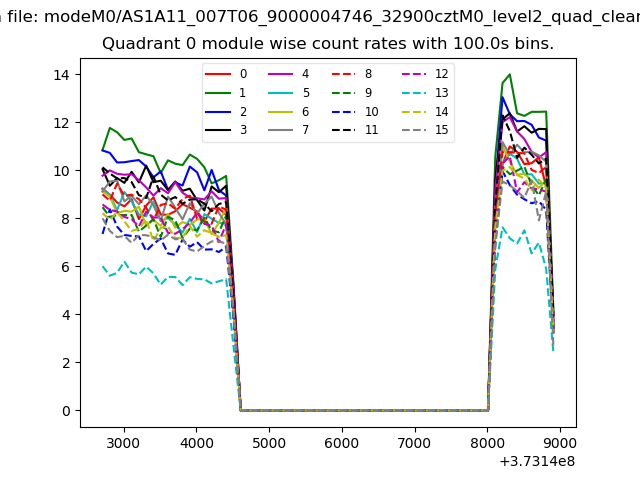
| Module-wise count rates for Quadrant A Data is divided into 100 sec bins |
 |
 |
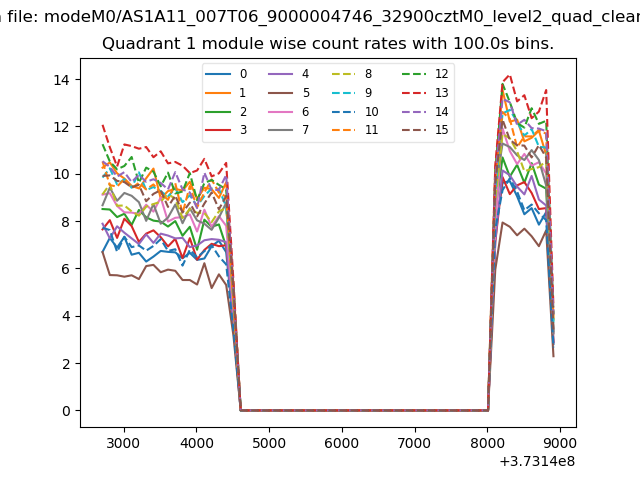
| Module-wise count rates for Quadrant B Data is divided into 100 sec bins |
 |
 |
| Module-wise count rates for Quadrant C Data is divided into 100 sec bins |
 |
 |
| Module-wise count rates for Quadrant D Data is divided into 100 sec bins |
 |
 |
| Parameter | Plot |
|---|---|
| CZT HV Monitor | 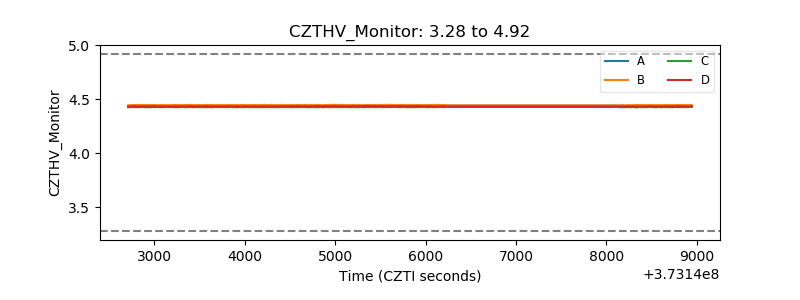 |
| D_VDD | 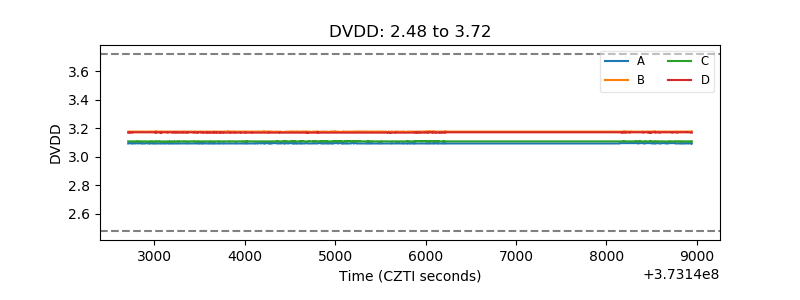 |
| Temperature 1 | 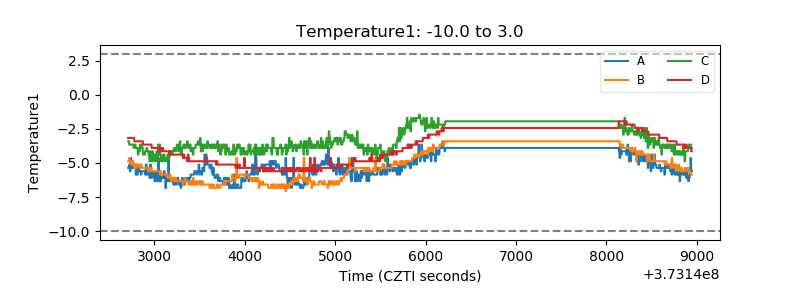 |
| Veto HV Monitor |  |
| Veto LLD | 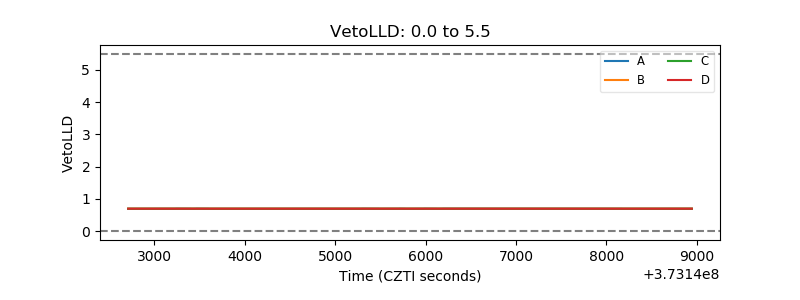 |
| Alpha Counter | 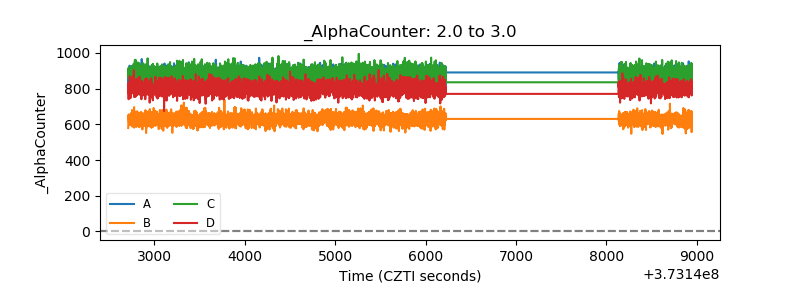 |
| _CPM_Rate | 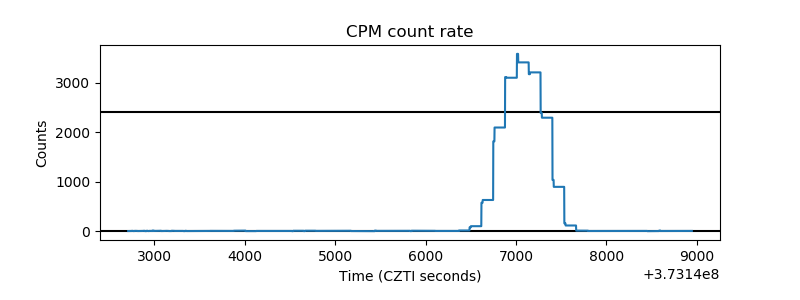 |
| CZT Counter |  |
| +2.5 Volts monitor |  |
| +5 Volts monitor |  |
| _ROLL_ROT | 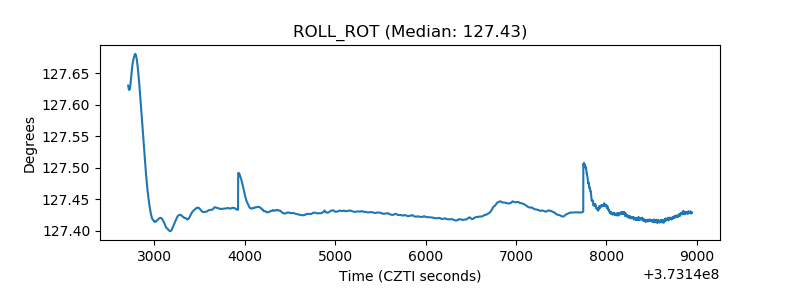 |
| _Roll_DEC | 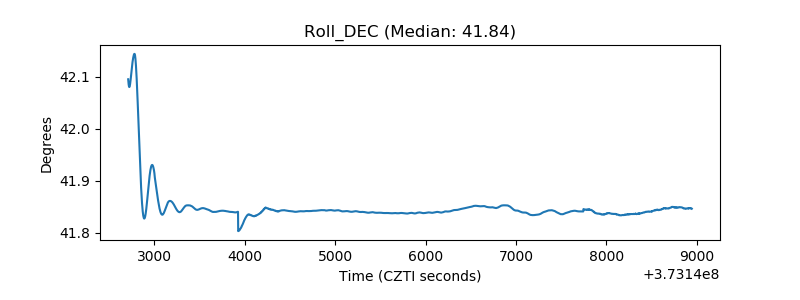 |
| _Roll_RA |  |
| Veto Counter | 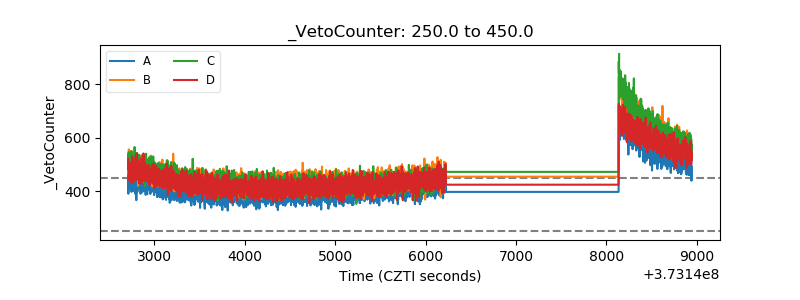 |