| Param | Original file | Final file |
|---|---|---|
| Filename | modeM0/AS1A11_007T06_9000004746_32901cztM0_level2.evt | modeM0/AS1A11_007T06_9000004746_32901cztM0_level2_quad_clean.evt |
| Size (bytes) | 483,269,760 | 71,608,320 |
| Size | 460.9 MB | 68.3 MB |
| Events in quadrant A | 2,439,127 | 464,944 |
| Events in quadrant B | 3,018,780 | 478,595 |
| Events in quadrant C | 2,874,405 | 472,147 |
| Events in quadrant D | 5,966,191 | 403,175 |
| Mode SS | |||
|---|---|---|---|
| Quadrant | BADHDUFLAG | Total packets | Discarded packets |
| A | 0 | 102 | 0 |
| B | 0 | 102 | 0 |
| C | 0 | 102 | 0 |
| D | 0 | 102 | 0 |
| Mode M9 | |||
|---|---|---|---|
| Quadrant | BADHDUFLAG | Total packets | Discarded packets |
| A | 0 | 28 | 0 |
| B | 0 | 28 | 0 |
| C | 0 | 28 | 0 |
| D | 0 | 29 | 0 |
| Mode M0 | |||
|---|---|---|---|
| Quadrant | BADHDUFLAG | Total packets | Discarded packets |
| A | 0 | 10198 | 3 |
| B | 0 | 12004 | 2 |
| C | 0 | 11557 | 2 |
| D | 0 | 21198 | 2 |
| Quadrant | Total seconds | Saturated seconds | Saturation percentage |
|---|---|---|---|
| A | 4978 | 2 | 0.040177% |
| B | 4978 | 91 | 1.828043% |
| C | 4978 | 85 | 1.707513% |
| D | 4978 | 666 | 13.378867% |
Noise dominated data is calculated using 1-second bins in cleaned event files. If a bin has >2000 counts, and if more than 50% of those come from <1% of pixels, then it is considered to be noise-dominated and hence unusable.
| Quadrant | # 1 sec bins | Bins with >0 counts | Bins with >2000 counts | High rate bins dominated by noise | Noise dominated (total time) | Noise dominated (detector-on time) | Marked lightcurve |
|---|---|---|---|---|---|---|---|
| A | 7012 | 4979 | 1 | 1 | 0.01% | 0.02% | 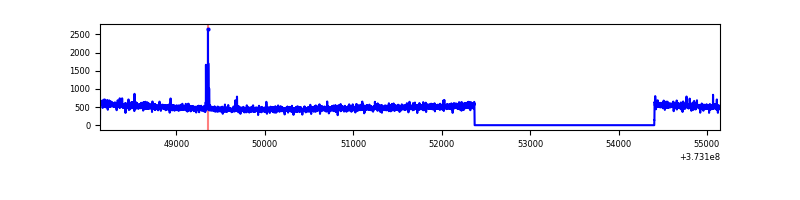 |
| B | 7012 | 4979 | 57 | 57 | 0.81% | 1.14% | 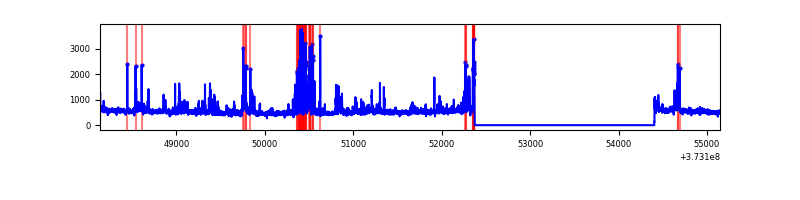 |
| C | 7012 | 4979 | 58 | 58 | 0.83% | 1.16% | 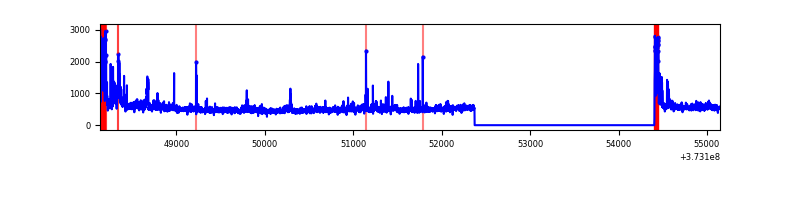 |
| D | 7012 | 4979 | 696 | 696 | 9.93% | 13.98% | 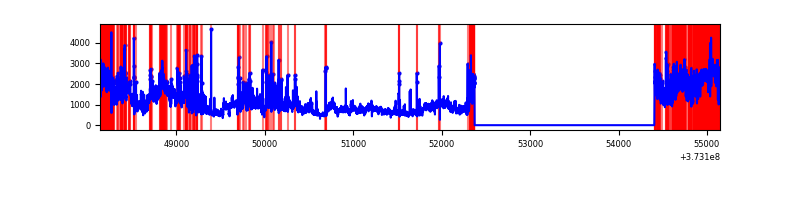 |
Top three noisy pixels from each quadrant. If the there are fewer than three noisy pixels in the level2.evt file, extra rows are filled as -1
| Pixel properties | Quadrant properties | ||||||
|---|---|---|---|---|---|---|---|
| Quadrant | DetID | PixID | Counts | Sigma | Mean | Median | Sigma |
| A | 15 | 169 | 19152 | 150.08 | 619 | 608 | 123.6 |
| A | 14 | 63 | 15220 | 118.26 | 619 | 608 | 123.6 |
| A | 13 | 254 | 10236 | 77.92 | 619 | 608 | 123.6 |
| B | 5 | 172 | 290157 | 2524.63 | 623 | 609 | 114.7 |
| B | 15 | 201 | 65422 | 565.12 | 623 | 609 | 114.7 |
| B | 0 | 197 | 64456 | 556.7 | 623 | 609 | 114.7 |
| C | 0 | 10 | 278686 | 1993.62 | 611 | 618 | 139.5 |
| C | 14 | 67 | 125185 | 893.09 | 611 | 618 | 139.5 |
| C | 1 | 241 | 31793 | 223.51 | 611 | 618 | 139.5 |
| D | 8 | 195 | 1459930 | 10166.04 | 576 | 564 | 143.6 |
| D | 12 | 227 | 1149946 | 8006.67 | 576 | 564 | 143.6 |
| D | 2 | 250 | 498461 | 3468.38 | 576 | 564 | 143.6 |
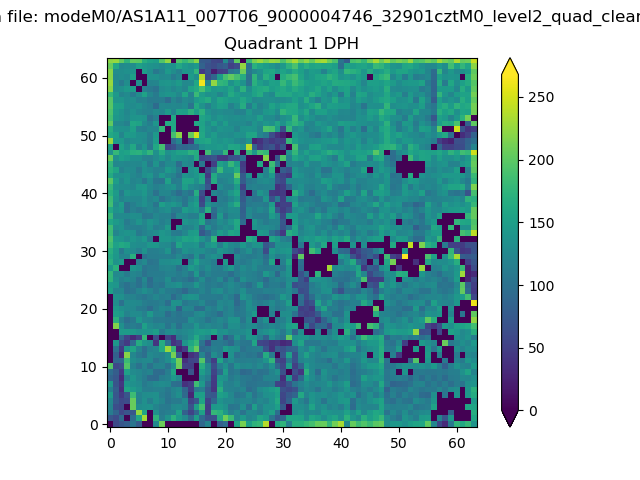
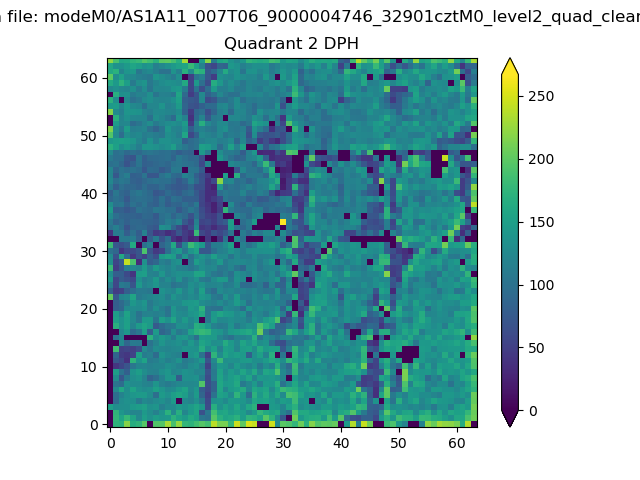
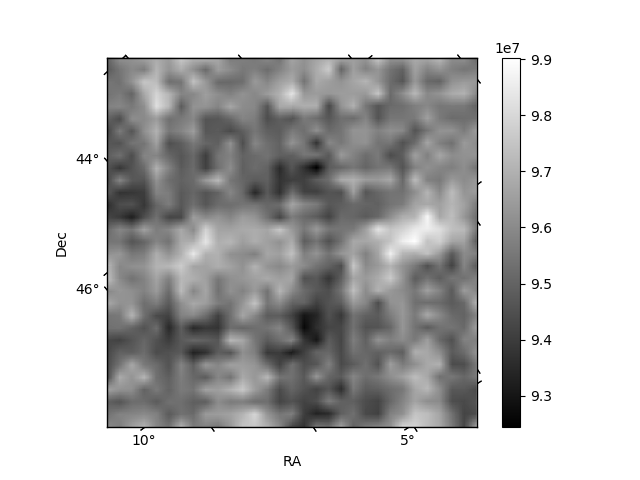
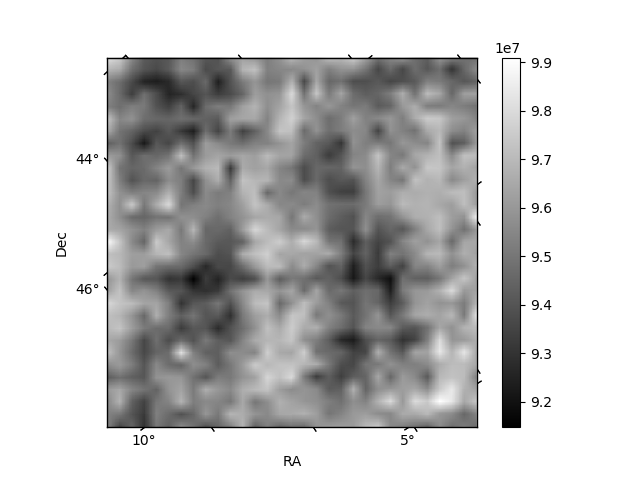
Histogram calculated using DETX and DETY for each event in the final _common_clean file
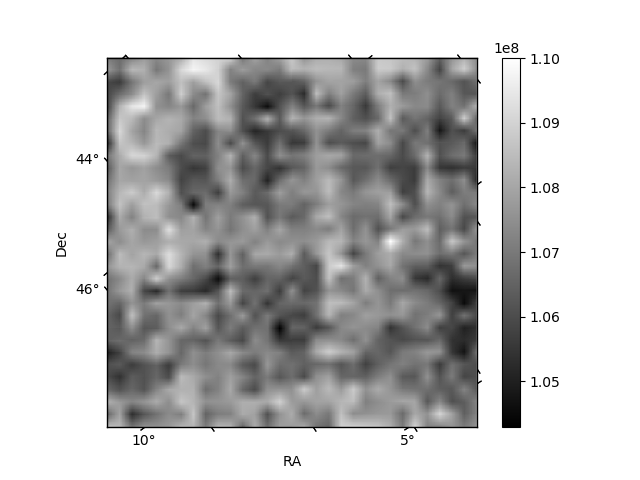
| Quadrant A |  |
 |
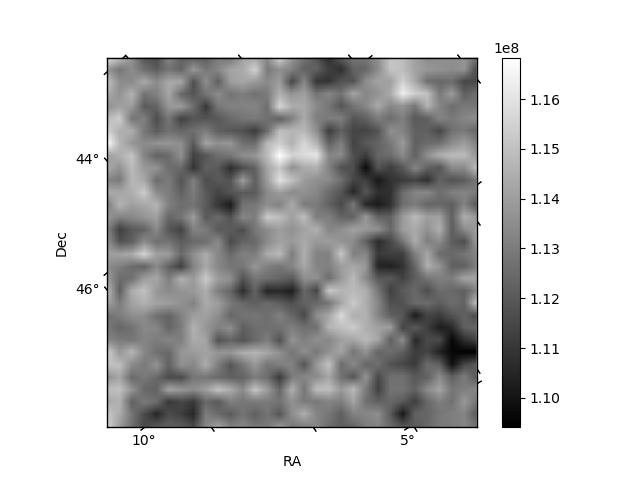
Quadrant B |
|---|---|---|---|
| Quadrant D |  |
 |
Quadrant C |
| Plot type | Count rate plots | Images |
|---|---|---|
| Comparison with Poisson distribution Blue bars denote a histogram of data divided into 1 sec bins. Red curve is a Poisson curve with rate = median count rate of data. |
 |
 |
| Quadrant-wise count rates Data is divided into 100 sec bins |
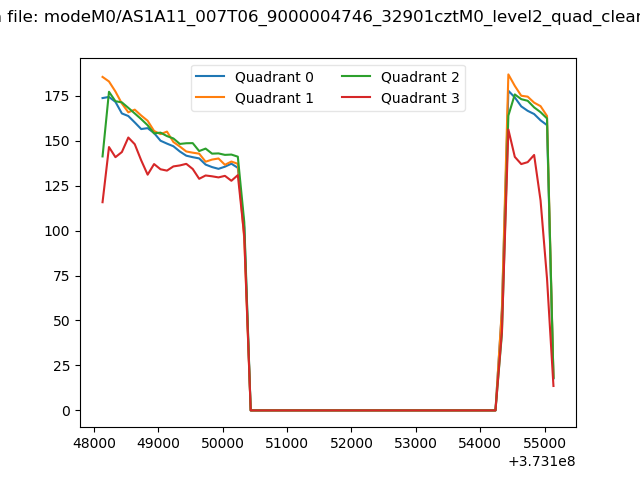 |
|
| Module-wise count rates for Quadrant A Data is divided into 100 sec bins |
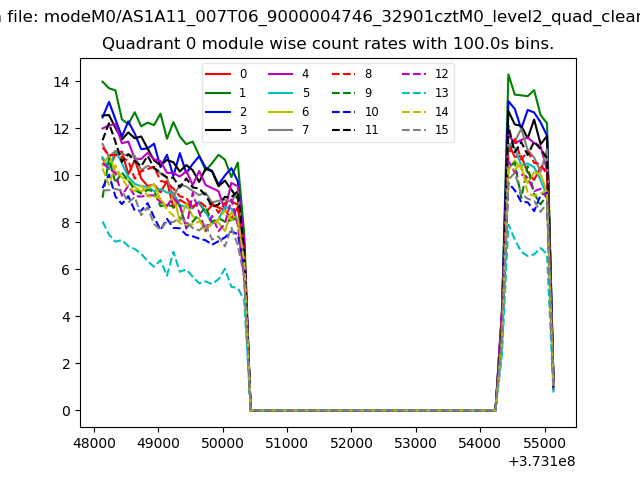 |
 |
| Module-wise count rates for Quadrant B Data is divided into 100 sec bins |
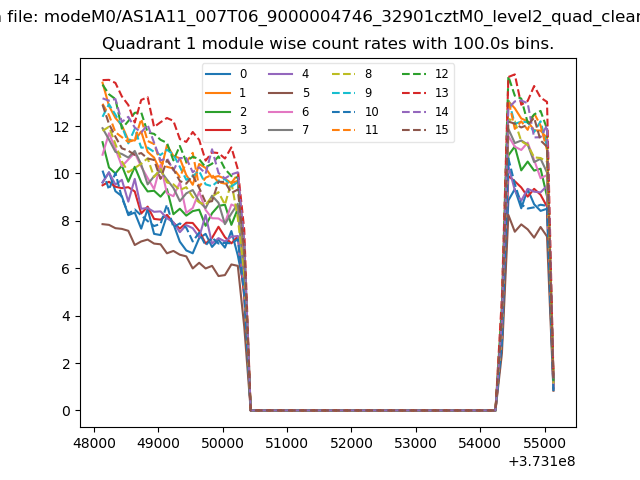 |
 |
| Module-wise count rates for Quadrant C Data is divided into 100 sec bins |
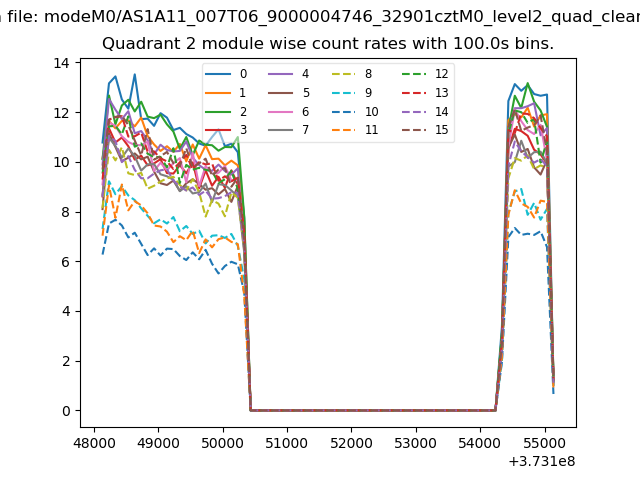 |
 |
| Module-wise count rates for Quadrant D Data is divided into 100 sec bins |
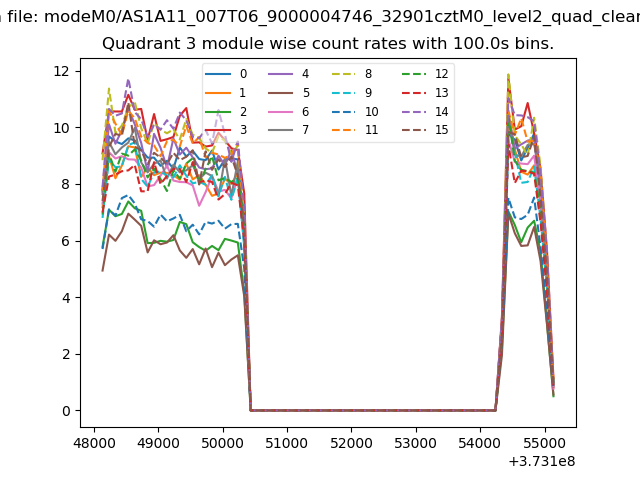 |
 |
| Parameter | Plot |
|---|---|
| CZT HV Monitor |  |
| D_VDD | 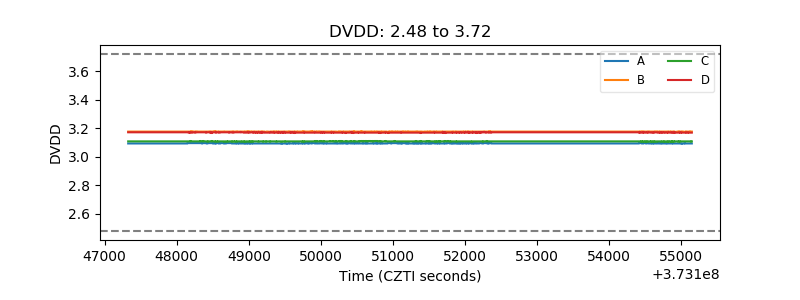 |
| Temperature 1 | 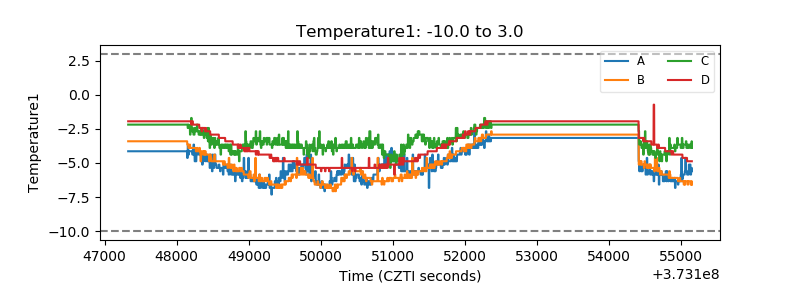 |
| Veto HV Monitor | 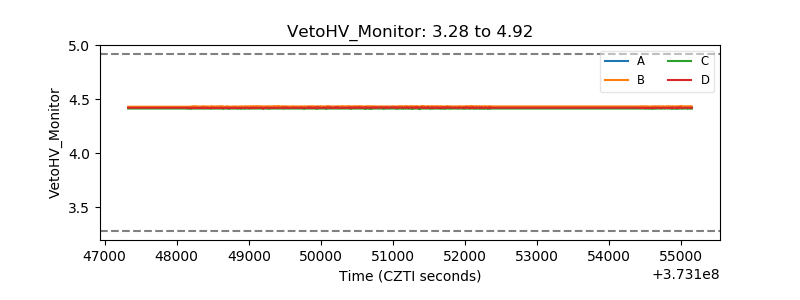 |
| Veto LLD | 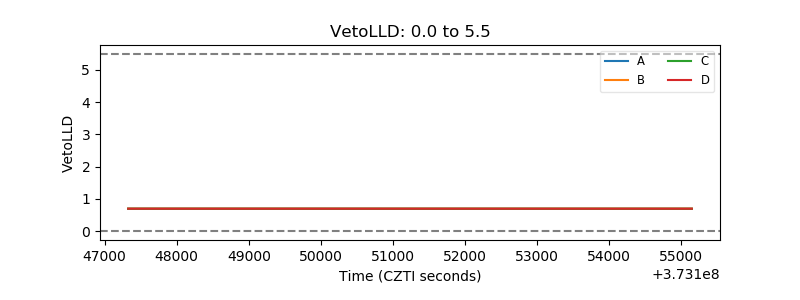 |
| Alpha Counter | 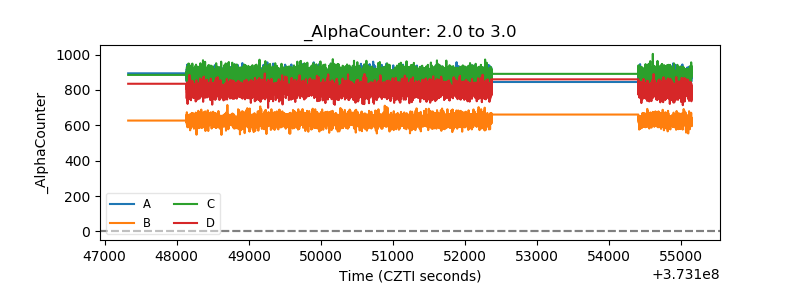 |
| _CPM_Rate | 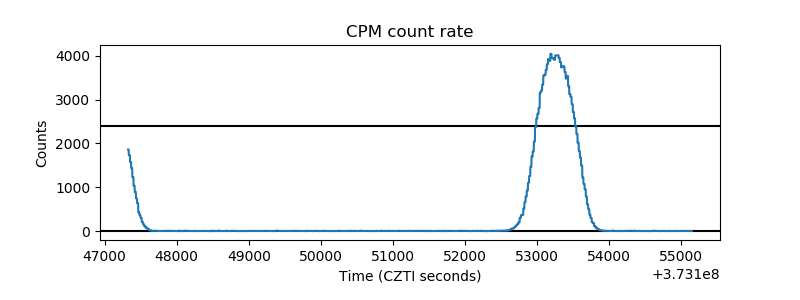 |
| CZT Counter | 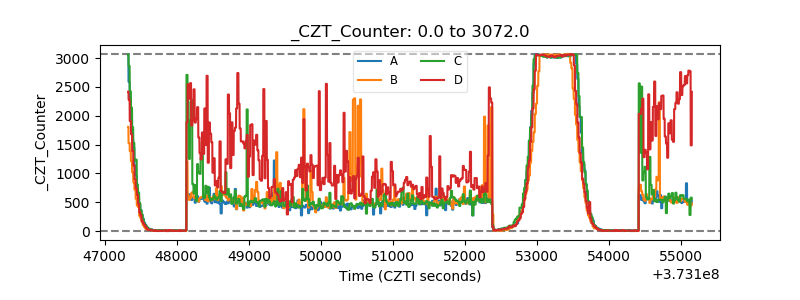 |
| +2.5 Volts monitor |  |
| +5 Volts monitor |  |
| _ROLL_ROT | 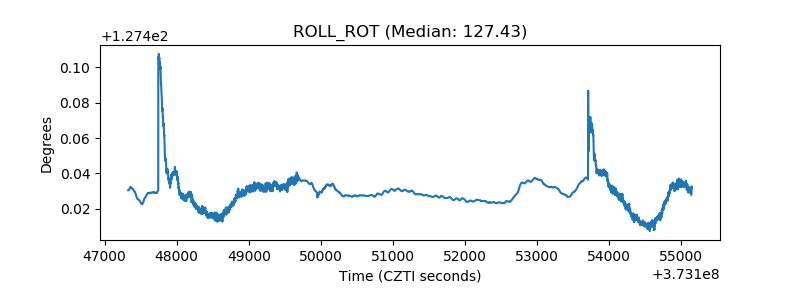 |
| _Roll_DEC | 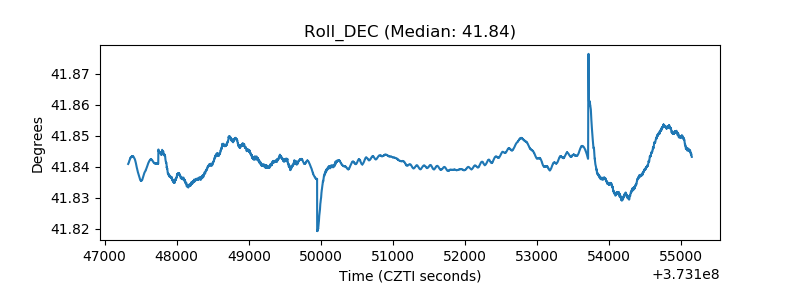 |
| _Roll_RA | 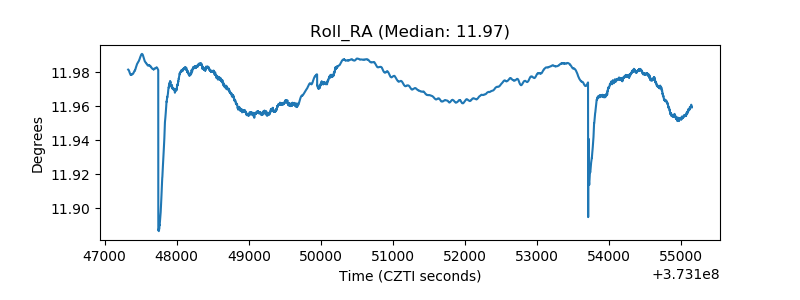 |
| Veto Counter | 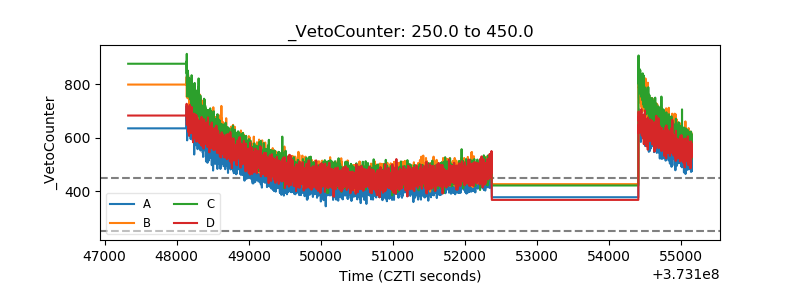 |