| Param | Original file | Final file |
|---|---|---|
| Filename | modeM0/AS1A11_007T06_9000004746_32902cztM0_level2.evt | modeM0/AS1A11_007T06_9000004746_32902cztM0_level2_quad_clean.evt |
| Size (bytes) | 562,248,000 | 68,497,920 |
| Size | 536.2 MB | 65.3 MB |
| Events in quadrant A | 2,461,415 | 450,428 |
| Events in quadrant B | 3,037,610 | 456,065 |
| Events in quadrant C | 2,885,717 | 454,015 |
| Events in quadrant D | 8,308,369 | 365,939 |
| Mode SS | |||
|---|---|---|---|
| Quadrant | BADHDUFLAG | Total packets | Discarded packets |
| A | 0 | 102 | 0 |
| B | 0 | 102 | 0 |
| C | 0 | 102 | 0 |
| D | 0 | 102 | 0 |
| Mode M9 | |||
|---|---|---|---|
| Quadrant | BADHDUFLAG | Total packets | Discarded packets |
| A | 0 | 36 | 0 |
| B | 0 | 36 | 0 |
| C | 0 | 36 | 0 |
| D | 0 | 37 | 0 |
| Mode M0 | |||
|---|---|---|---|
| Quadrant | BADHDUFLAG | Total packets | Discarded packets |
| A | 0 | 10207 | 3 |
| B | 0 | 11971 | 2 |
| C | 0 | 11557 | 2 |
| D | 0 | 28114 | 2 |
| Quadrant | Total seconds | Saturated seconds | Saturation percentage |
|---|---|---|---|
| A | 4945 | 16 | 0.323559% |
| B | 4945 | 184 | 3.720930% |
| C | 4945 | 89 | 1.799798% |
| D | 4945 | 1312 | 26.531850% |
Noise dominated data is calculated using 1-second bins in cleaned event files. If a bin has >2000 counts, and if more than 50% of those come from <1% of pixels, then it is considered to be noise-dominated and hence unusable.
| Quadrant | # 1 sec bins | Bins with >0 counts | Bins with >2000 counts | High rate bins dominated by noise | Noise dominated (total time) | Noise dominated (detector-on time) | Marked lightcurve |
|---|---|---|---|---|---|---|---|
| A | 7068 | 4946 | 17 | 17 | 0.24% | 0.34% | 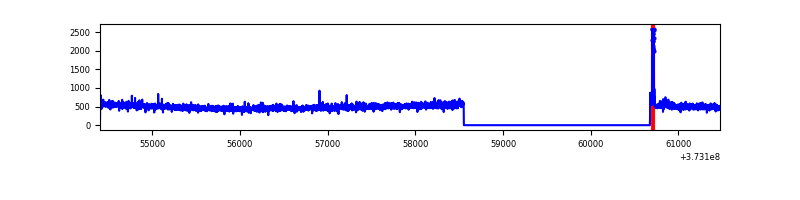 |
| B | 7068 | 4945 | 114 | 114 | 1.61% | 2.31% | 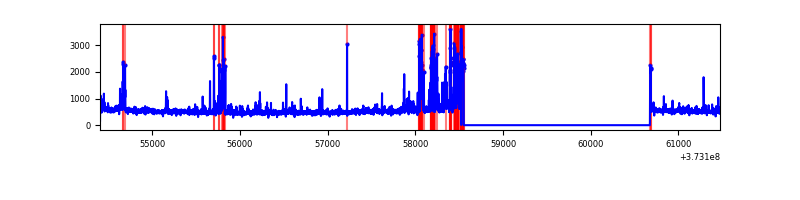 |
| C | 7068 | 4946 | 74 | 74 | 1.05% | 1.50% | 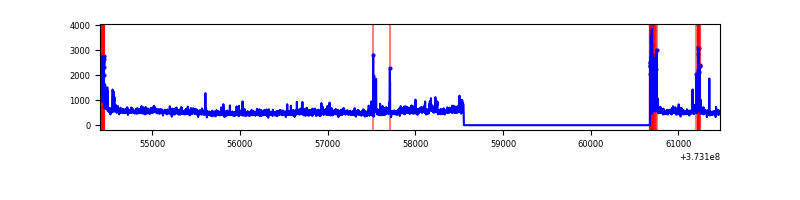 |
| D | 7068 | 4946 | 1583 | 1583 | 22.40% | 32.01% | 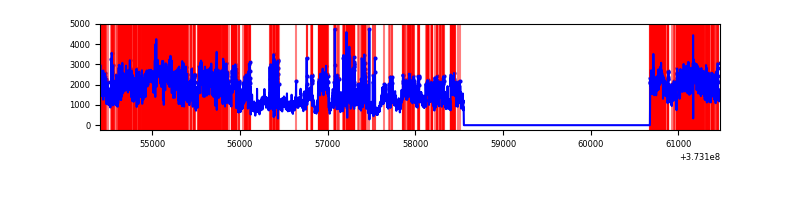 |
Top three noisy pixels from each quadrant. If the there are fewer than three noisy pixels in the level2.evt file, extra rows are filled as -1
| Pixel properties | Quadrant properties | ||||||
|---|---|---|---|---|---|---|---|
| Quadrant | DetID | PixID | Counts | Sigma | Mean | Median | Sigma |
| A | 9 | 143 | 42773 | 340.73 | 618 | 608 | 123.8 |
| A | 14 | 63 | 19923 | 156.08 | 618 | 608 | 123.8 |
| A | 13 | 254 | 8656 | 65.03 | 618 | 608 | 123.8 |
| B | 5 | 172 | 440926 | 3816.19 | 615 | 601 | 115.4 |
| B | 0 | 219 | 50322 | 430.92 | 615 | 601 | 115.4 |
| B | 0 | 197 | 42158 | 360.16 | 615 | 601 | 115.4 |
| C | 0 | 10 | 279227 | 2016.17 | 606 | 613 | 138.2 |
| C | 14 | 67 | 134759 | 970.74 | 606 | 613 | 138.2 |
| C | 3 | 233 | 65633 | 470.51 | 606 | 613 | 138.2 |
| D | 12 | 227 | 3618045 | 25083.41 | 551 | 542 | 144.2 |
| D | 8 | 195 | 1107351 | 7674.5 | 551 | 542 | 144.2 |
| D | 10 | 203 | 424546 | 2940.0 | 551 | 542 | 144.2 |
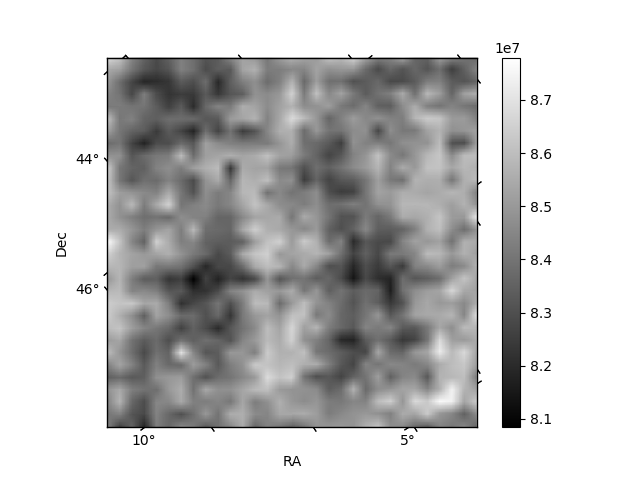
Histogram calculated using DETX and DETY for each event in the final _common_clean file
| Quadrant A | 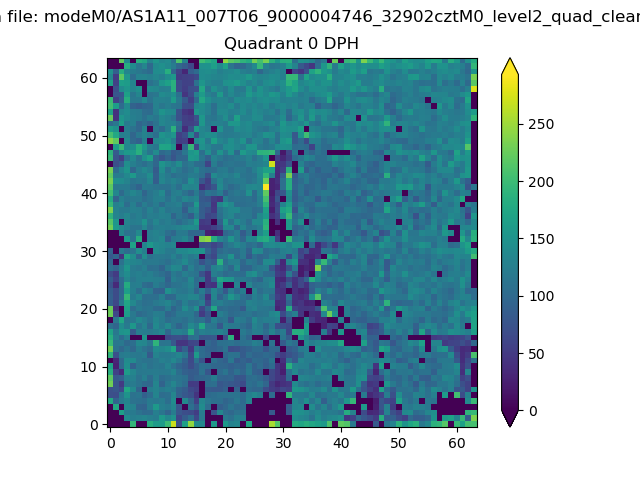 |
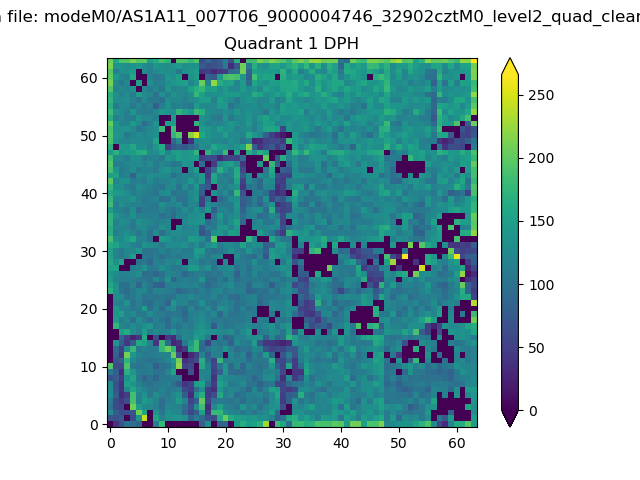 |
Quadrant B |
|---|---|---|---|
| Quadrant D |  |
 |
Quadrant C |
| Plot type | Count rate plots | Images |
|---|---|---|
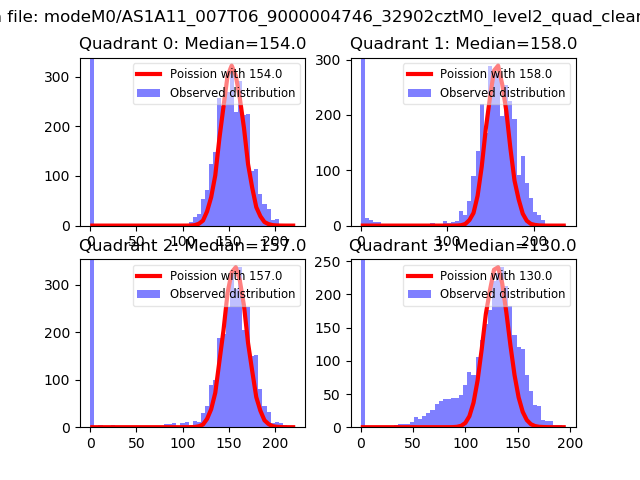
| Comparison with Poisson distribution Blue bars denote a histogram of data divided into 1 sec bins. Red curve is a Poisson curve with rate = median count rate of data. |
 |
 |
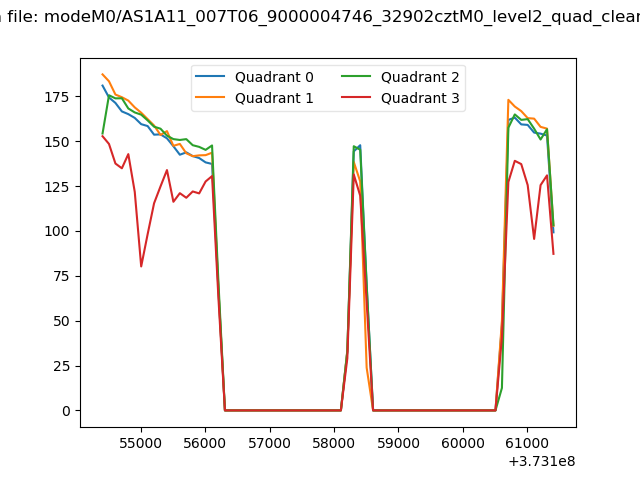
| Quadrant-wise count rates Data is divided into 100 sec bins |
 |
|
| Module-wise count rates for Quadrant A Data is divided into 100 sec bins |
 |
 |
| Module-wise count rates for Quadrant B Data is divided into 100 sec bins |
 |
 |
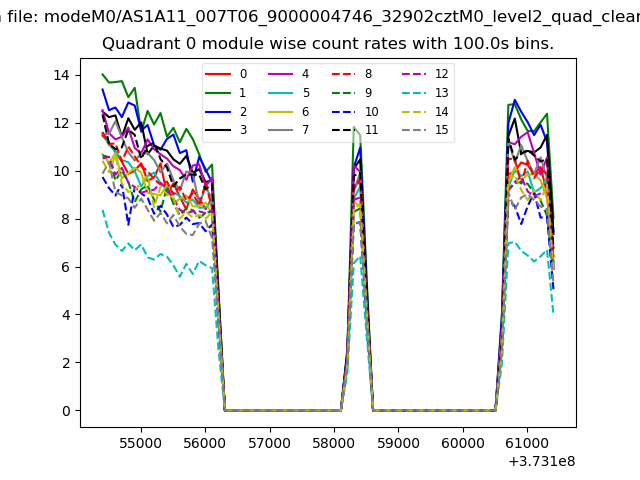
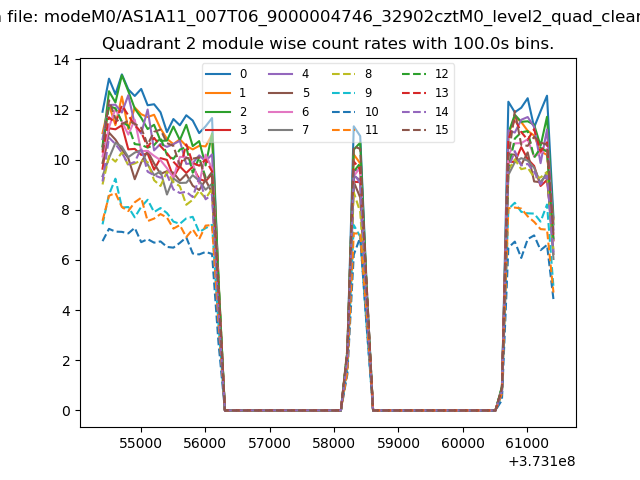
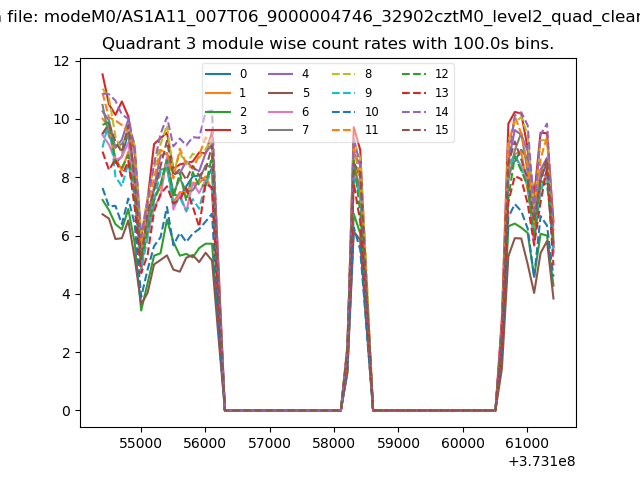
| Module-wise count rates for Quadrant C Data is divided into 100 sec bins |
 |
 |
| Module-wise count rates for Quadrant D Data is divided into 100 sec bins |
 |
 |
| Parameter | Plot |
|---|---|
| CZT HV Monitor | 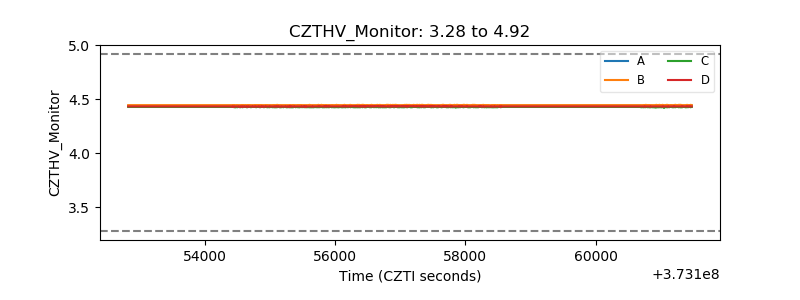 |
| D_VDD | 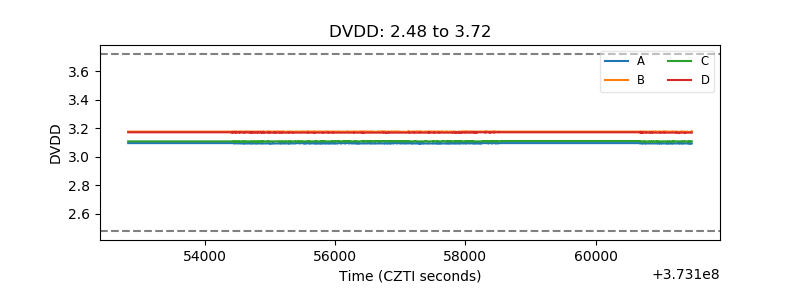 |
| Temperature 1 | 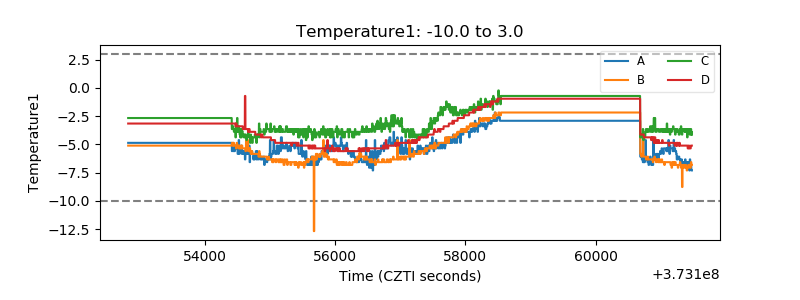 |
| Veto HV Monitor | 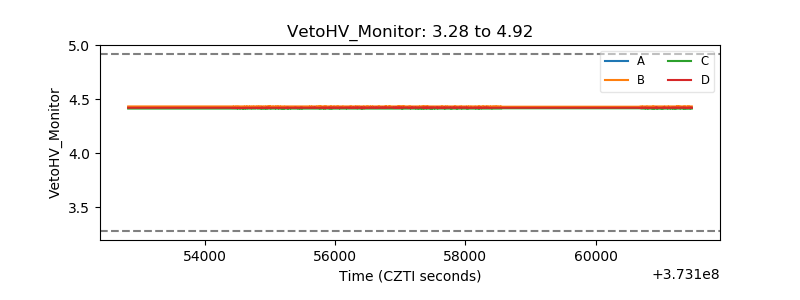 |
| Veto LLD | 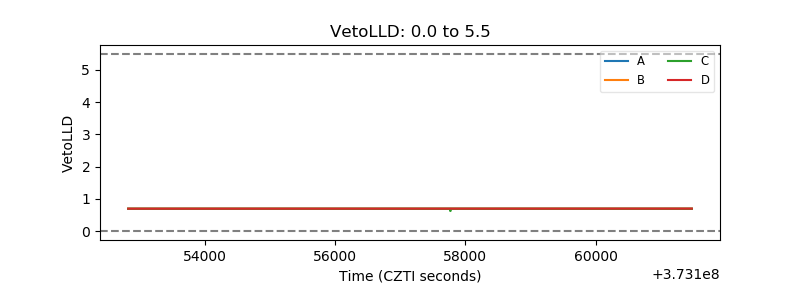 |
| Alpha Counter | 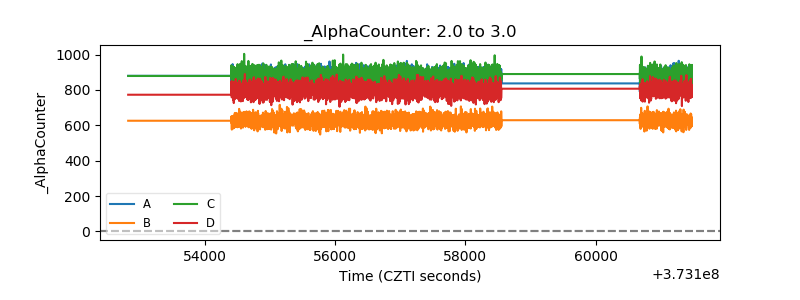 |
| _CPM_Rate | 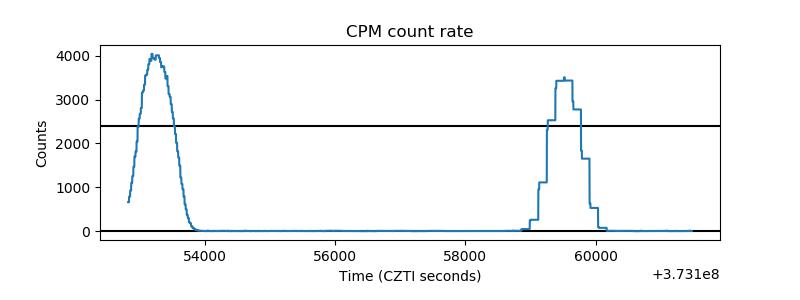 |
| CZT Counter |  |
| +2.5 Volts monitor |  |
| +5 Volts monitor | 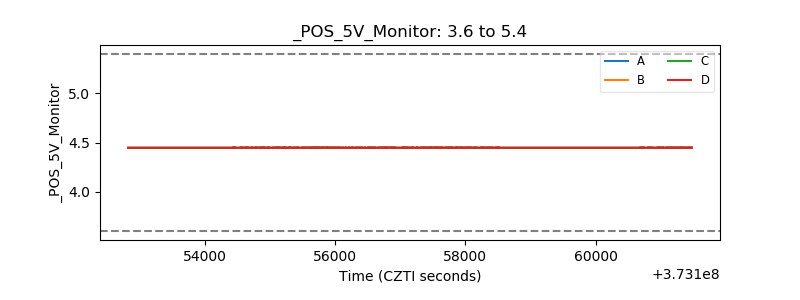 |
| _ROLL_ROT | 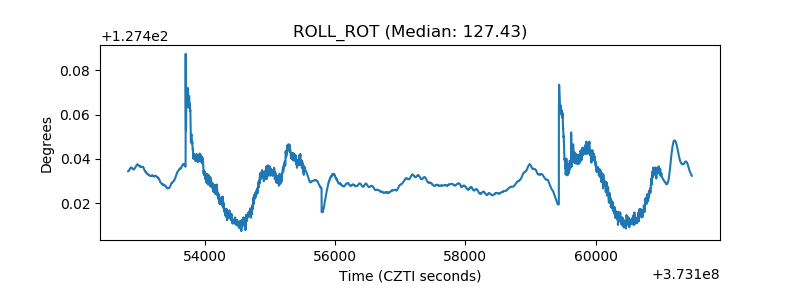 |
| _Roll_DEC | 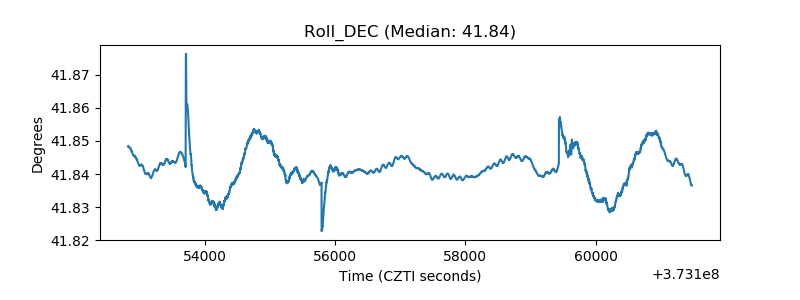 |
| _Roll_RA |  |
| Veto Counter | 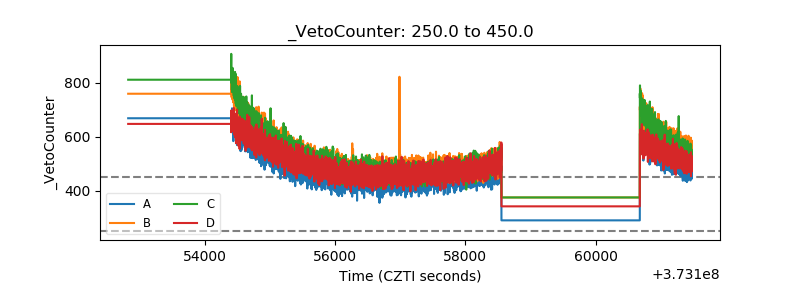 |