| Param | Original file | Final file |
|---|---|---|
| Filename | modeM0/AS1C07_005T01_9000004748_32904cztM0_level2.evt | modeM0/AS1C07_005T01_9000004748_32904cztM0_level2_quad_clean.evt |
| Size (bytes) | 546,600,960 | 94,354,560 |
| Size | 521.3 MB | 90.0 MB |
| Events in quadrant A | 2,447,545 | 645,757 |
| Events in quadrant B | 3,342,023 | 652,943 |
| Events in quadrant C | 2,834,688 | 652,710 |
| Events in quadrant D | 7,582,485 | 546,270 |
| Mode SS | |||
|---|---|---|---|
| Quadrant | BADHDUFLAG | Total packets | Discarded packets |
| A | 0 | 104 | 0 |
| B | 0 | 104 | 0 |
| C | 0 | 104 | 0 |
| D | 0 | 104 | 0 |
| Mode M9 | |||
|---|---|---|---|
| Quadrant | BADHDUFLAG | Total packets | Discarded packets |
| A | 0 | 32 | 0 |
| B | 0 | 32 | 0 |
| C | 0 | 32 | 0 |
| D | 0 | 33 | 0 |
| Mode M0 | |||
|---|---|---|---|
| Quadrant | BADHDUFLAG | Total packets | Discarded packets |
| A | 0 | 10424 | 3 |
| B | 0 | 13252 | 2 |
| C | 0 | 11401 | 2 |
| D | 0 | 26143 | 2 |
| Quadrant | Total seconds | Saturated seconds | Saturation percentage |
|---|---|---|---|
| A | 5129 | 6 | 0.116982% |
| B | 5129 | 217 | 4.230844% |
| C | 5129 | 50 | 0.974849% |
| D | 5129 | 1238 | 24.137259% |
Noise dominated data is calculated using 1-second bins in cleaned event files. If a bin has >2000 counts, and if more than 50% of those come from <1% of pixels, then it is considered to be noise-dominated and hence unusable.
| Quadrant | # 1 sec bins | Bins with >0 counts | Bins with >2000 counts | High rate bins dominated by noise | Noise dominated (total time) | Noise dominated (detector-on time) | Marked lightcurve |
|---|---|---|---|---|---|---|---|
| A | 7223 | 5130 | 0 | 0 | 0.00% | 0.00% | 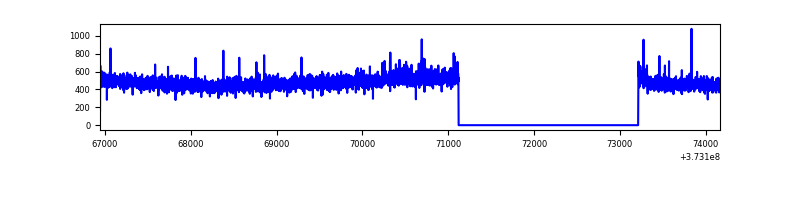 |
| B | 7223 | 5130 | 129 | 129 | 1.79% | 2.51% | 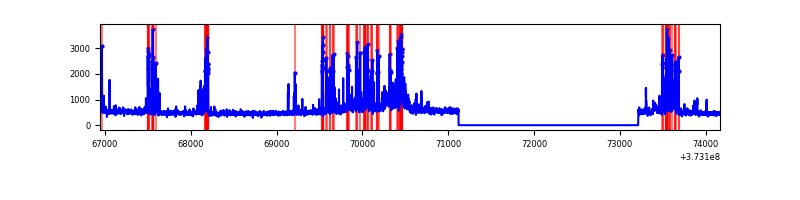 |
| C | 7223 | 5130 | 35 | 35 | 0.48% | 0.68% | 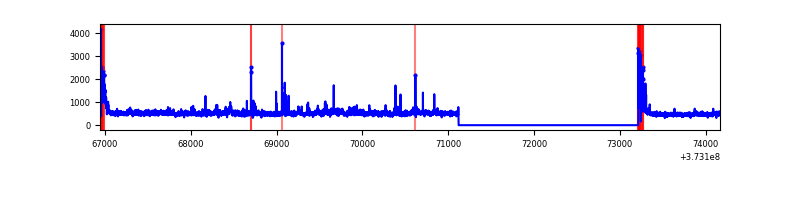 |
| D | 7223 | 5130 | 1186 | 1186 | 16.42% | 23.12% | 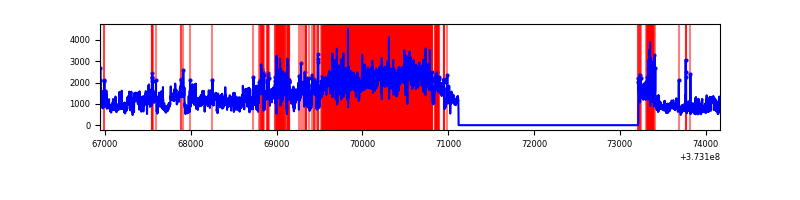 |
Top three noisy pixels from each quadrant. If the there are fewer than three noisy pixels in the level2.evt file, extra rows are filled as -1
| Pixel properties | Quadrant properties | ||||||
|---|---|---|---|---|---|---|---|
| Quadrant | DetID | PixID | Counts | Sigma | Mean | Median | Sigma |
| A | 14 | 63 | 33890 | 273.59 | 616 | 605 | 121.7 |
| A | 13 | 6 | 12347 | 96.52 | 616 | 605 | 121.7 |
| A | 0 | 159 | 10304 | 79.72 | 616 | 605 | 121.7 |
| B | 5 | 172 | 598412 | 5231.56 | 612 | 598 | 114.3 |
| B | 0 | 219 | 207083 | 1806.98 | 612 | 598 | 114.3 |
| B | 0 | 229 | 33064 | 284.11 | 612 | 598 | 114.3 |
| C | 0 | 10 | 208695 | 1490.67 | 610 | 615 | 139.6 |
| C | 14 | 67 | 145895 | 1040.78 | 610 | 615 | 139.6 |
| C | 1 | 241 | 32206 | 226.31 | 610 | 615 | 139.6 |
| D | 8 | 195 | 3188151 | 21969.25 | 559 | 549 | 145.1 |
| D | 12 | 227 | 1119049 | 7708.81 | 559 | 549 | 145.1 |
| D | 10 | 203 | 511501 | 3521.53 | 559 | 549 | 145.1 |
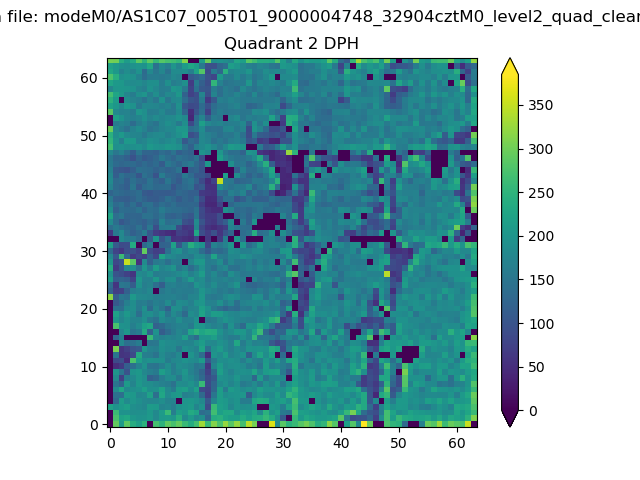
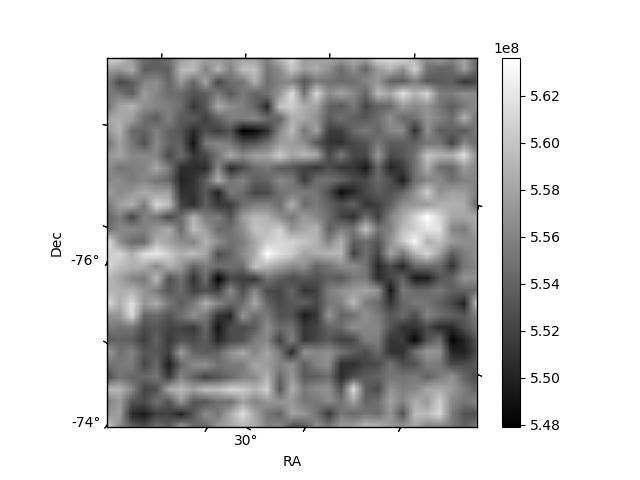
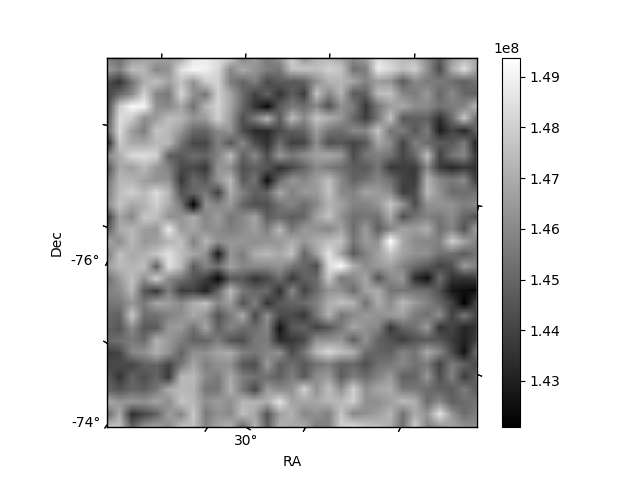
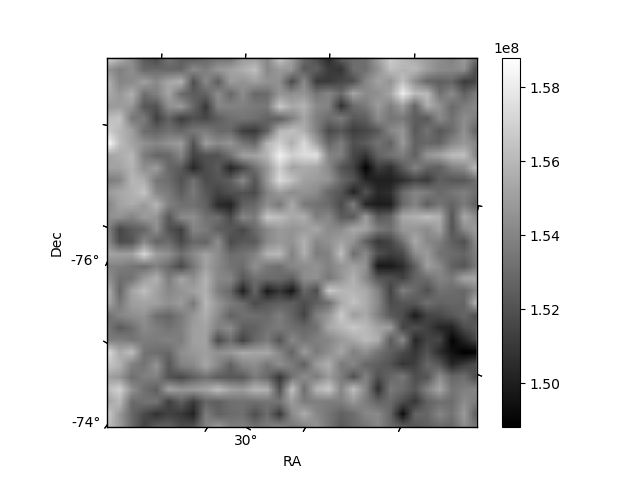
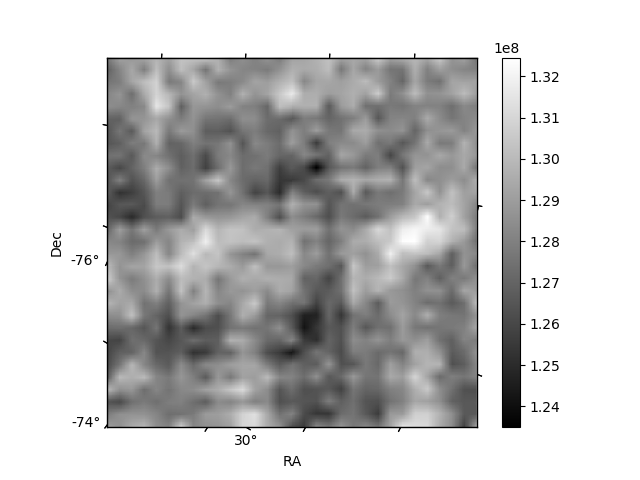
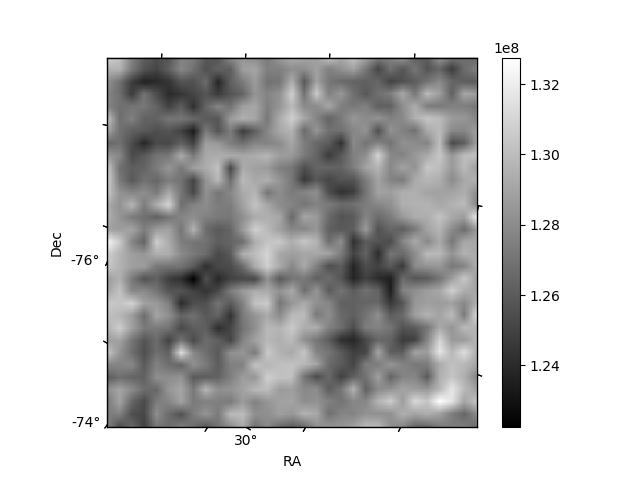
Histogram calculated using DETX and DETY for each event in the final _common_clean file
| Quadrant A | 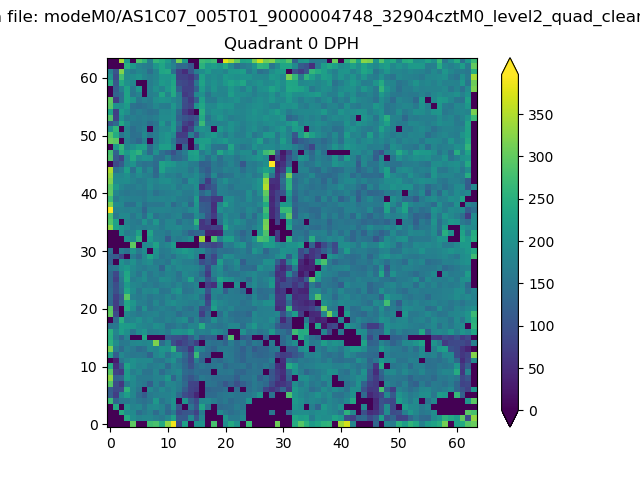 |
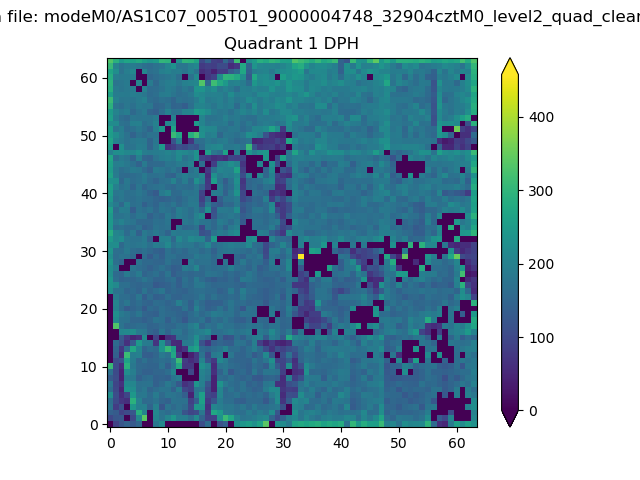 |
Quadrant B |
|---|---|---|---|
| Quadrant D | 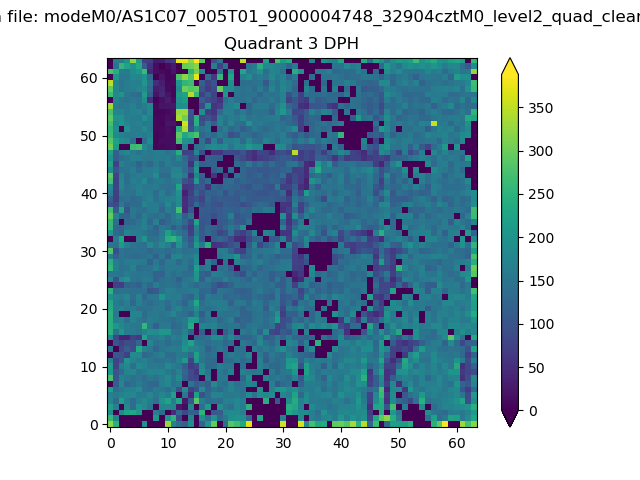 |
 |
Quadrant C |
| Plot type | Count rate plots | Images |
|---|---|---|
| Comparison with Poisson distribution Blue bars denote a histogram of data divided into 1 sec bins. Red curve is a Poisson curve with rate = median count rate of data. |
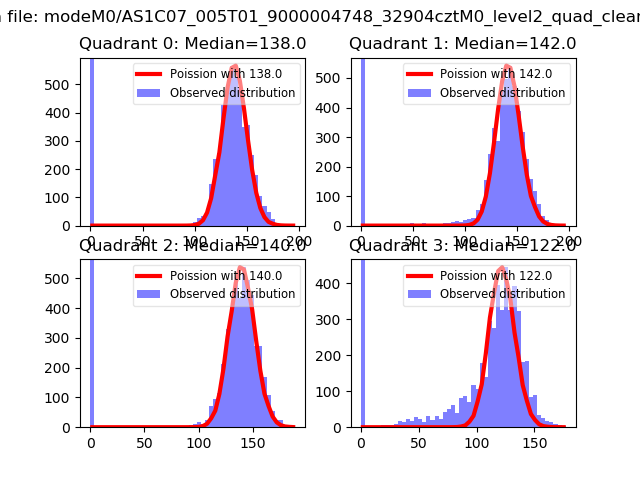 |
 |
| Quadrant-wise count rates Data is divided into 100 sec bins |
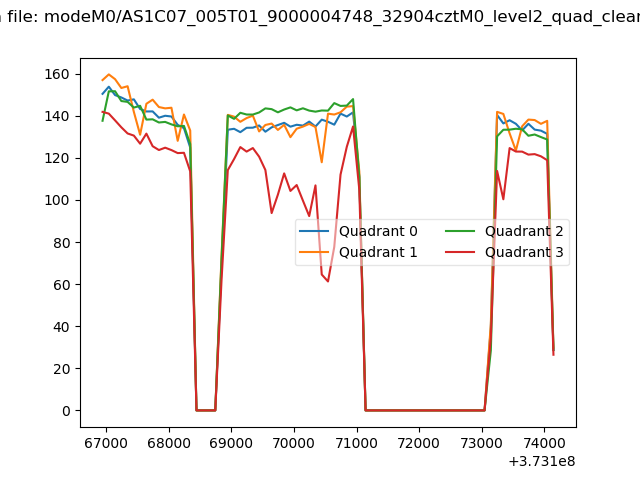 |
|
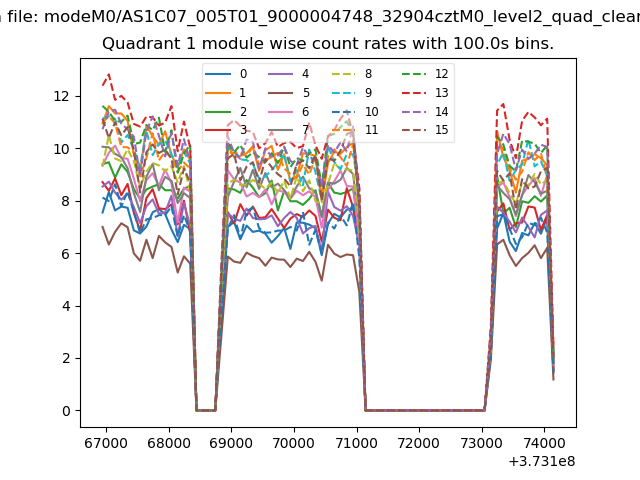
| Module-wise count rates for Quadrant A Data is divided into 100 sec bins |
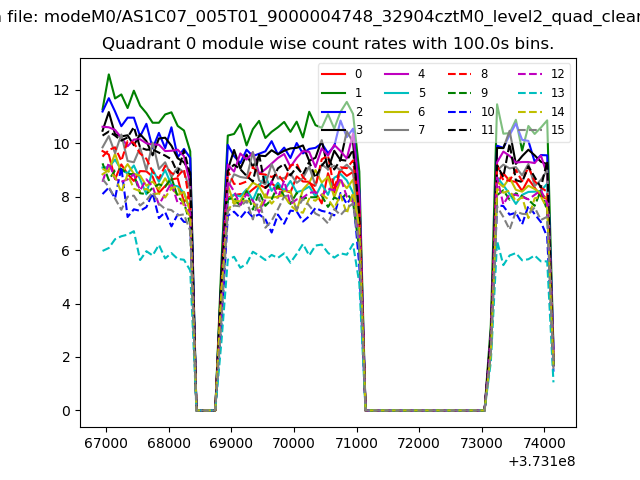 |
 |
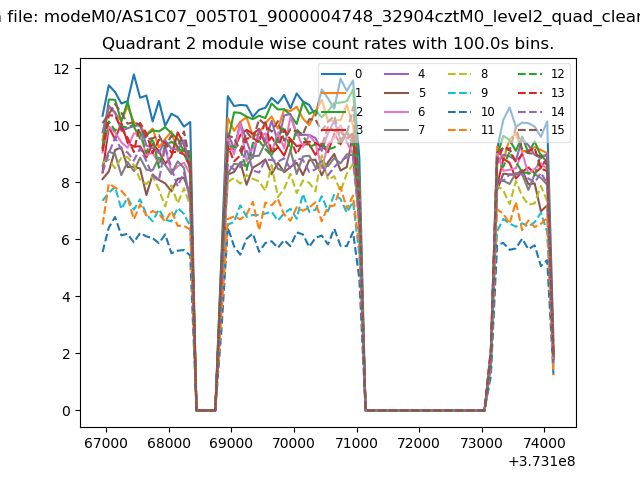
| Module-wise count rates for Quadrant B Data is divided into 100 sec bins |
 |
 |
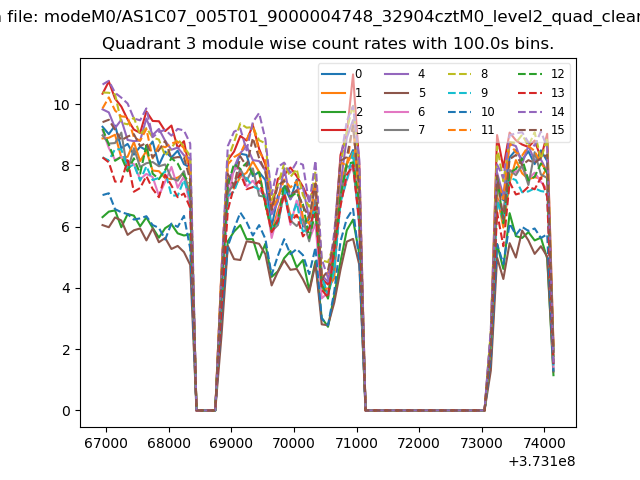
| Module-wise count rates for Quadrant C Data is divided into 100 sec bins |
 |
 |
| Module-wise count rates for Quadrant D Data is divided into 100 sec bins |
 |
 |
| Parameter | Plot |
|---|---|
| CZT HV Monitor | 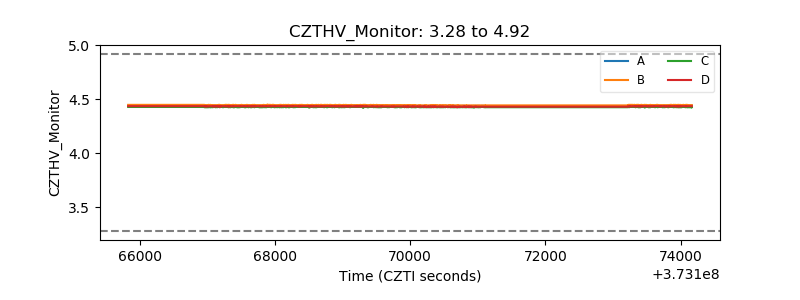 |
| D_VDD | 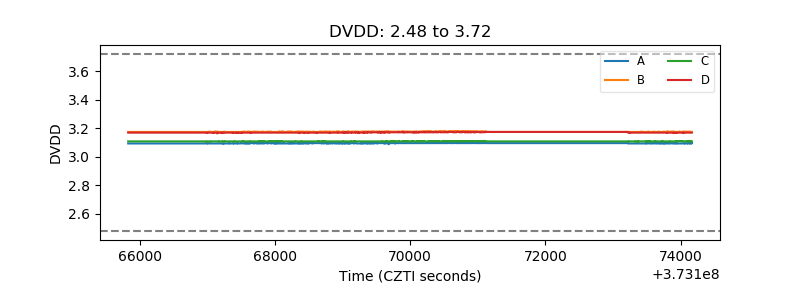 |
| Temperature 1 | 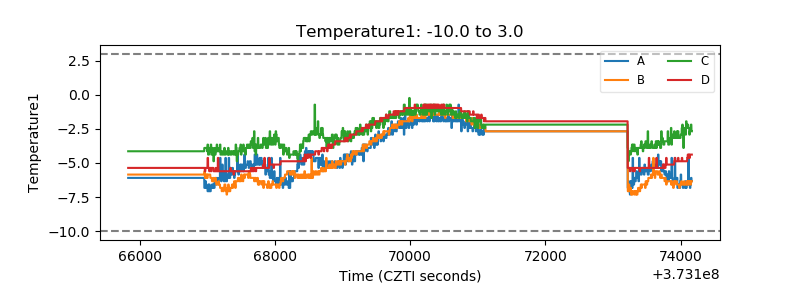 |
| Veto HV Monitor | 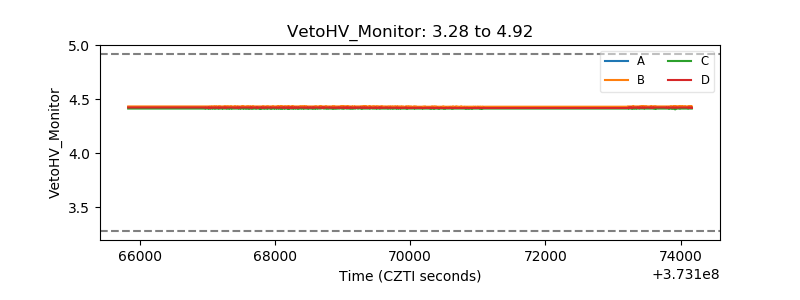 |
| Veto LLD | 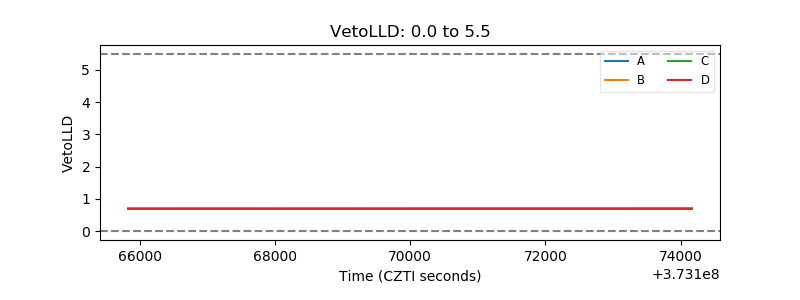 |
| Alpha Counter | 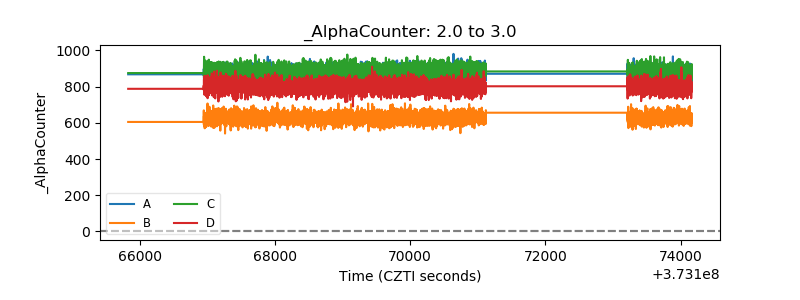 |
| _CPM_Rate | 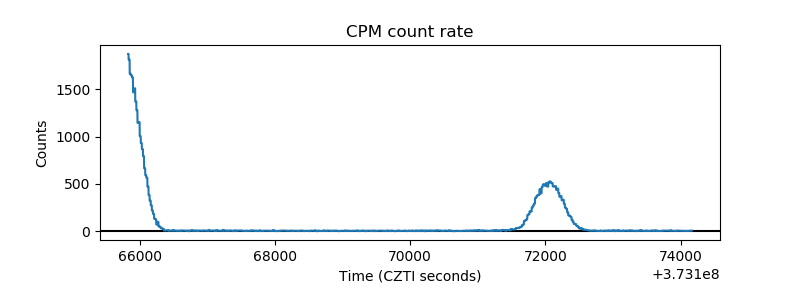 |
| CZT Counter | 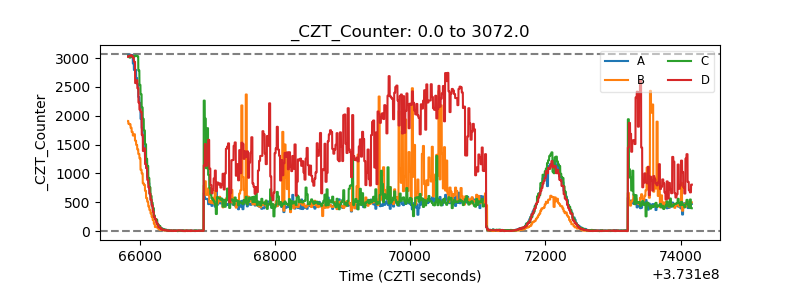 |
| +2.5 Volts monitor | 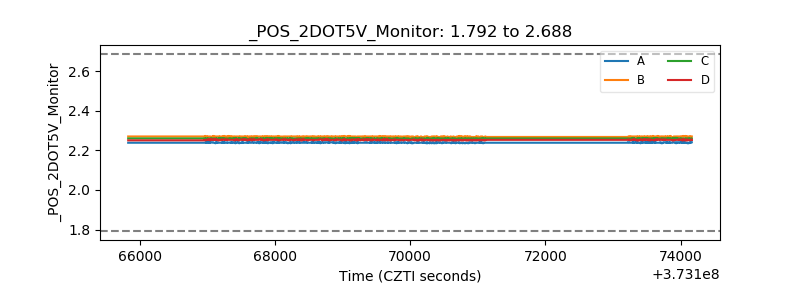 |
| +5 Volts monitor | 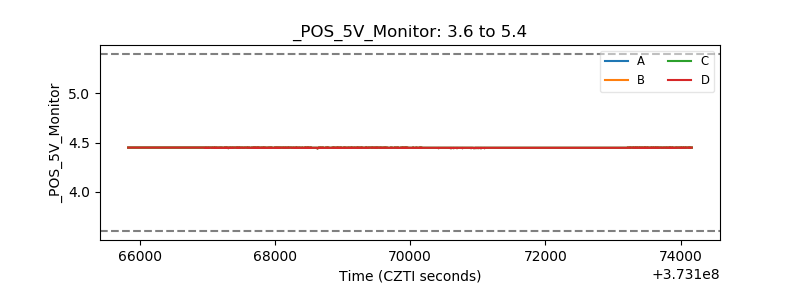 |
| _ROLL_ROT | 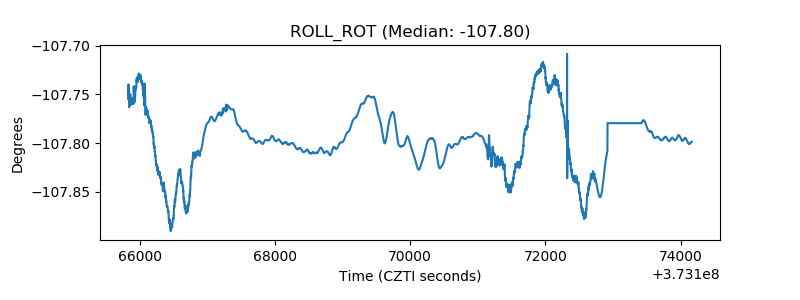 |
| _Roll_DEC | 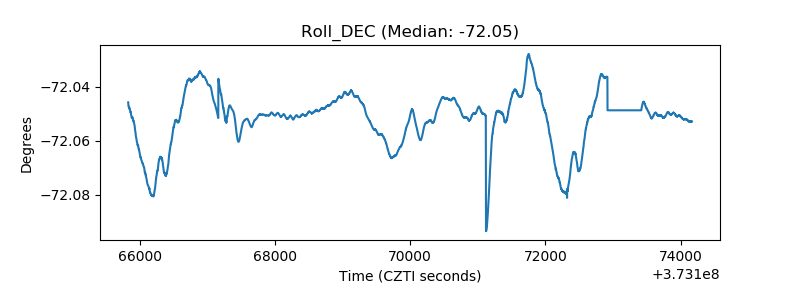 |
| _Roll_RA | 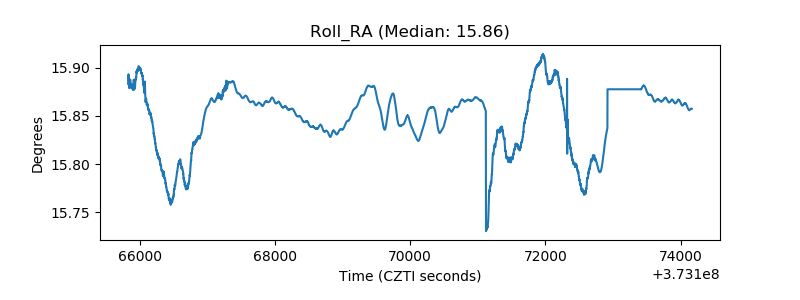 |
| Veto Counter | 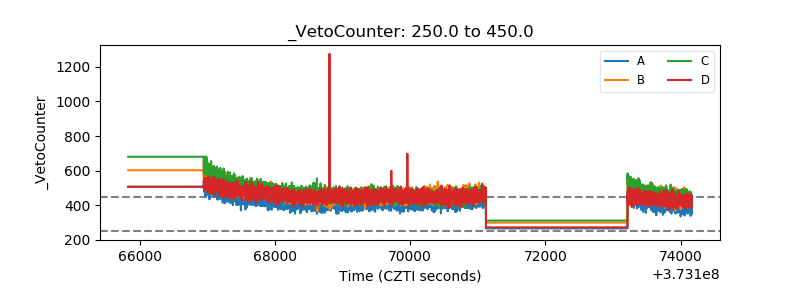 |