| Param | Original file | Final file |
|---|---|---|
| Filename | modeM0/AS1C07_005T01_9000004748_32905cztM0_level2.evt | modeM0/AS1C07_005T01_9000004748_32905cztM0_level2_quad_clean.evt |
| Size (bytes) | 555,721,920 | 85,161,600 |
| Size | 530.0 MB | 81.2 MB |
| Events in quadrant A | 2,565,671 | 578,093 |
| Events in quadrant B | 3,557,092 | 573,365 |
| Events in quadrant C | 2,579,214 | 587,269 |
| Events in quadrant D | 7,790,008 | 489,223 |
| Mode SS | |||
|---|---|---|---|
| Quadrant | BADHDUFLAG | Total packets | Discarded packets |
| A | 0 | 104 | 0 |
| B | 0 | 104 | 0 |
| C | 0 | 104 | 0 |
| D | 0 | 104 | 0 |
| Mode M9 | |||
|---|---|---|---|
| Quadrant | BADHDUFLAG | Total packets | Discarded packets |
| A | 0 | 18 | 0 |
| B | 0 | 18 | 0 |
| C | 0 | 18 | 0 |
| D | 0 | 18 | 0 |
| Mode M0 | |||
|---|---|---|---|
| Quadrant | BADHDUFLAG | Total packets | Discarded packets |
| A | 0 | 10967 | 2 |
| B | 0 | 13767 | 1 |
| C | 0 | 10716 | 1 |
| D | 0 | 26646 | 1 |
| Quadrant | Total seconds | Saturated seconds | Saturation percentage |
|---|---|---|---|
| A | 4990 | 17 | 0.340681% |
| B | 4990 | 351 | 7.034068% |
| C | 4990 | 44 | 0.881764% |
| D | 4990 | 1215 | 24.348697% |
Noise dominated data is calculated using 1-second bins in cleaned event files. If a bin has >2000 counts, and if more than 50% of those come from <1% of pixels, then it is considered to be noise-dominated and hence unusable.
| Quadrant | # 1 sec bins | Bins with >0 counts | Bins with >2000 counts | High rate bins dominated by noise | Noise dominated (total time) | Noise dominated (detector-on time) | Marked lightcurve |
|---|---|---|---|---|---|---|---|
| A | 6842 | 4991 | 7 | 7 | 0.10% | 0.14% | 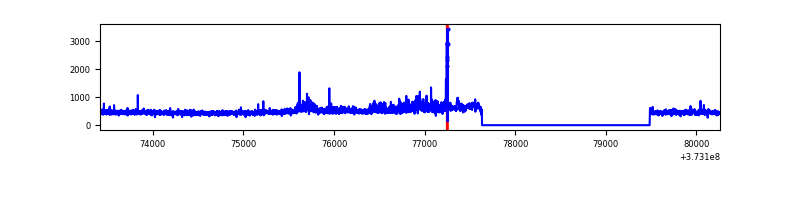 |
| B | 6842 | 4991 | 226 | 226 | 3.30% | 4.53% | 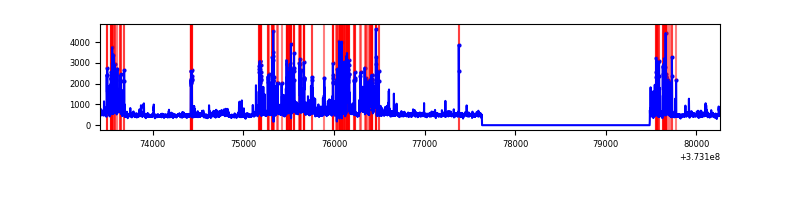 |
| C | 6842 | 4991 | 29 | 29 | 0.42% | 0.58% | 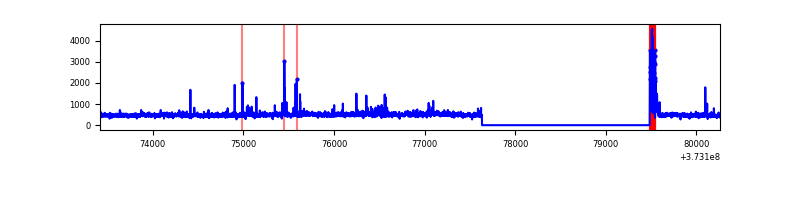 |
| D | 6842 | 4991 | 1347 | 1347 | 19.69% | 26.99% | 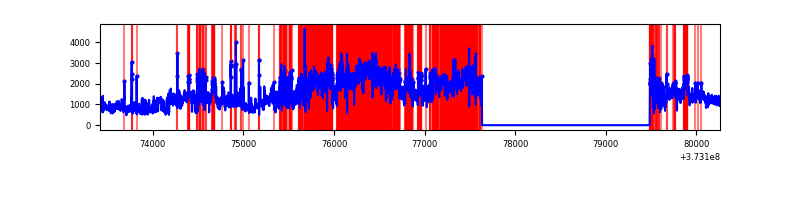 |
Top three noisy pixels from each quadrant. If the there are fewer than three noisy pixels in the level2.evt file, extra rows are filled as -1
| Pixel properties | Quadrant properties | ||||||
|---|---|---|---|---|---|---|---|
| Quadrant | DetID | PixID | Counts | Sigma | Mean | Median | Sigma |
| A | 14 | 63 | 244822 | 2107.21 | 583 | 571 | 115.9 |
| A | 0 | 31 | 29659 | 250.95 | 583 | 571 | 115.9 |
| A | 0 | 135 | 23516 | 197.95 | 583 | 571 | 115.9 |
| B | 5 | 172 | 928123 | 8636.07 | 569 | 556 | 107.4 |
| B | 0 | 219 | 92186 | 853.12 | 569 | 556 | 107.4 |
| B | 0 | 230 | 88976 | 823.23 | 569 | 556 | 107.4 |
| C | 0 | 10 | 163929 | 1243.25 | 572 | 577 | 131.4 |
| C | 14 | 67 | 96978 | 733.69 | 572 | 577 | 131.4 |
| C | 1 | 241 | 51035 | 384.03 | 572 | 577 | 131.4 |
| D | 8 | 195 | 2741952 | 20291.95 | 527 | 515 | 135.1 |
| D | 12 | 227 | 1687679 | 12488.29 | 527 | 515 | 135.1 |
| D | 10 | 203 | 660452 | 4884.81 | 527 | 515 | 135.1 |
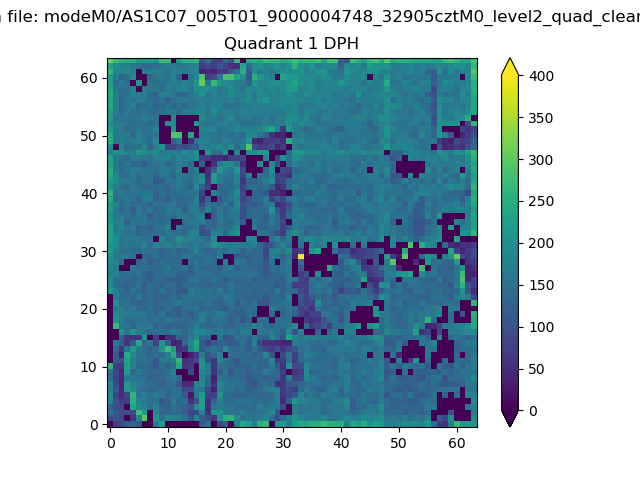
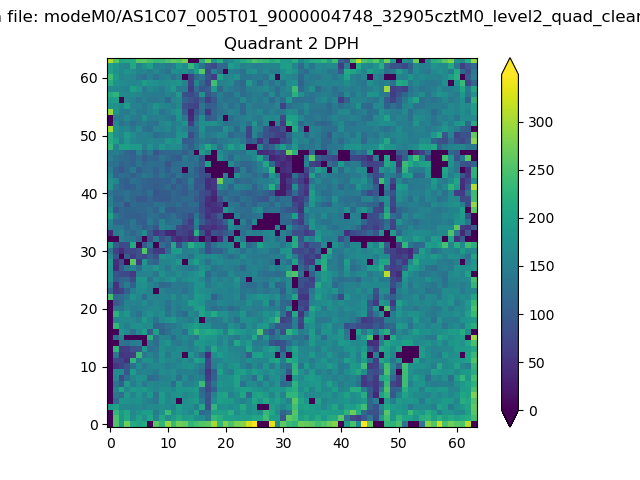
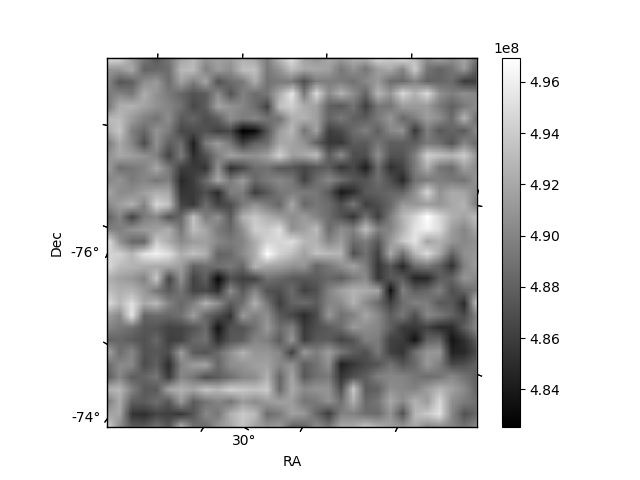
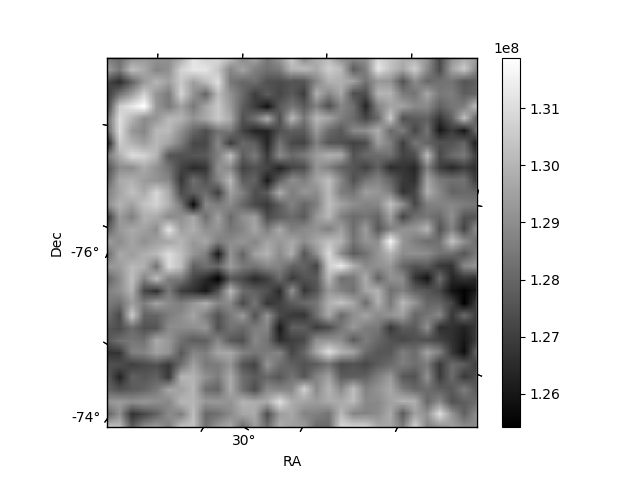
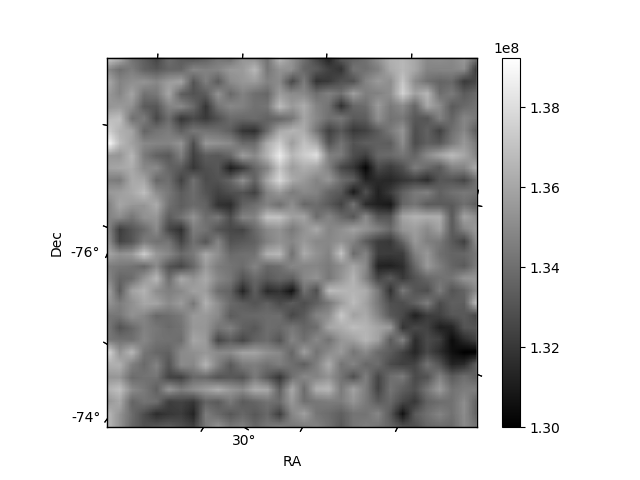
Histogram calculated using DETX and DETY for each event in the final _common_clean file
| Quadrant A |  |
 |
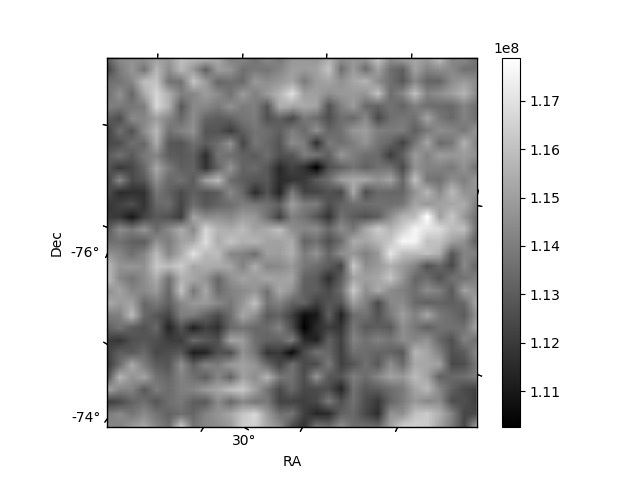
Quadrant B |
|---|---|---|---|
| Quadrant D | 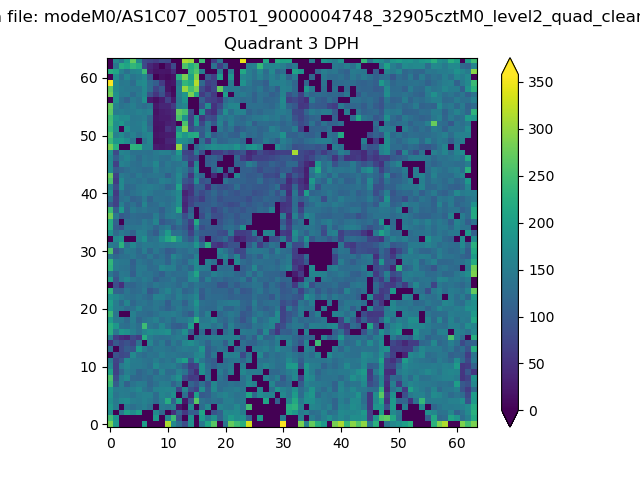 |
 |
Quadrant C |
| Plot type | Count rate plots | Images |
|---|---|---|
| Comparison with Poisson distribution Blue bars denote a histogram of data divided into 1 sec bins. Red curve is a Poisson curve with rate = median count rate of data. |
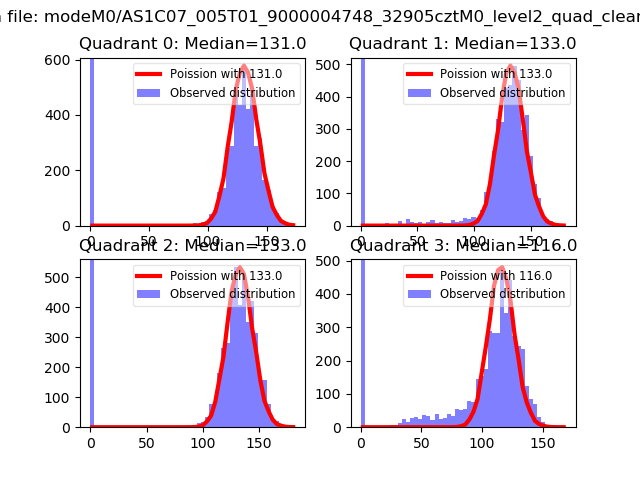 |
 |
| Quadrant-wise count rates Data is divided into 100 sec bins |
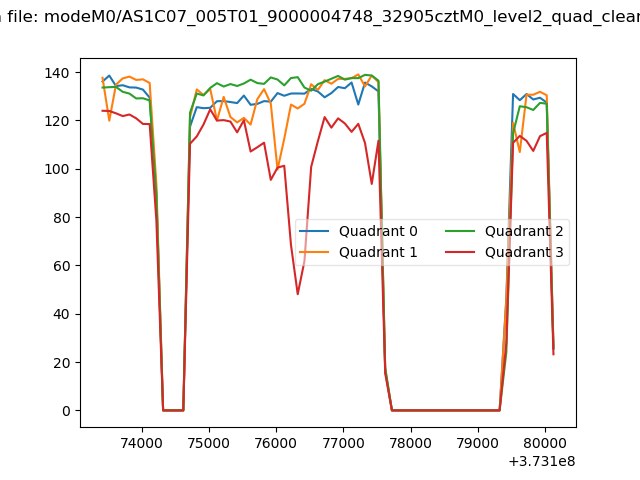 |
|
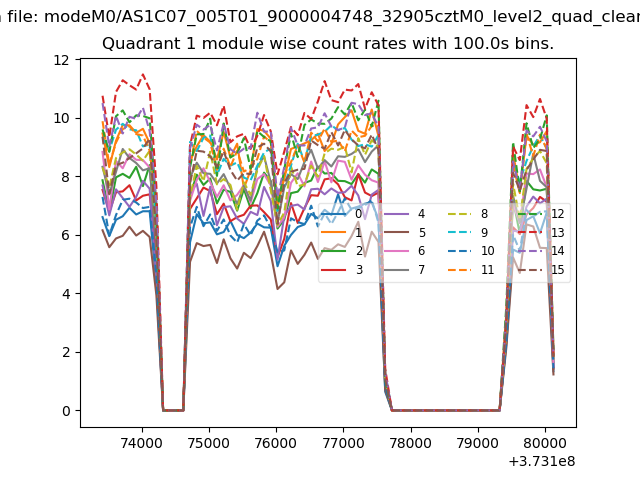
| Module-wise count rates for Quadrant A Data is divided into 100 sec bins |
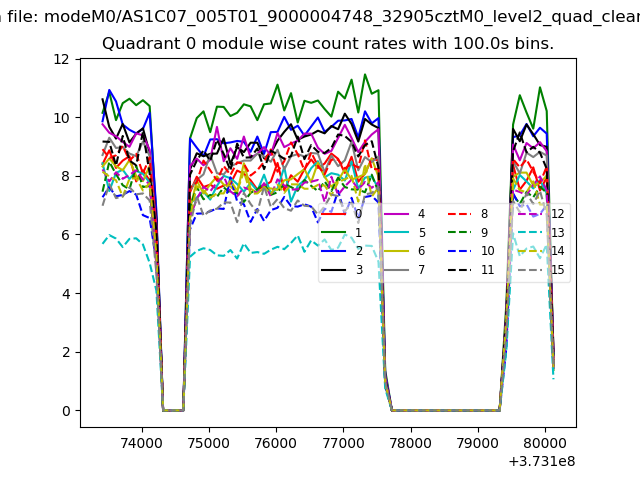 |
 |
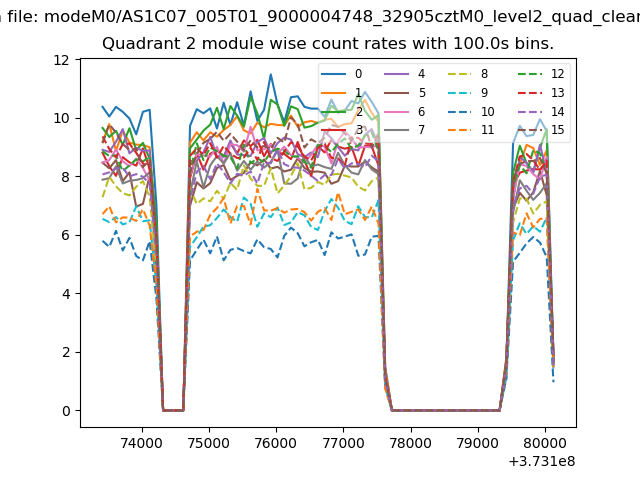
| Module-wise count rates for Quadrant B Data is divided into 100 sec bins |
 |
 |
| Module-wise count rates for Quadrant C Data is divided into 100 sec bins |
 |
 |
| Module-wise count rates for Quadrant D Data is divided into 100 sec bins |
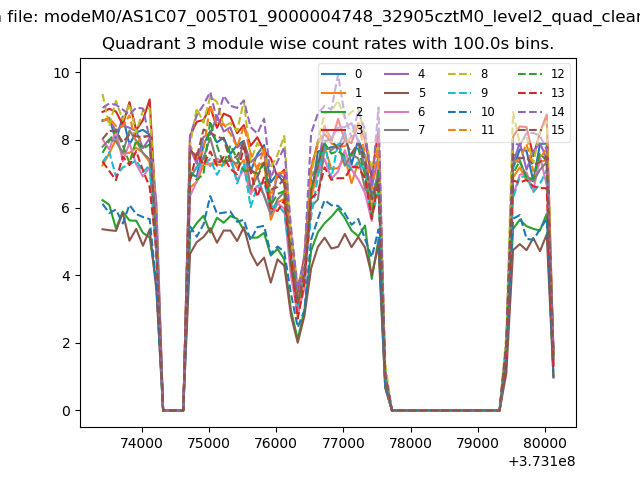 |
 |
| Parameter | Plot |
|---|---|
| CZT HV Monitor | 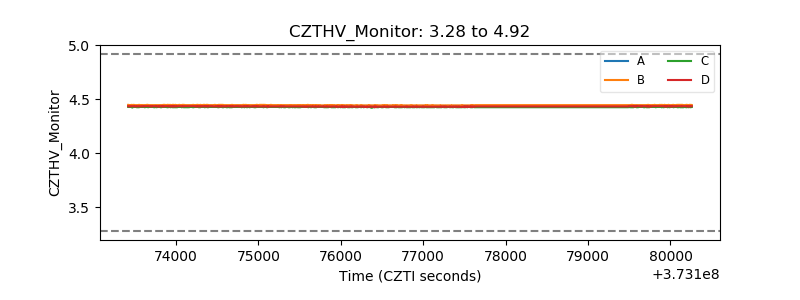 |
| D_VDD | 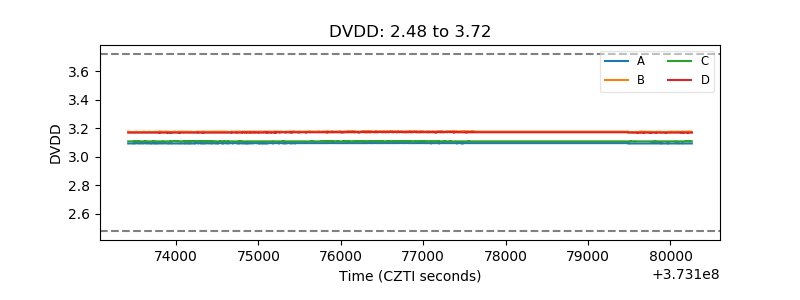 |
| Temperature 1 | 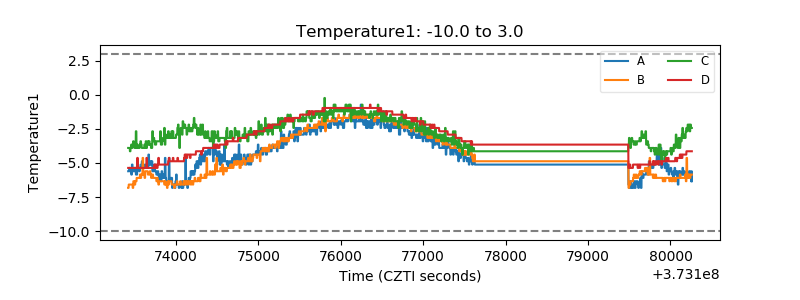 |
| Veto HV Monitor | 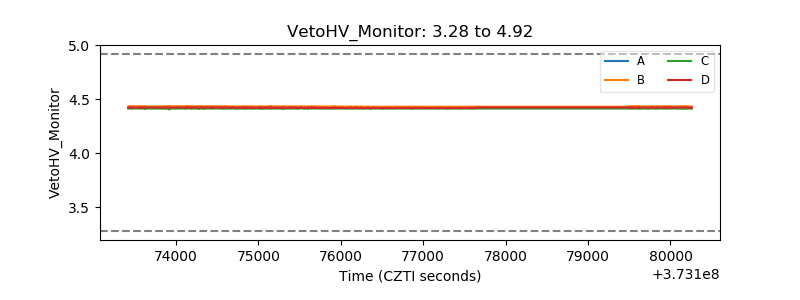 |
| Veto LLD | 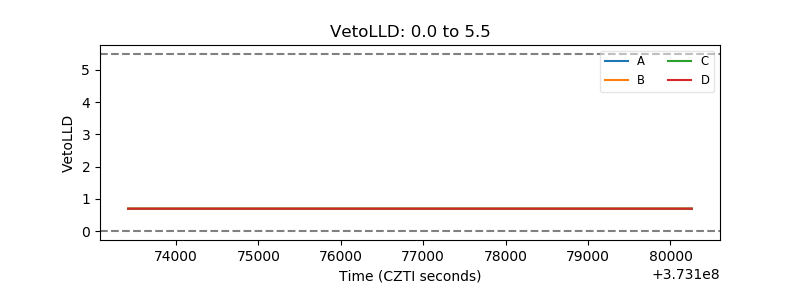 |
| Alpha Counter | 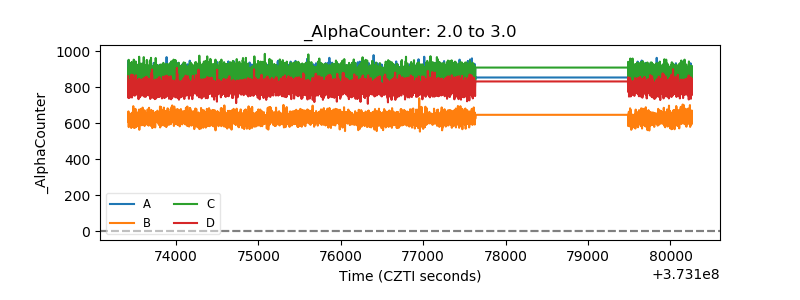 |
| _CPM_Rate | 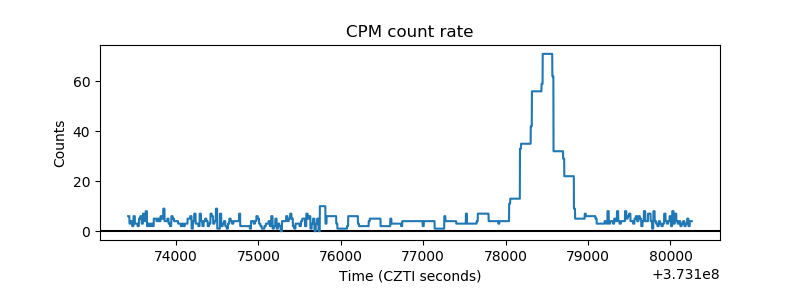 |
| CZT Counter | 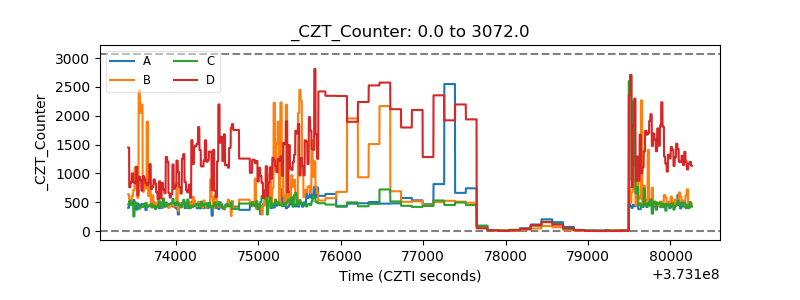 |
| +2.5 Volts monitor |  |
| +5 Volts monitor |  |
| _ROLL_ROT | 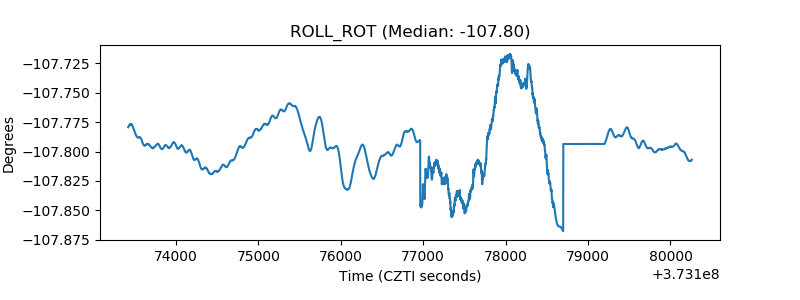 |
| _Roll_DEC | 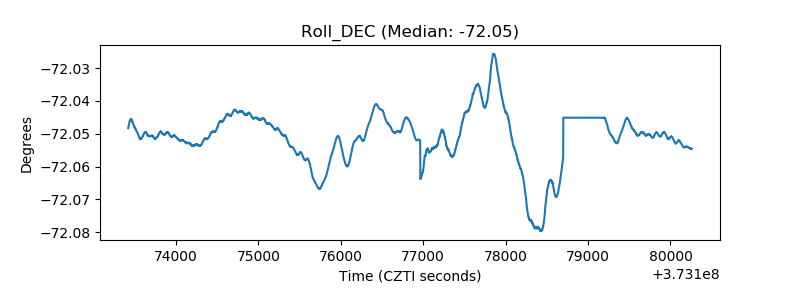 |
| _Roll_RA | 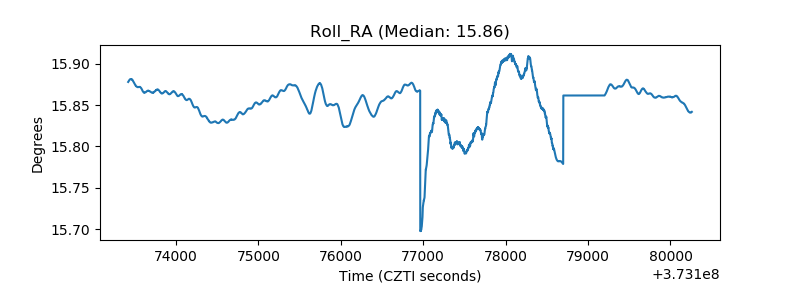 |
| Veto Counter | 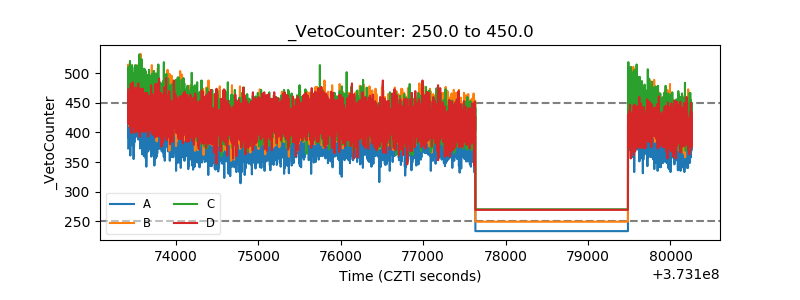 |