| Param | Original file | Final file |
|---|---|---|
| Filename | modeM0/AS1C07_005T01_9000004748_32907cztM0_level2.evt | modeM0/AS1C07_005T01_9000004748_32907cztM0_level2_quad_clean.evt |
| Size (bytes) | 628,488,000 | 96,701,760 |
| Size | 599.4 MB | 92.2 MB |
| Events in quadrant A | 2,851,617 | 649,036 |
| Events in quadrant B | 3,849,143 | 652,652 |
| Events in quadrant C | 3,421,879 | 657,877 |
| Events in quadrant D | 8,516,164 | 559,978 |
| Mode SS | |||
|---|---|---|---|
| Quadrant | BADHDUFLAG | Total packets | Discarded packets |
| A | 0 | 118 | 0 |
| B | 0 | 118 | 0 |
| C | 0 | 118 | 0 |
| D | 0 | 118 | 0 |
| Mode M9 | |||
|---|---|---|---|
| Quadrant | BADHDUFLAG | Total packets | Discarded packets |
| A | 0 | 22 | 0 |
| B | 0 | 22 | 0 |
| C | 0 | 22 | 0 |
| D | 0 | 23 | 0 |
| Mode M0 | |||
|---|---|---|---|
| Quadrant | BADHDUFLAG | Total packets | Discarded packets |
| A | 0 | 12208 | 3 |
| B | 0 | 15175 | 2 |
| C | 0 | 13834 | 2 |
| D | 0 | 29451 | 2 |
| Quadrant | Total seconds | Saturated seconds | Saturation percentage |
|---|---|---|---|
| A | 5846 | 12 | 0.205269% |
| B | 5846 | 236 | 4.036948% |
| C | 5846 | 145 | 2.480328% |
| D | 5846 | 1281 | 21.912419% |
Noise dominated data is calculated using 1-second bins in cleaned event files. If a bin has >2000 counts, and if more than 50% of those come from <1% of pixels, then it is considered to be noise-dominated and hence unusable.
| Quadrant | # 1 sec bins | Bins with >0 counts | Bins with >2000 counts | High rate bins dominated by noise | Noise dominated (total time) | Noise dominated (detector-on time) | Marked lightcurve |
|---|---|---|---|---|---|---|---|
| A | 7159 | 5847 | 1 | 1 | 0.01% | 0.02% | 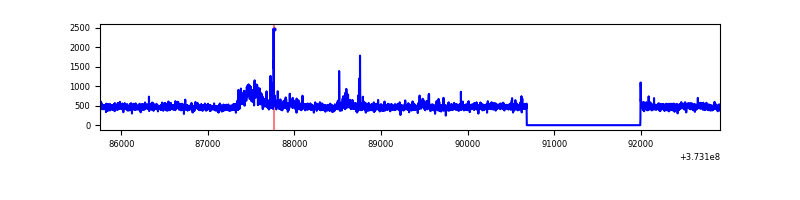 |
| B | 7159 | 5847 | 139 | 139 | 1.94% | 2.38% | 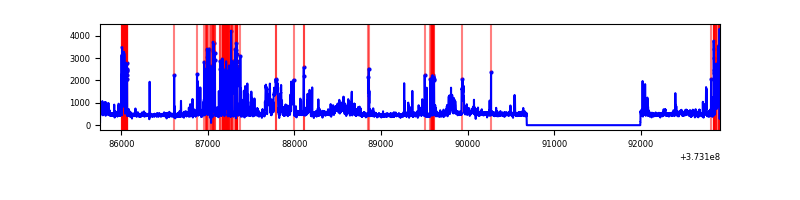 |
| C | 7159 | 5847 | 106 | 106 | 1.48% | 1.81% | 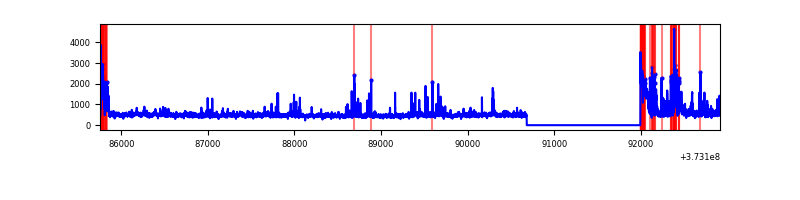 |
| D | 7159 | 5847 | 1407 | 1407 | 19.65% | 24.06% | 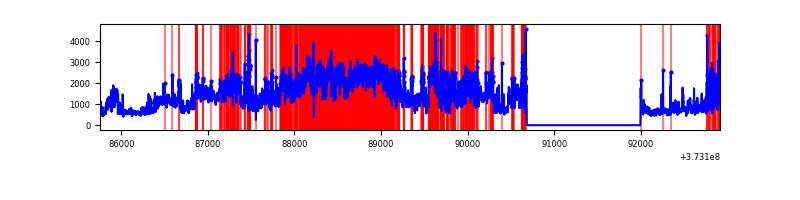 |
Top three noisy pixels from each quadrant. If the there are fewer than three noisy pixels in the level2.evt file, extra rows are filled as -1
| Pixel properties | Quadrant properties | ||||||
|---|---|---|---|---|---|---|---|
| Quadrant | DetID | PixID | Counts | Sigma | Mean | Median | Sigma |
| A | 14 | 63 | 208235 | 1533.73 | 672 | 659 | 135.3 |
| A | 13 | 6 | 17866 | 127.14 | 672 | 659 | 135.3 |
| A | 7 | 16 | 16515 | 117.16 | 672 | 659 | 135.3 |
| B | 5 | 200 | 459055 | 3647.66 | 665 | 648 | 125.7 |
| B | 5 | 172 | 458051 | 3639.67 | 665 | 648 | 125.7 |
| B | 0 | 219 | 187686 | 1488.31 | 665 | 648 | 125.7 |
| C | 0 | 10 | 340026 | 2246.85 | 652 | 657 | 151.0 |
| C | 4 | 254 | 177505 | 1170.85 | 652 | 657 | 151.0 |
| C | 14 | 67 | 160391 | 1057.55 | 652 | 657 | 151.0 |
| D | 8 | 195 | 2847766 | 17889.35 | 614 | 603 | 159.2 |
| D | 12 | 227 | 2105405 | 13224.93 | 614 | 603 | 159.2 |
| D | 10 | 203 | 352487 | 2210.96 | 614 | 603 | 159.2 |
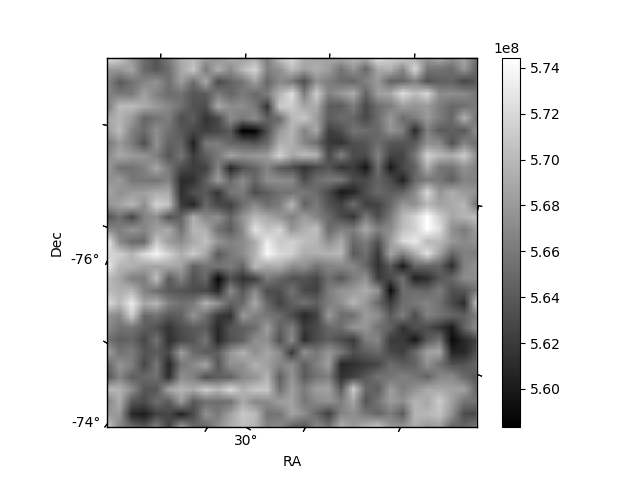
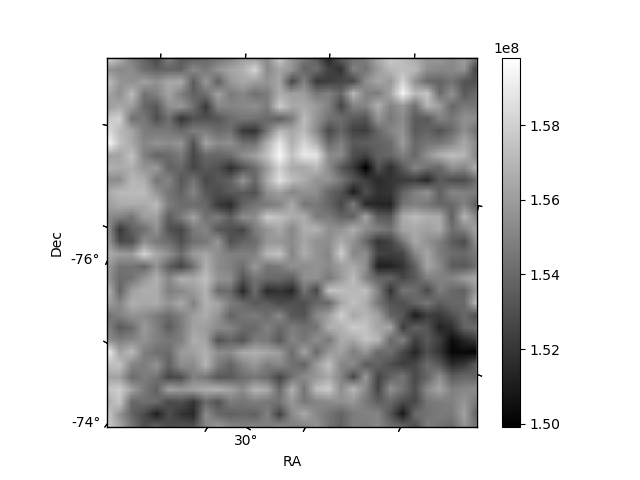
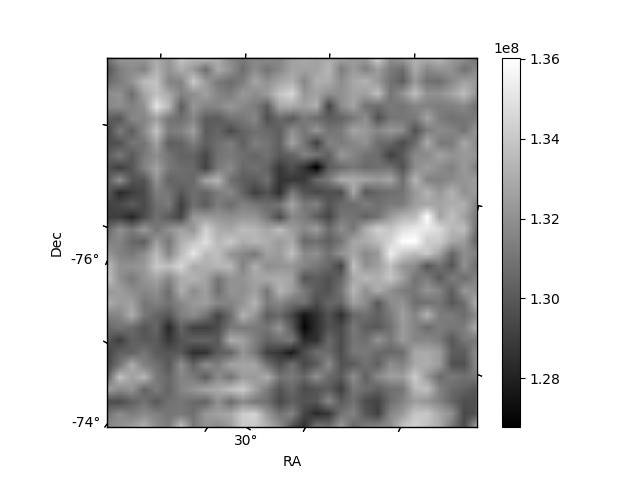
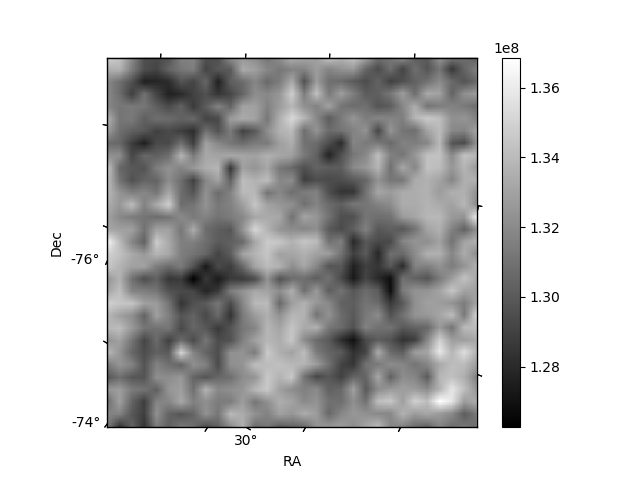
Histogram calculated using DETX and DETY for each event in the final _common_clean file
| Quadrant A | 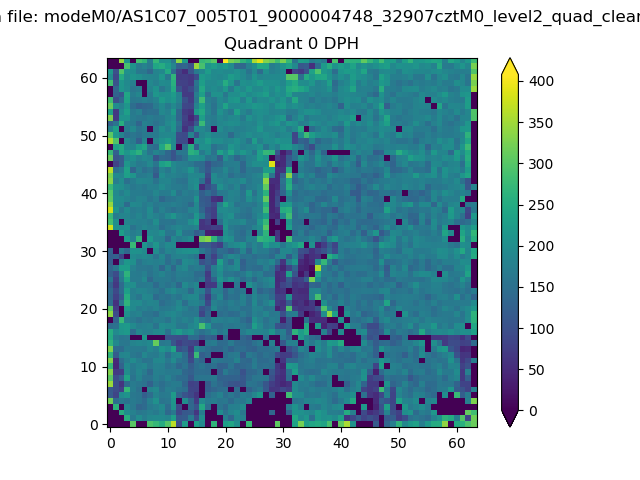 |
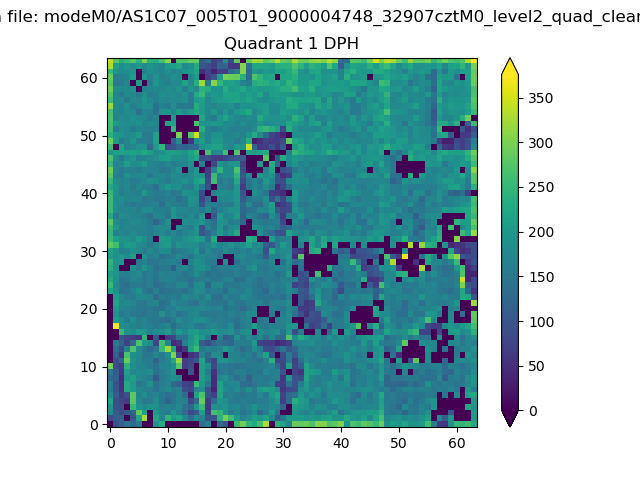 |
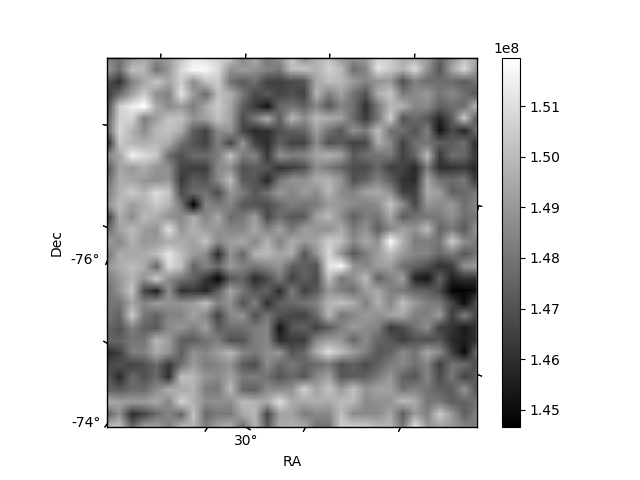
Quadrant B |
|---|---|---|---|
| Quadrant D |  |
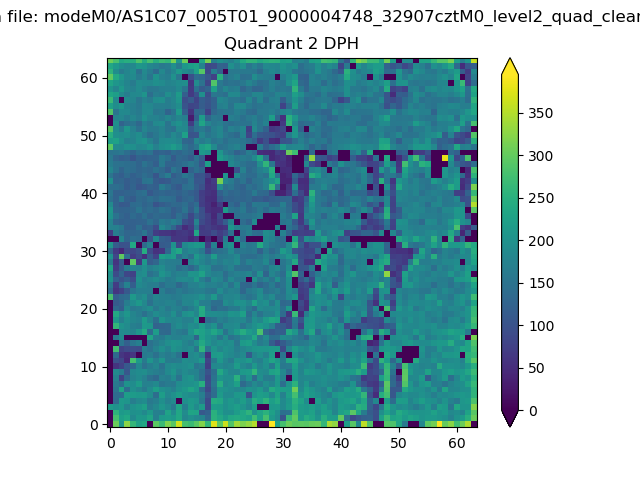 |
Quadrant C |
| Plot type | Count rate plots | Images |
|---|---|---|
| Comparison with Poisson distribution Blue bars denote a histogram of data divided into 1 sec bins. Red curve is a Poisson curve with rate = median count rate of data. |
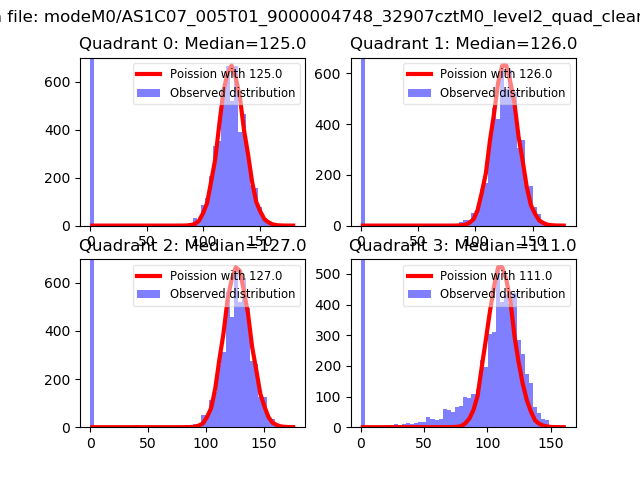 |
 |
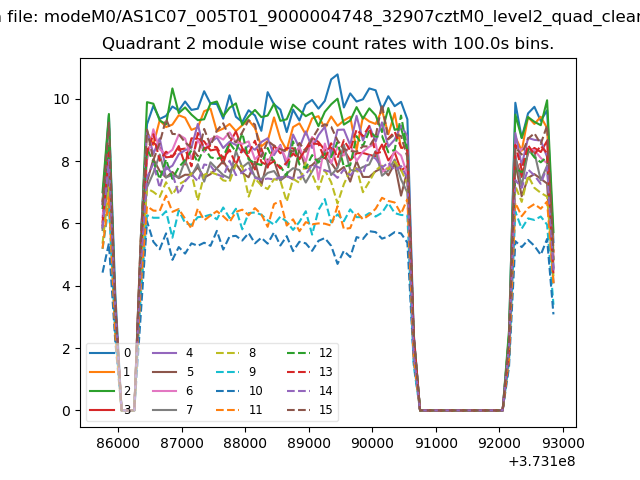
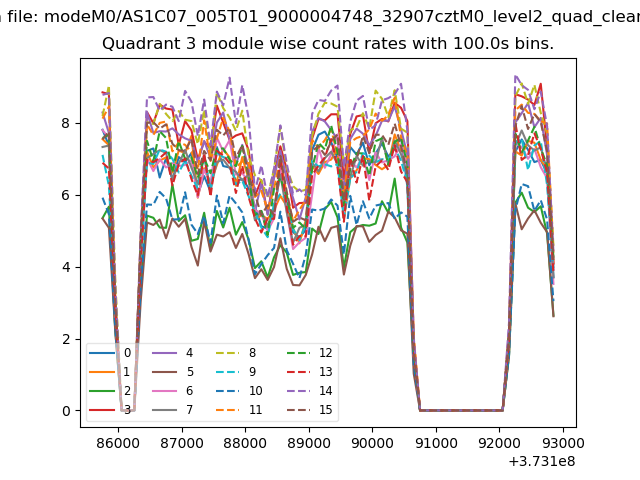
| Quadrant-wise count rates Data is divided into 100 sec bins |
 |
|
| Module-wise count rates for Quadrant A Data is divided into 100 sec bins |
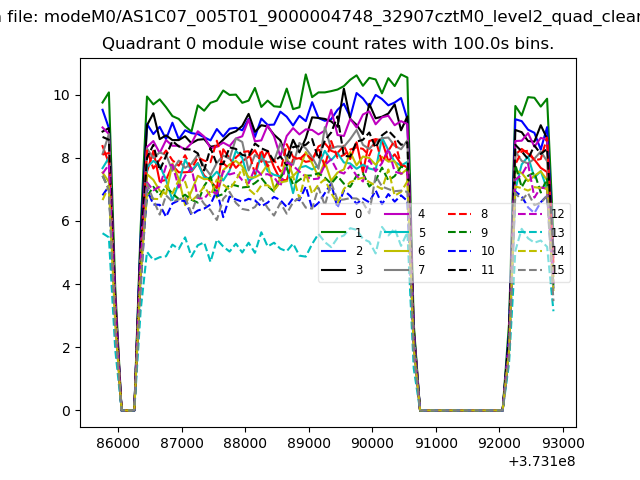 |
 |
| Module-wise count rates for Quadrant B Data is divided into 100 sec bins |
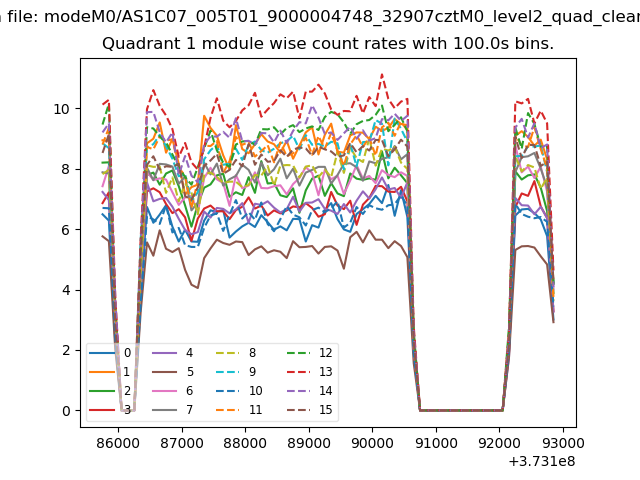 |
 |
| Module-wise count rates for Quadrant C Data is divided into 100 sec bins |
 |
 |
| Module-wise count rates for Quadrant D Data is divided into 100 sec bins |
 |
 |
| Parameter | Plot |
|---|---|
| CZT HV Monitor | 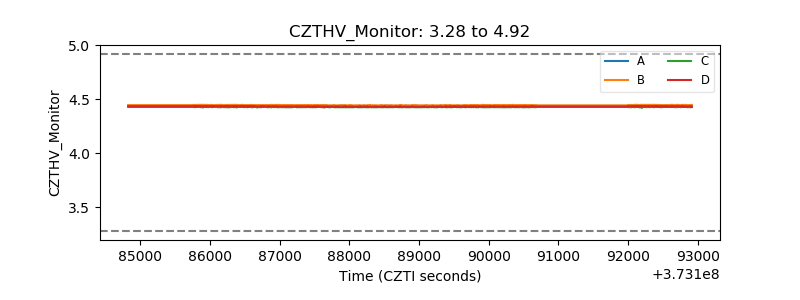 |
| D_VDD | 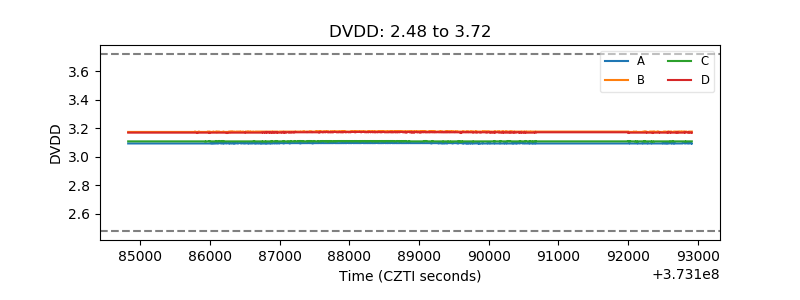 |
| Temperature 1 | 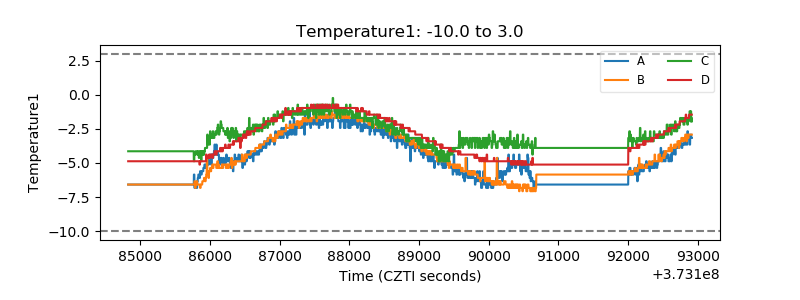 |
| Veto HV Monitor | 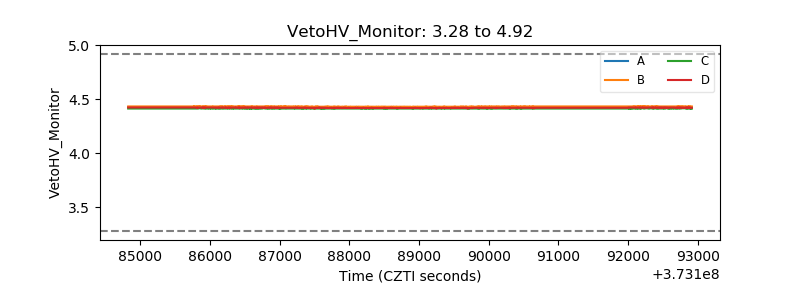 |
| Veto LLD | 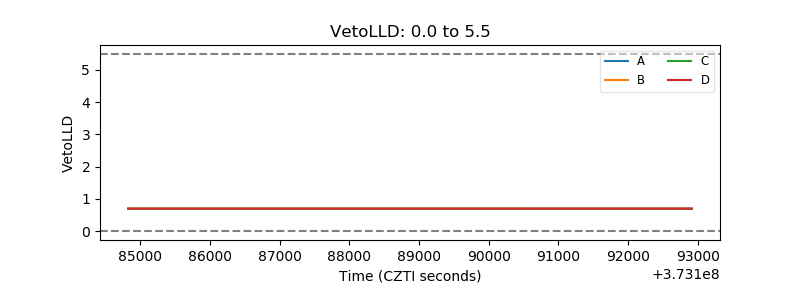 |
| Alpha Counter | 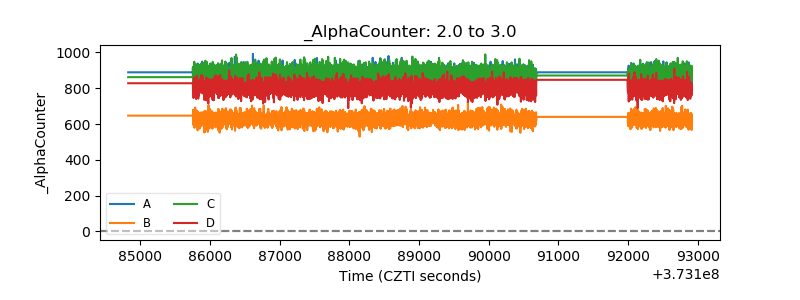 |
| _CPM_Rate | 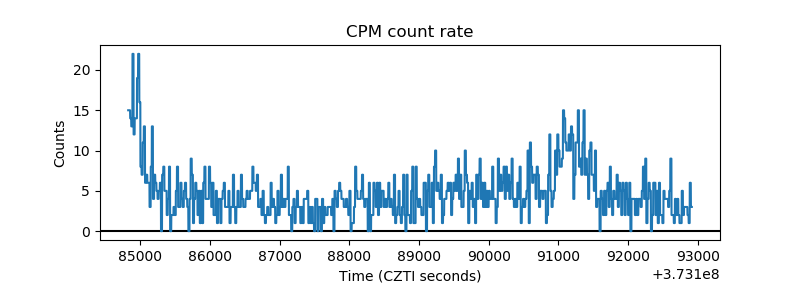 |
| CZT Counter | 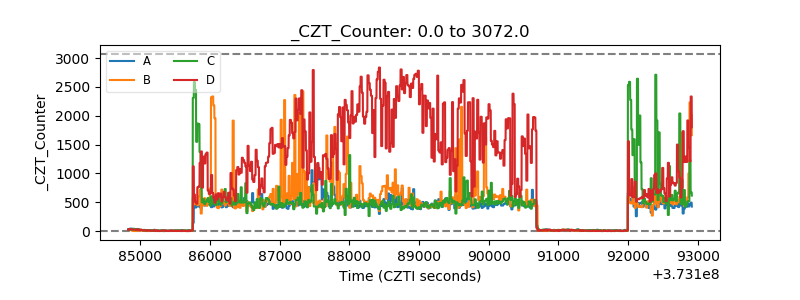 |
| +2.5 Volts monitor |  |
| +5 Volts monitor |  |
| _ROLL_ROT | 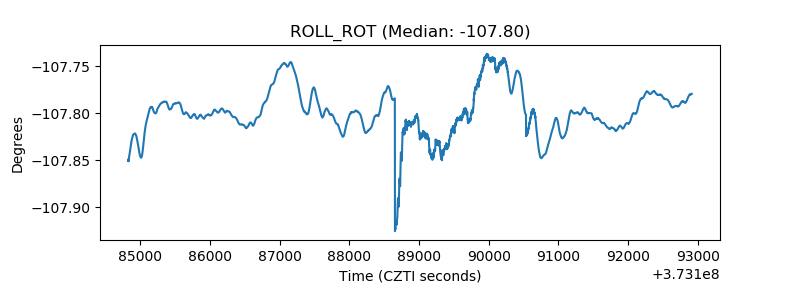 |
| _Roll_DEC | 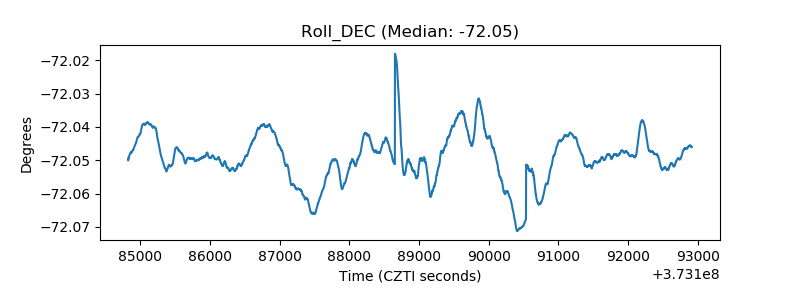 |
| _Roll_RA | 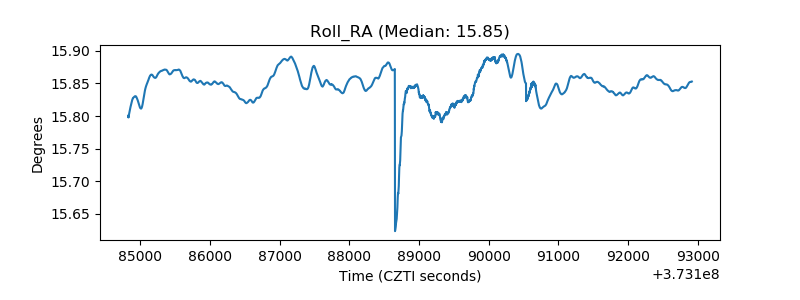 |
| Veto Counter | 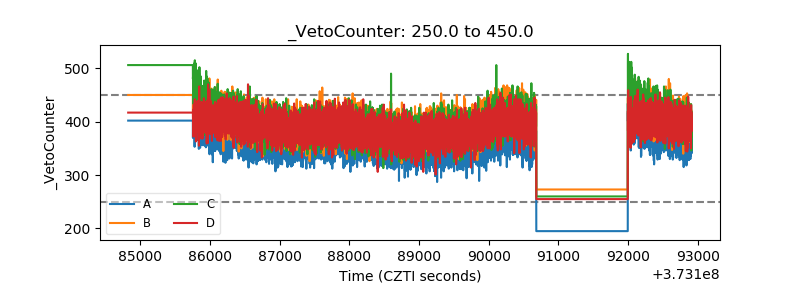 |