| Param | Original file | Final file |
|---|---|---|
| Filename | modeM0/AS1C07_005T01_9000004748_32910cztM0_level2.evt | modeM0/AS1C07_005T01_9000004748_32910cztM0_level2_quad_clean.evt |
| Size (bytes) | 701,242,560 | 109,837,440 |
| Size | 668.8 MB | 104.7 MB |
| Events in quadrant A | 2,897,148 | 751,421 |
| Events in quadrant B | 5,069,000 | 721,432 |
| Events in quadrant C | 3,595,362 | 762,012 |
| Events in quadrant D | 9,250,910 | 651,838 |
| Mode SS | |||
|---|---|---|---|
| Quadrant | BADHDUFLAG | Total packets | Discarded packets |
| A | 0 | 128 | 0 |
| B | 0 | 128 | 0 |
| C | 0 | 128 | 0 |
| D | 0 | 128 | 0 |
| Mode M9 | |||
|---|---|---|---|
| Quadrant | BADHDUFLAG | Total packets | Discarded packets |
| A | 0 | 17 | 0 |
| B | 0 | 17 | 0 |
| C | 0 | 17 | 0 |
| D | 0 | 18 | 0 |
| Mode M0 | |||
|---|---|---|---|
| Quadrant | BADHDUFLAG | Total packets | Discarded packets |
| A | 0 | 12663 | 3 |
| B | 0 | 19161 | 2 |
| C | 0 | 14644 | 2 |
| D | 0 | 31945 | 2 |
| Quadrant | Total seconds | Saturated seconds | Saturation percentage |
|---|---|---|---|
| A | 6291 | 10 | 0.158957% |
| B | 6291 | 643 | 10.220951% |
| C | 6291 | 117 | 1.859800% |
| D | 6291 | 1214 | 19.297409% |
Noise dominated data is calculated using 1-second bins in cleaned event files. If a bin has >2000 counts, and if more than 50% of those come from <1% of pixels, then it is considered to be noise-dominated and hence unusable.
| Quadrant | # 1 sec bins | Bins with >0 counts | Bins with >2000 counts | High rate bins dominated by noise | Noise dominated (total time) | Noise dominated (detector-on time) | Marked lightcurve |
|---|---|---|---|---|---|---|---|
| A | 7573 | 6292 | 0 | 0 | 0.00% | 0.00% | 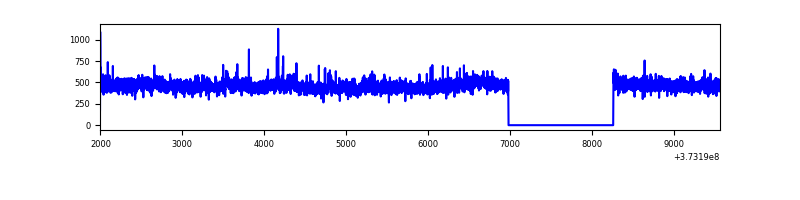 |
| B | 7573 | 6292 | 439 | 439 | 5.80% | 6.98% | 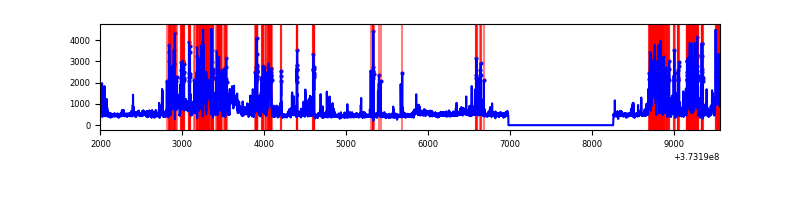 |
| C | 7573 | 6292 | 81 | 81 | 1.07% | 1.29% | 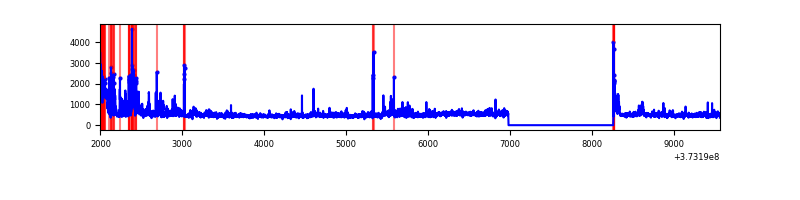 |
| D | 7573 | 6292 | 1210 | 1210 | 15.98% | 19.23% | 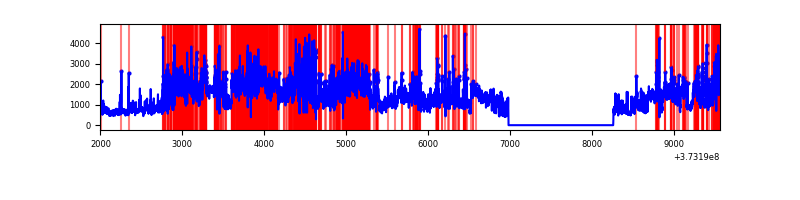 |
Top three noisy pixels from each quadrant. If the there are fewer than three noisy pixels in the level2.evt file, extra rows are filled as -1
| Pixel properties | Quadrant properties | ||||||
|---|---|---|---|---|---|---|---|
| Quadrant | DetID | PixID | Counts | Sigma | Mean | Median | Sigma |
| A | 14 | 63 | 55637 | 375.56 | 724 | 708 | 146.3 |
| A | 13 | 6 | 20644 | 136.31 | 724 | 708 | 146.3 |
| A | 15 | 169 | 14862 | 96.77 | 724 | 708 | 146.3 |
| B | 5 | 172 | 1429368 | 10928.44 | 695 | 678 | 130.7 |
| B | 5 | 200 | 560693 | 4283.71 | 695 | 678 | 130.7 |
| B | 0 | 219 | 87859 | 666.87 | 695 | 678 | 130.7 |
| C | 0 | 10 | 208686 | 1280.27 | 705 | 711 | 162.4 |
| C | 14 | 67 | 195727 | 1200.5 | 705 | 711 | 162.4 |
| C | 4 | 254 | 136909 | 838.42 | 705 | 711 | 162.4 |
| D | 8 | 195 | 4175094 | 24368.21 | 662 | 648 | 171.3 |
| D | 12 | 233 | 610094 | 3557.62 | 662 | 648 | 171.3 |
| D | 12 | 227 | 458301 | 2671.54 | 662 | 648 | 171.3 |
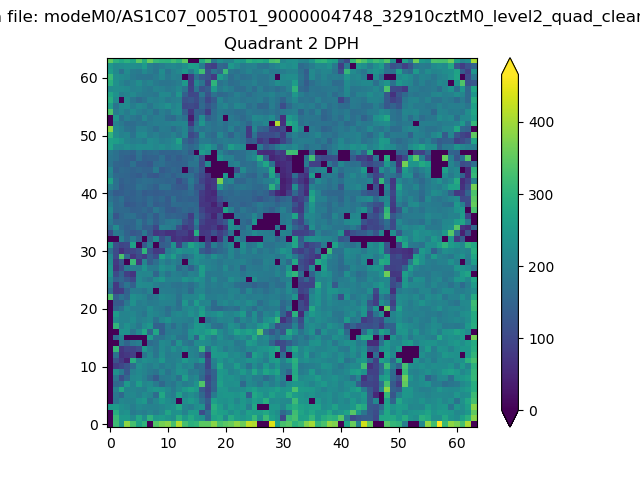
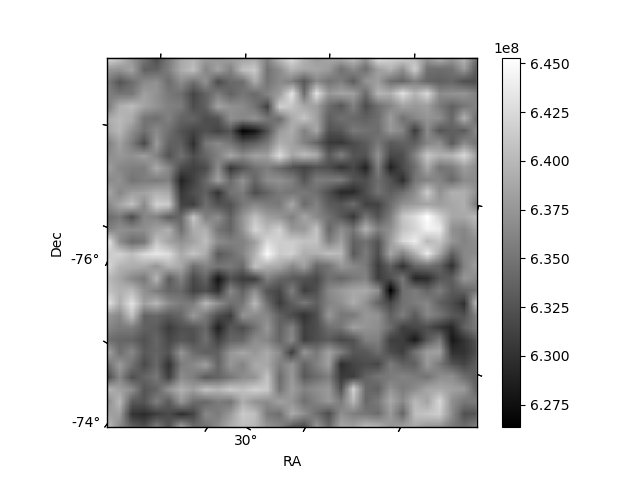
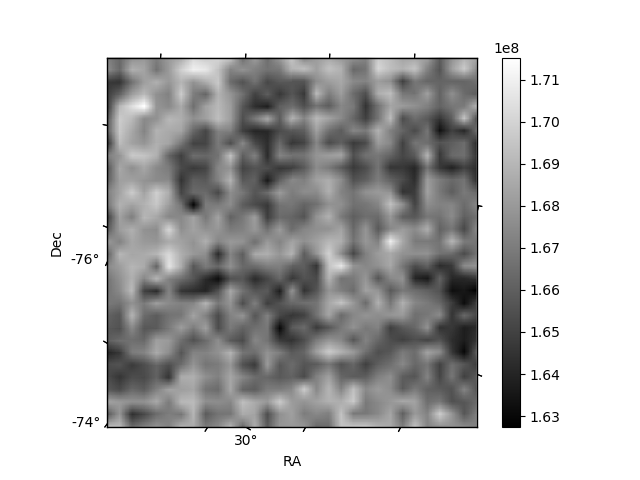
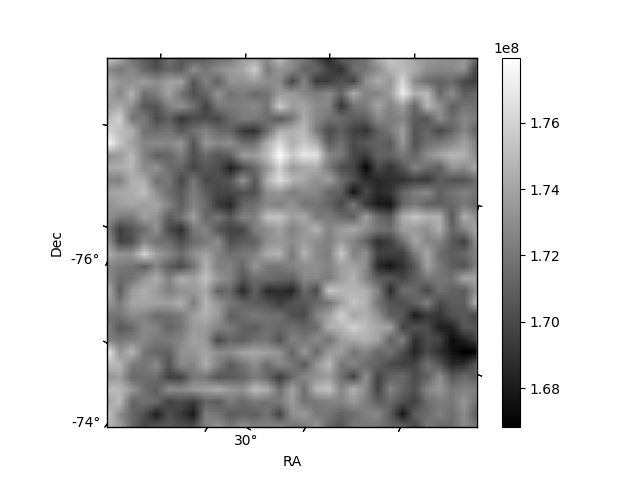
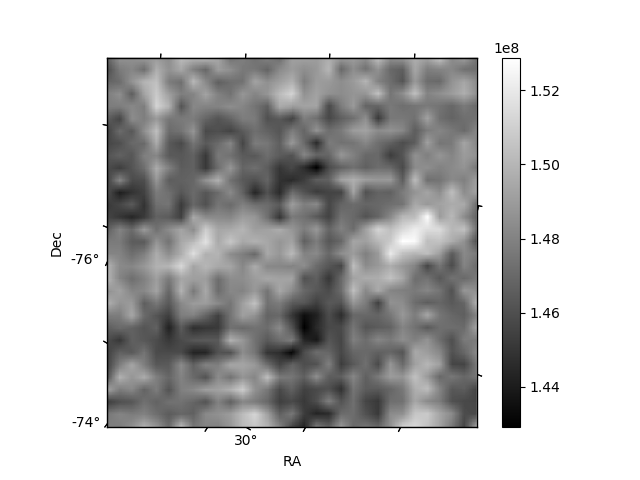
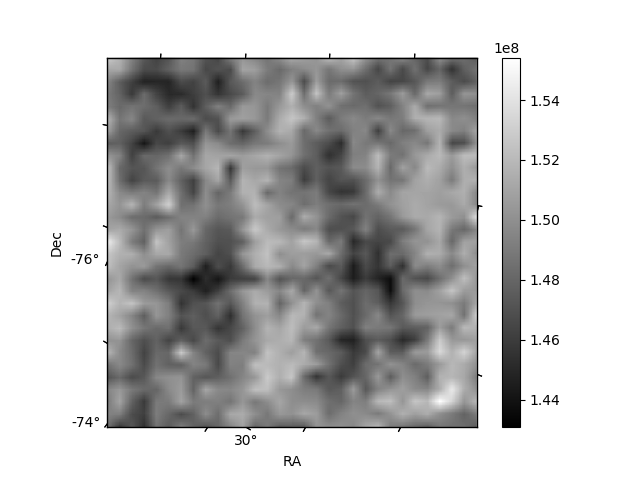
Histogram calculated using DETX and DETY for each event in the final _common_clean file
| Quadrant A | 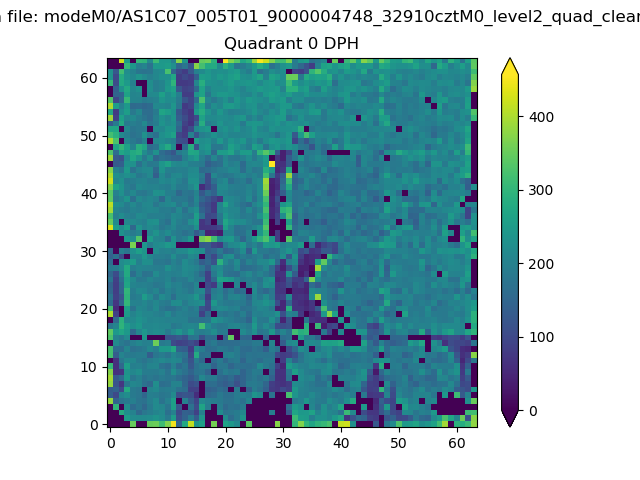 |
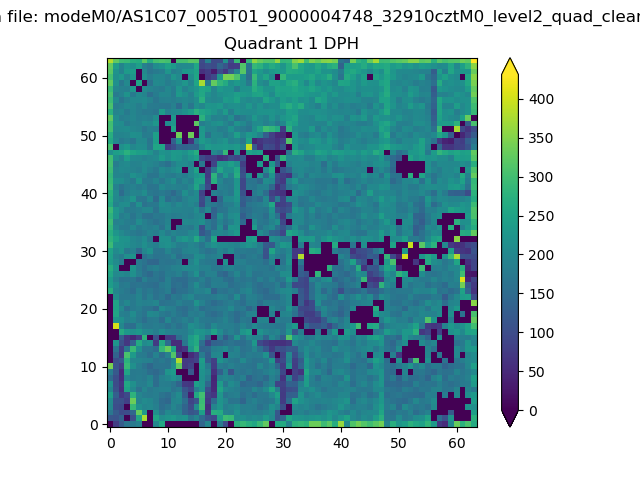 |
Quadrant B |
|---|---|---|---|
| Quadrant D | 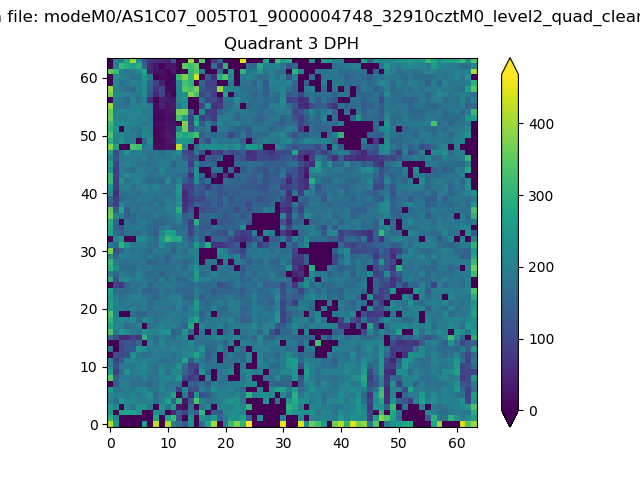 |
 |
Quadrant C |
| Plot type | Count rate plots | Images |
|---|---|---|
| Comparison with Poisson distribution Blue bars denote a histogram of data divided into 1 sec bins. Red curve is a Poisson curve with rate = median count rate of data. |
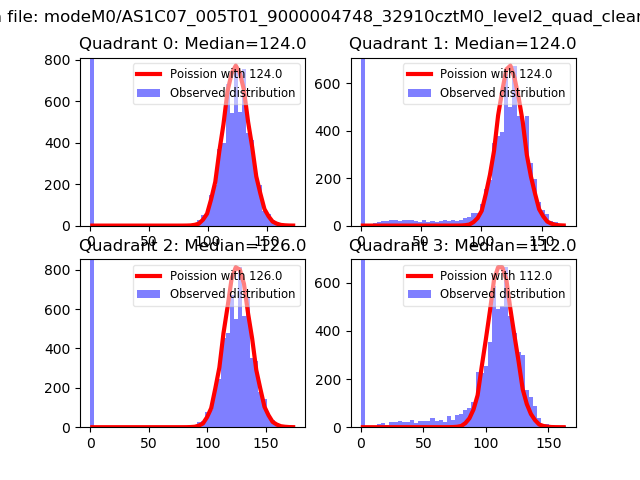 |
 |
| Quadrant-wise count rates Data is divided into 100 sec bins |
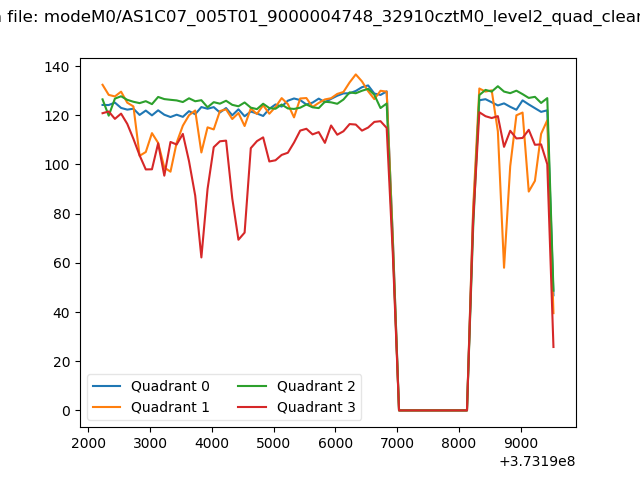 |
|
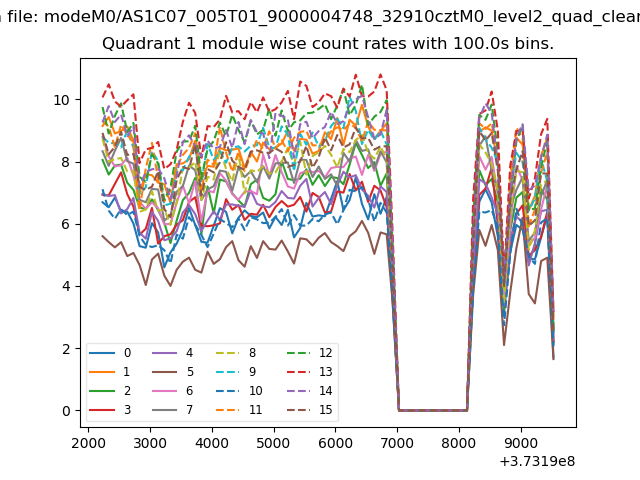
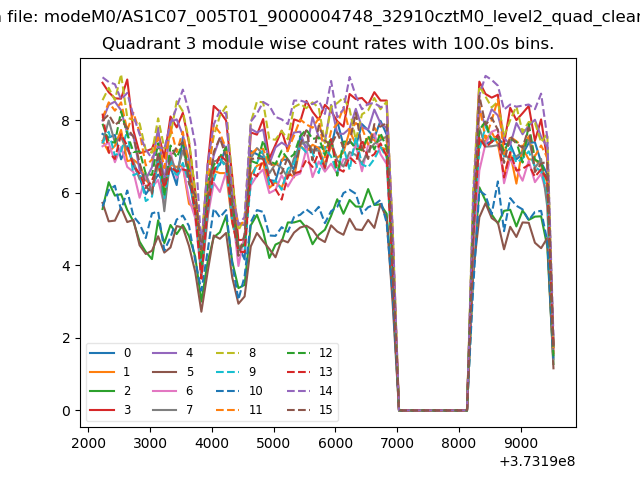
| Module-wise count rates for Quadrant A Data is divided into 100 sec bins |
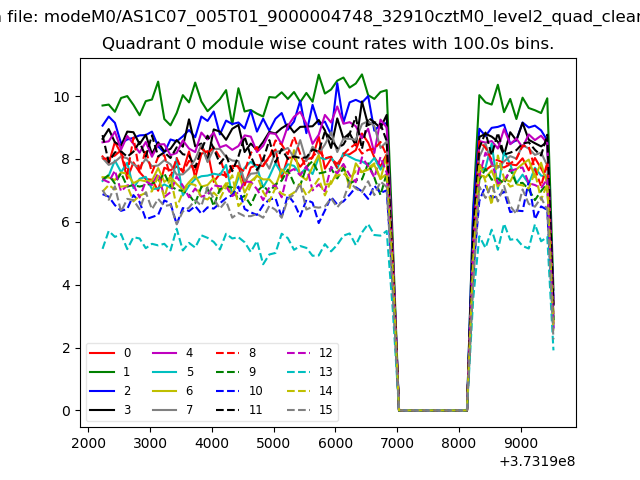 |
 |
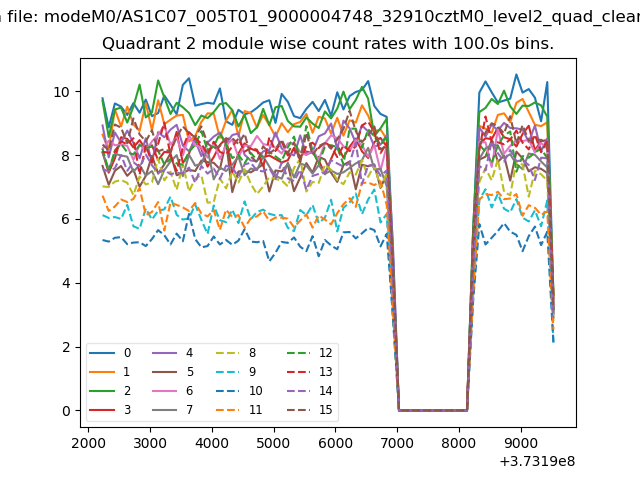
| Module-wise count rates for Quadrant B Data is divided into 100 sec bins |
 |
 |
| Module-wise count rates for Quadrant C Data is divided into 100 sec bins |
 |
 |
| Module-wise count rates for Quadrant D Data is divided into 100 sec bins |
 |
 |
| Parameter | Plot |
|---|---|
| CZT HV Monitor | 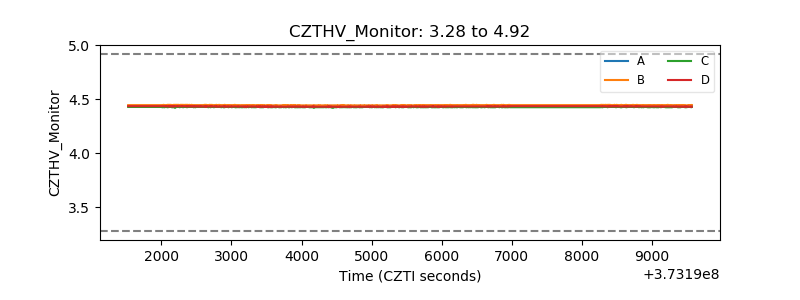 |
| D_VDD | 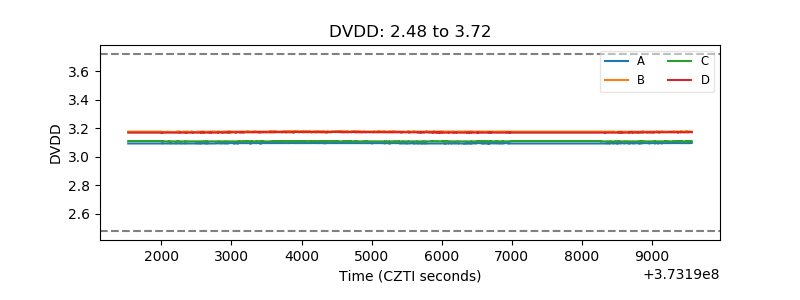 |
| Temperature 1 | 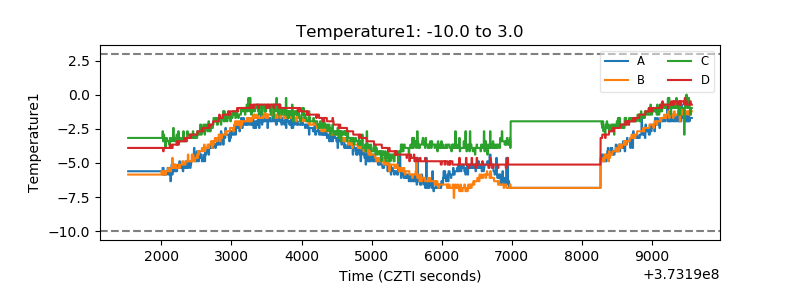 |
| Veto HV Monitor | 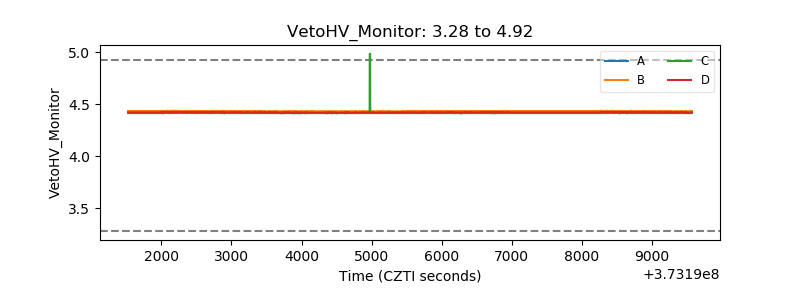 |
| Veto LLD | 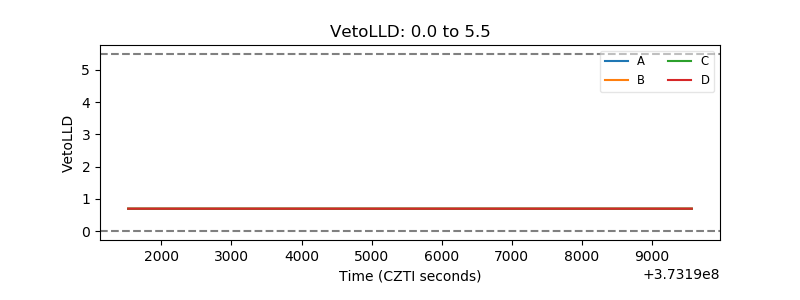 |
| Alpha Counter | 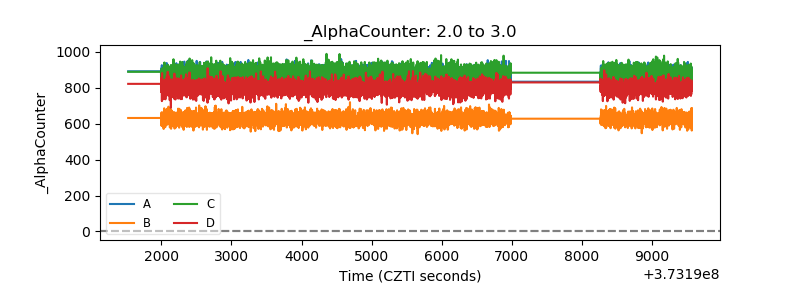 |
| _CPM_Rate | 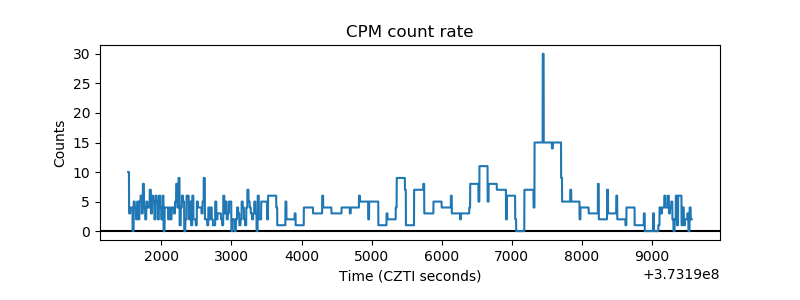 |
| CZT Counter | 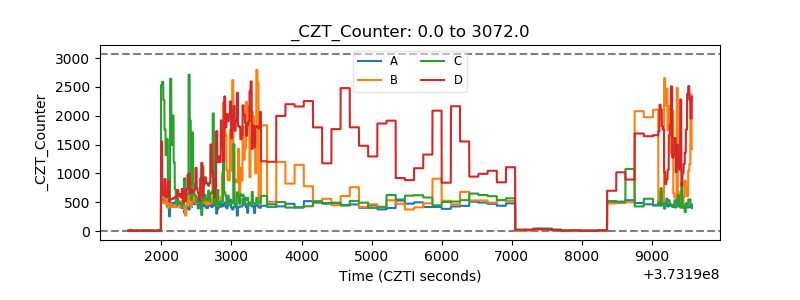 |
| +2.5 Volts monitor |  |
| +5 Volts monitor | 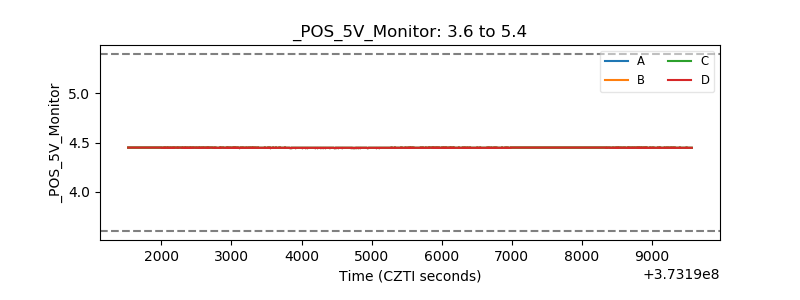 |
| _ROLL_ROT | 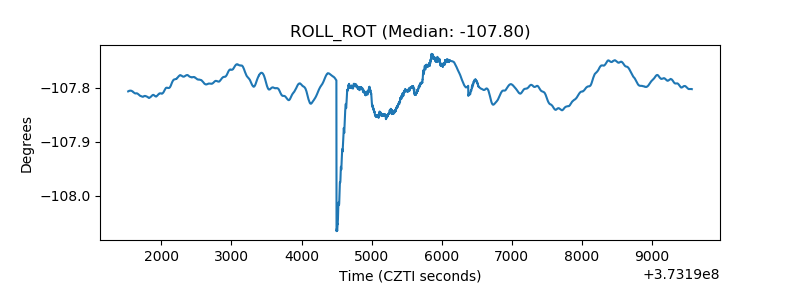 |
| _Roll_DEC | 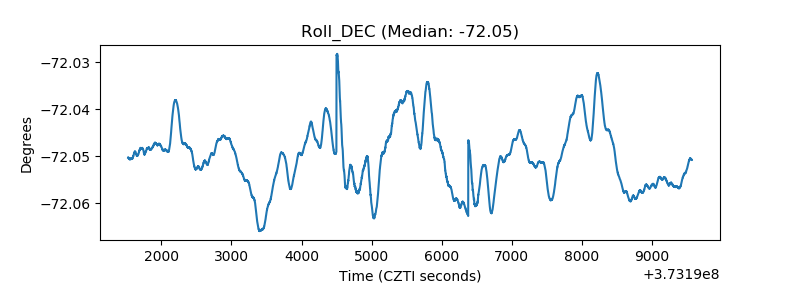 |
| _Roll_RA | 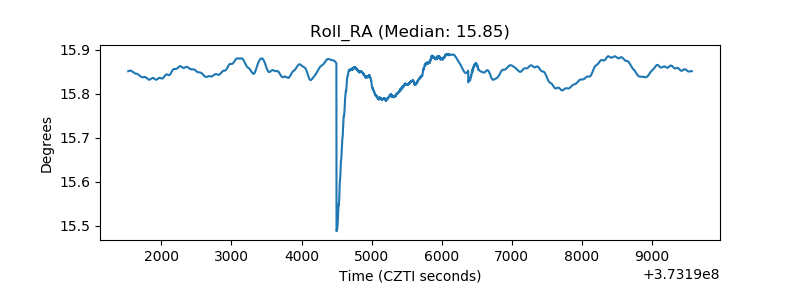 |
| Veto Counter | 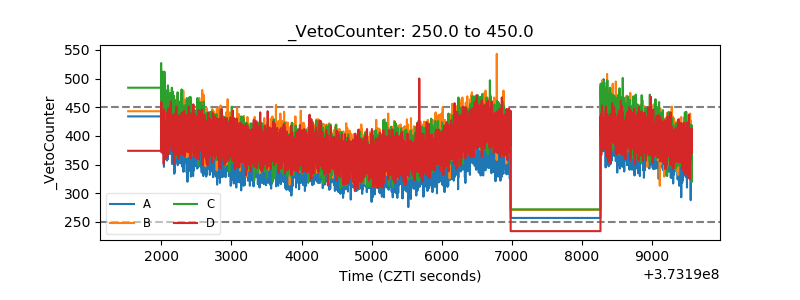 |