| Param | Original file | Final file |
|---|---|---|
| Filename | modeM0/AS1C07_005T01_9000004748_32911cztM0_level2.evt | modeM0/AS1C07_005T01_9000004748_32911cztM0_level2_quad_clean.evt |
| Size (bytes) | 1,979,170,560 | 360,123,840 |
| Size | 1.8 GB | 343.4 MB |
| Events in quadrant A | 9,244,018 | 2,461,952 |
| Events in quadrant B | 13,482,431 | 2,404,125 |
| Events in quadrant C | 10,146,197 | 2,465,986 |
| Events in quadrant D | 25,721,641 | 2,196,636 |
| Mode SS | |||
|---|---|---|---|
| Quadrant | BADHDUFLAG | Total packets | Discarded packets |
| A | 0 | 406 | 0 |
| B | 0 | 406 | 0 |
| C | 0 | 406 | 0 |
| D | 0 | 406 | 0 |
| Mode M9 | |||
|---|---|---|---|
| Quadrant | BADHDUFLAG | Total packets | Discarded packets |
| A | 0 | 58 | 0 |
| B | 0 | 58 | 0 |
| C | 0 | 58 | 0 |
| D | 0 | 58 | 0 |
| Mode M0 | |||
|---|---|---|---|
| Quadrant | BADHDUFLAG | Total packets | Discarded packets |
| A | 0 | 40921 | 5 |
| B | 0 | 53105 | 4 |
| C | 0 | 43392 | 4 |
| D | 0 | 90796 | 4 |
| Quadrant | Total seconds | Saturated seconds | Saturation percentage |
|---|---|---|---|
| A | 20024 | 58 | 0.289652% |
| B | 20024 | 1271 | 6.347383% |
| C | 20024 | 149 | 0.744107% |
| D | 20024 | 2262 | 11.296444% |
Noise dominated data is calculated using 1-second bins in cleaned event files. If a bin has >2000 counts, and if more than 50% of those come from <1% of pixels, then it is considered to be noise-dominated and hence unusable.
| Quadrant | # 1 sec bins | Bins with >0 counts | Bins with >2000 counts | High rate bins dominated by noise | Noise dominated (total time) | Noise dominated (detector-on time) | Marked lightcurve |
|---|---|---|---|---|---|---|---|
| A | 25726 | 20028 | 25 | 25 | 0.10% | 0.12% |  |
| B | 25726 | 20028 | 829 | 829 | 3.22% | 4.14% |  |
| C | 25726 | 20028 | 98 | 98 | 0.38% | 0.49% |  |
| D | 25726 | 20028 | 2418 | 2418 | 9.40% | 12.07% |  |
Top three noisy pixels from each quadrant. If the there are fewer than three noisy pixels in the level2.evt file, extra rows are filled as -1
| Pixel properties | Quadrant properties | ||||||
|---|---|---|---|---|---|---|---|
| Quadrant | DetID | PixID | Counts | Sigma | Mean | Median | Sigma |
| A | 15 | 169 | 164170 | 355.56 | 2291 | 2244 | 455.4 |
| A | 13 | 6 | 60784 | 128.54 | 2291 | 2244 | 455.4 |
| A | 14 | 63 | 59442 | 125.6 | 2291 | 2244 | 455.4 |
| B | 5 | 172 | 2883763 | 6821.27 | 2247 | 2194 | 422.4 |
| B | 5 | 200 | 850879 | 2009.01 | 2247 | 2194 | 422.4 |
| B | 0 | 219 | 224946 | 527.3 | 2247 | 2194 | 422.4 |
| C | 14 | 67 | 494011 | 965.88 | 2225 | 2245 | 509.1 |
| C | 0 | 10 | 328484 | 640.76 | 2225 | 2245 | 509.1 |
| C | 4 | 254 | 239476 | 465.94 | 2225 | 2245 | 509.1 |
| D | 8 | 195 | 10236260 | 18855.05 | 2134 | 2086 | 542.8 |
| D | 12 | 227 | 2233543 | 4111.15 | 2134 | 2086 | 542.8 |
| D | 2 | 250 | 1466880 | 2698.68 | 2134 | 2086 | 542.8 |
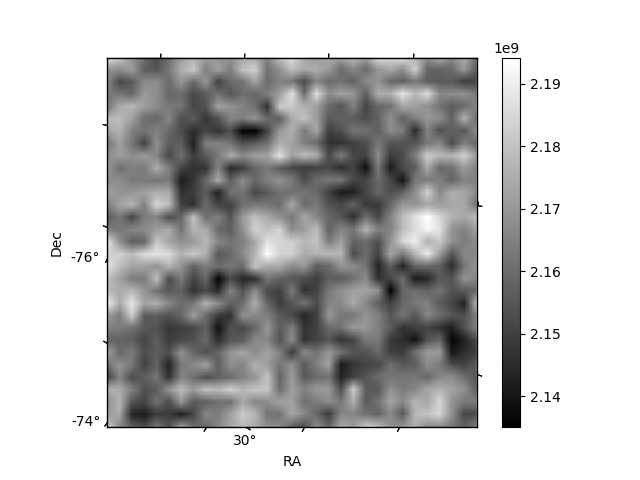
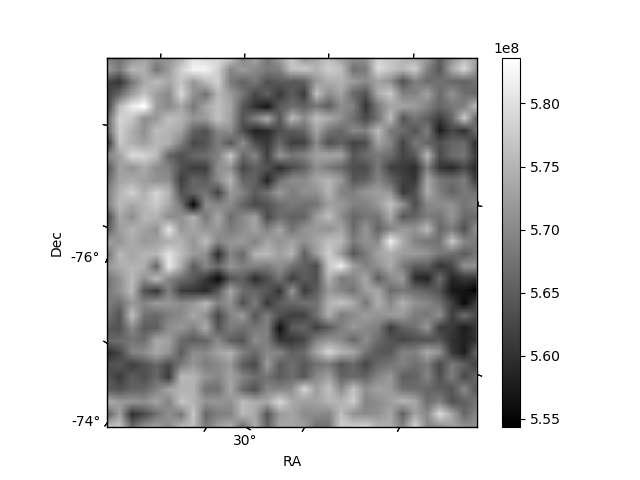
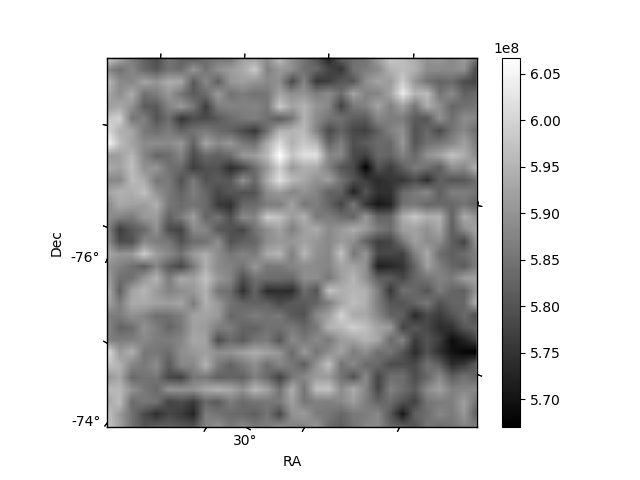
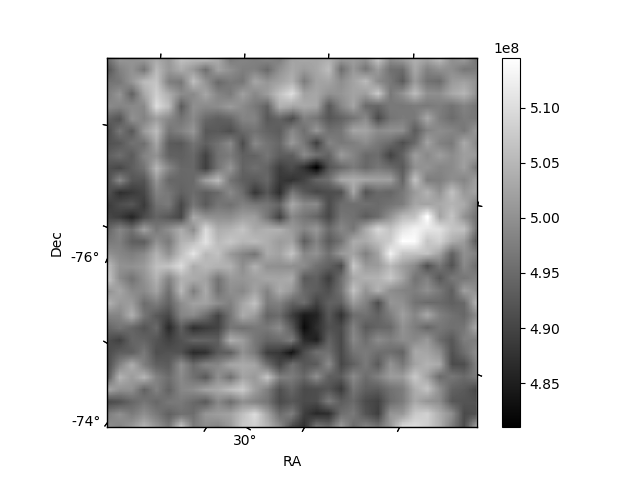
Histogram calculated using DETX and DETY for each event in the final _common_clean file
| Quadrant A | 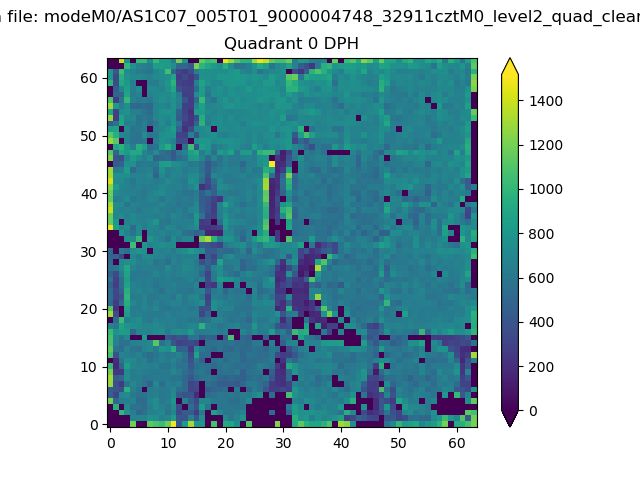 |
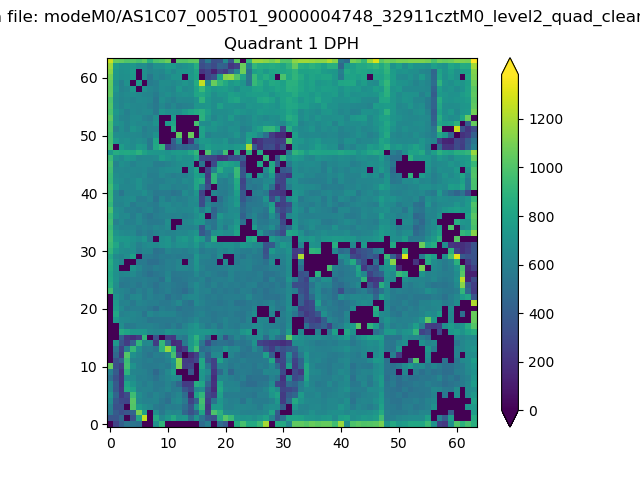 |
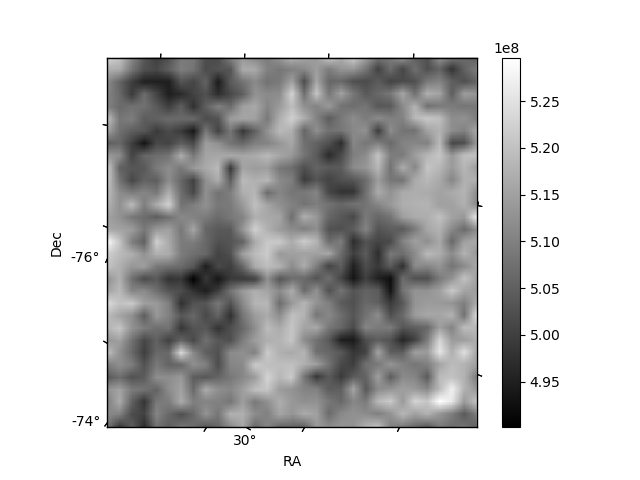
Quadrant B |
|---|---|---|---|
| Quadrant D | 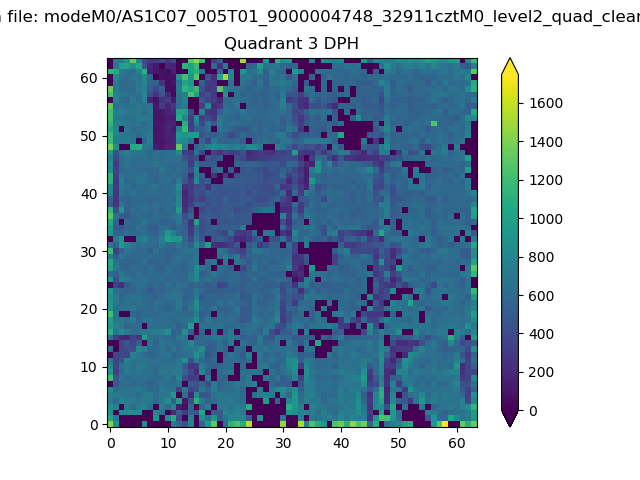 |
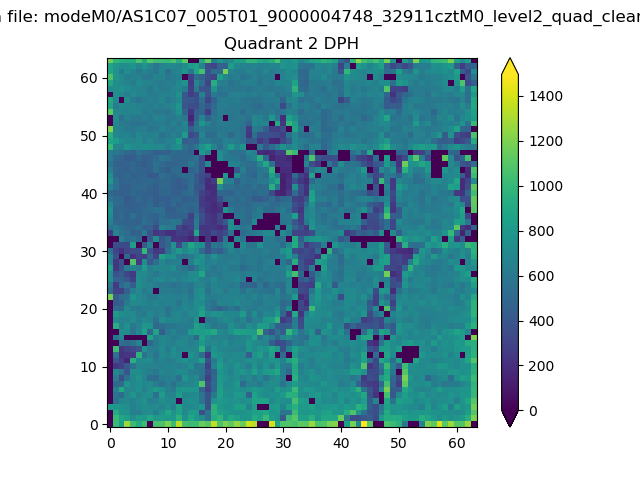 |
Quadrant C |
| Plot type | Count rate plots | Images |
|---|---|---|
| Comparison with Poisson distribution Blue bars denote a histogram of data divided into 1 sec bins. Red curve is a Poisson curve with rate = median count rate of data. |
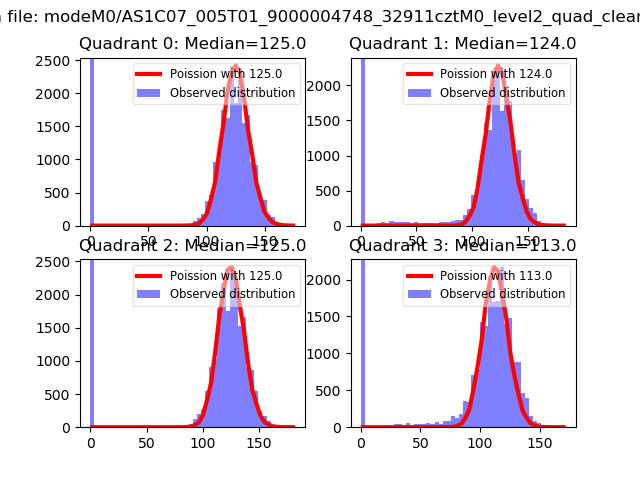 |
 |
| Quadrant-wise count rates Data is divided into 100 sec bins |
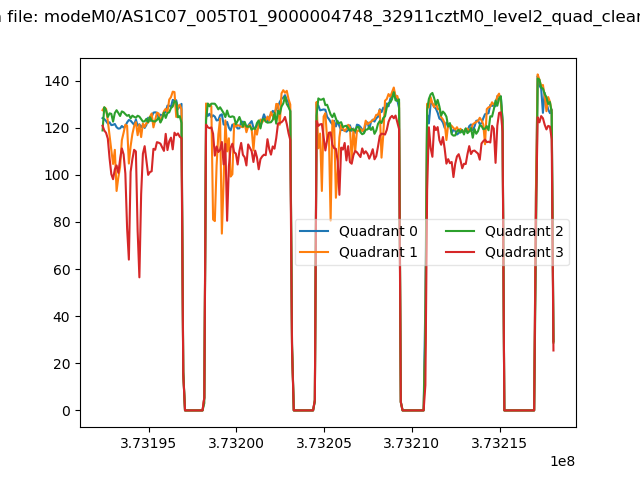 |
|
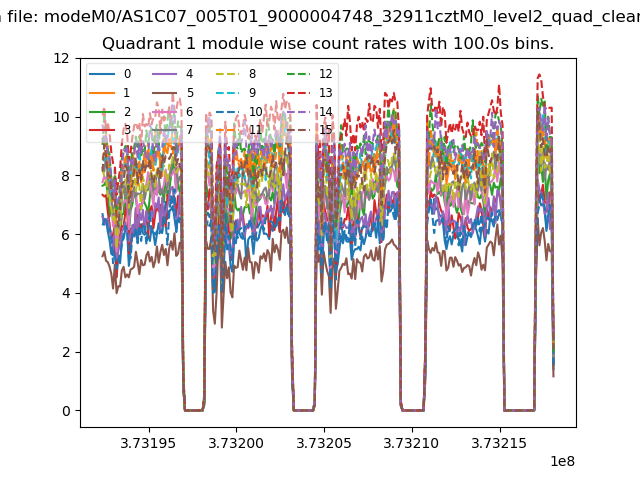
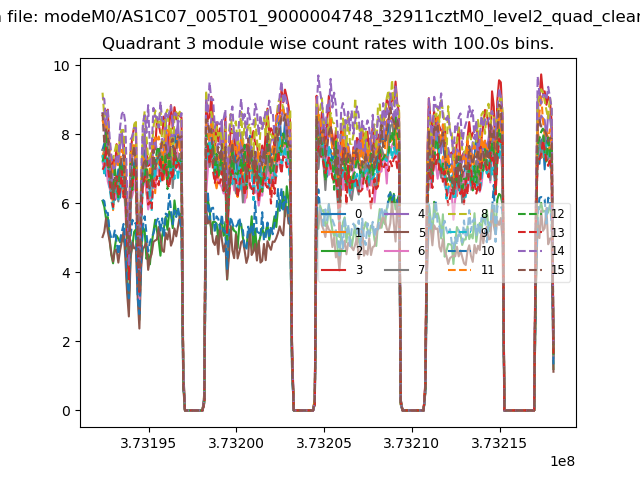
| Module-wise count rates for Quadrant A Data is divided into 100 sec bins |
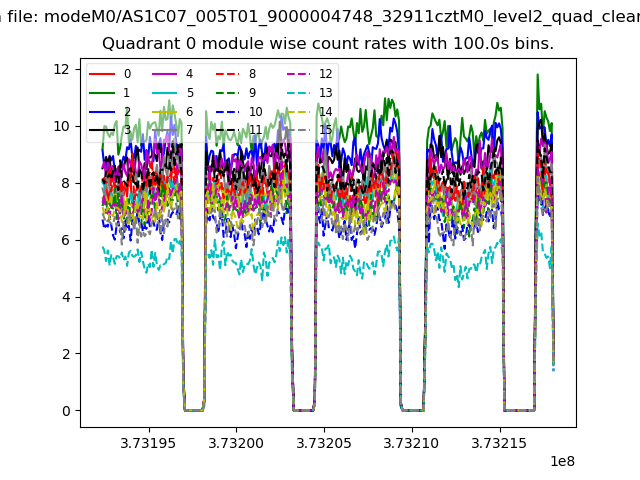 |
 |
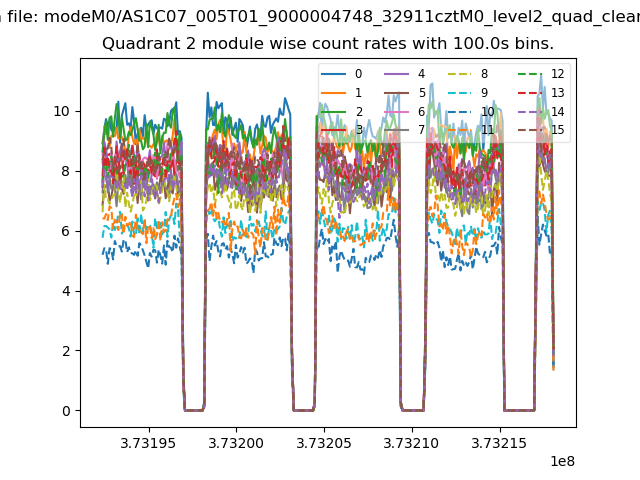
| Module-wise count rates for Quadrant B Data is divided into 100 sec bins |
 |
 |
| Module-wise count rates for Quadrant C Data is divided into 100 sec bins |
 |
 |
| Module-wise count rates for Quadrant D Data is divided into 100 sec bins |
 |
 |
| Parameter | Plot |
|---|---|
| CZT HV Monitor | 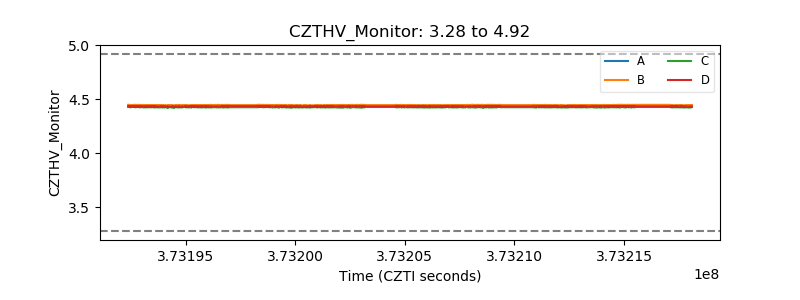 |
| D_VDD | 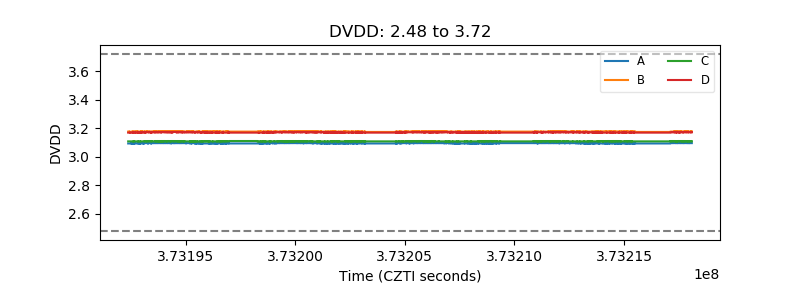 |
| Temperature 1 | 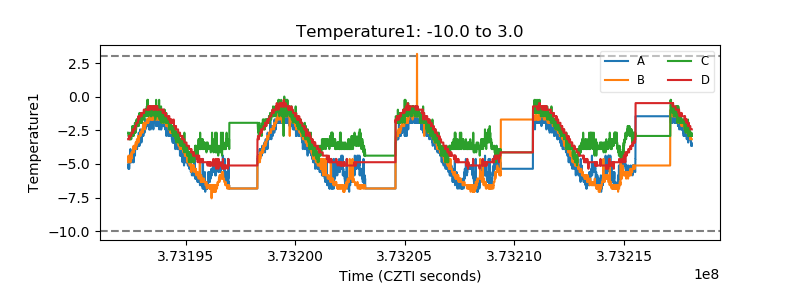 |
| Veto HV Monitor | 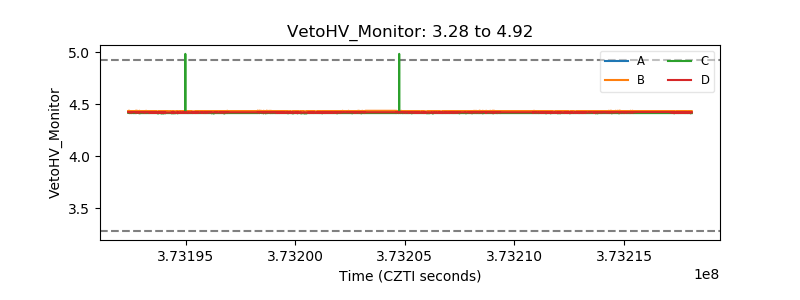 |
| Veto LLD |  |
| Alpha Counter | 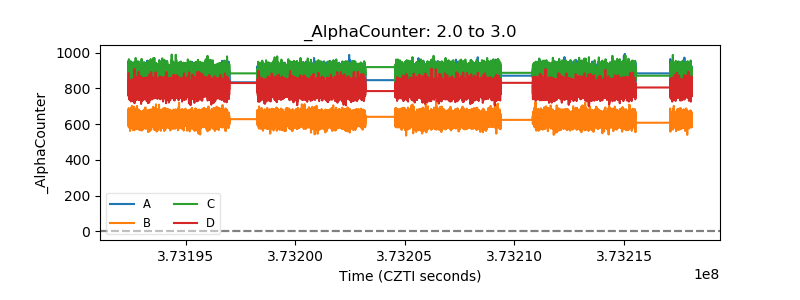 |
| _CPM_Rate | 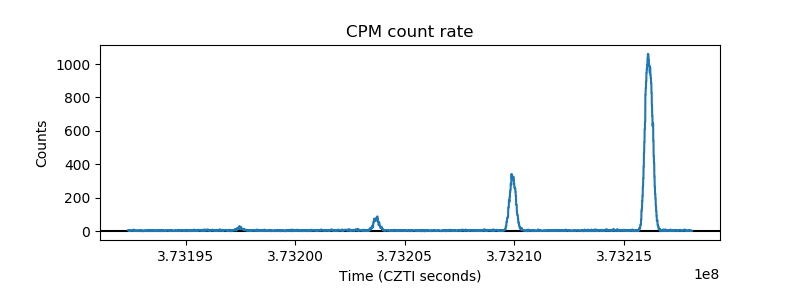 |
| CZT Counter | 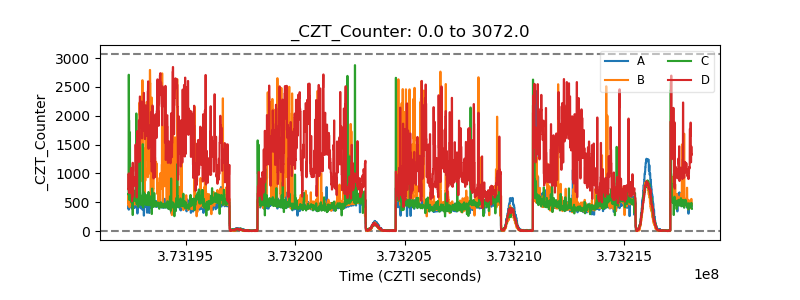 |
| +2.5 Volts monitor |  |
| +5 Volts monitor |  |
| _ROLL_ROT | 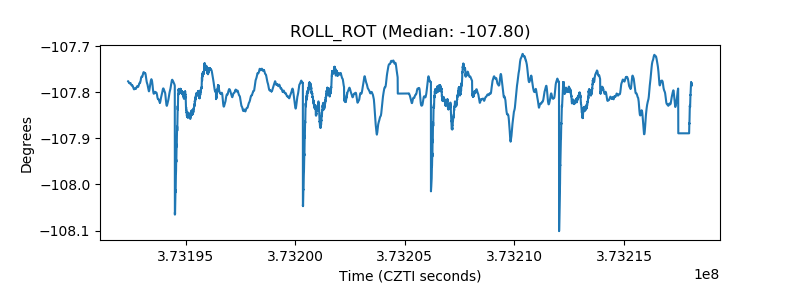 |
| _Roll_DEC |  |
| _Roll_RA | 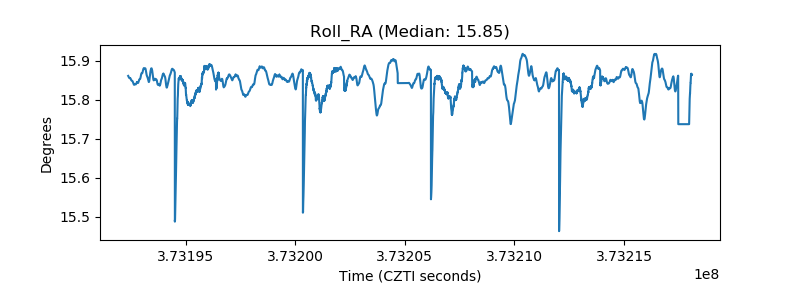 |
| Veto Counter | 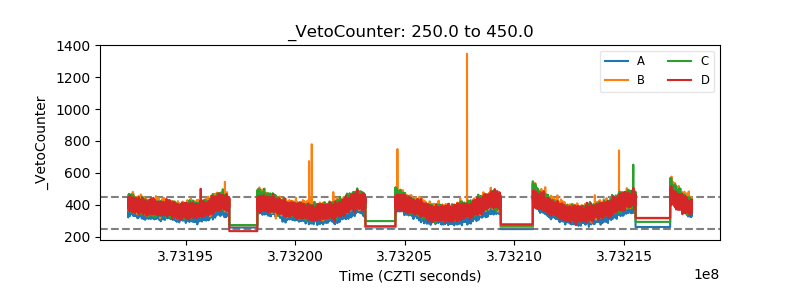 |