| Param | Original file | Final file |
|---|---|---|
| Filename | modeM0/AS1C07_005T01_9000004748_32912cztM0_level2.evt | modeM0/AS1C07_005T01_9000004748_32912cztM0_level2_quad_clean.evt |
| Size (bytes) | 531,936,000 | 100,690,560 |
| Size | 507.3 MB | 96.0 MB |
| Events in quadrant A | 2,613,324 | 685,761 |
| Events in quadrant B | 2,923,948 | 695,401 |
| Events in quadrant C | 3,045,018 | 670,953 |
| Events in quadrant D | 7,151,140 | 608,082 |
| Mode SS | |||
|---|---|---|---|
| Quadrant | BADHDUFLAG | Total packets | Discarded packets |
| A | 0 | 114 | 0 |
| B | 0 | 114 | 0 |
| C | 0 | 114 | 0 |
| D | 0 | 114 | 0 |
| Mode M9 | |||
|---|---|---|---|
| Quadrant | BADHDUFLAG | Total packets | Discarded packets |
| A | 0 | 23 | 0 |
| B | 0 | 23 | 0 |
| C | 0 | 23 | 0 |
| D | 0 | 24 | 0 |
| Mode M0 | |||
|---|---|---|---|
| Quadrant | BADHDUFLAG | Total packets | Discarded packets |
| A | 0 | 11537 | 3 |
| B | 0 | 12285 | 2 |
| C | 0 | 12724 | 2 |
| D | 0 | 25129 | 2 |
| Quadrant | Total seconds | Saturated seconds | Saturation percentage |
|---|---|---|---|
| A | 5558 | 20 | 0.359842% |
| B | 5558 | 61 | 1.097517% |
| C | 5558 | 101 | 1.817200% |
| D | 5558 | 574 | 10.327456% |
Noise dominated data is calculated using 1-second bins in cleaned event files. If a bin has >2000 counts, and if more than 50% of those come from <1% of pixels, then it is considered to be noise-dominated and hence unusable.
| Quadrant | # 1 sec bins | Bins with >0 counts | Bins with >2000 counts | High rate bins dominated by noise | Noise dominated (total time) | Noise dominated (detector-on time) | Marked lightcurve |
|---|---|---|---|---|---|---|---|
| A | 7261 | 5559 | 9 | 9 | 0.12% | 0.16% |  |
| B | 7261 | 5559 | 26 | 26 | 0.36% | 0.47% |  |
| C | 7261 | 5559 | 97 | 97 | 1.34% | 1.74% | 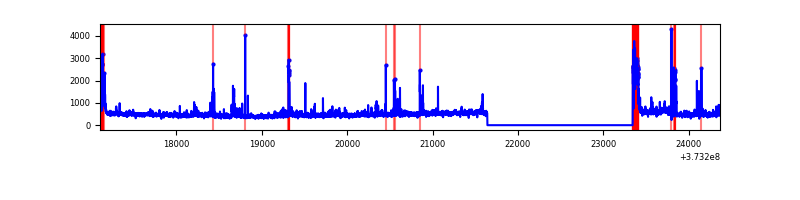 |
| D | 7261 | 5559 | 618 | 618 | 8.51% | 11.12% |  |
Top three noisy pixels from each quadrant. If the there are fewer than three noisy pixels in the level2.evt file, extra rows are filled as -1
| Pixel properties | Quadrant properties | ||||||
|---|---|---|---|---|---|---|---|
| Quadrant | DetID | PixID | Counts | Sigma | Mean | Median | Sigma |
| A | 9 | 143 | 46837 | 359.38 | 647 | 635 | 128.6 |
| A | 15 | 169 | 42061 | 322.23 | 647 | 635 | 128.6 |
| A | 13 | 6 | 17233 | 129.11 | 647 | 635 | 128.6 |
| B | 5 | 172 | 187504 | 1511.98 | 652 | 638 | 123.6 |
| B | 0 | 219 | 49046 | 391.68 | 652 | 638 | 123.6 |
| B | 0 | 230 | 33175 | 263.27 | 652 | 638 | 123.6 |
| C | 0 | 10 | 312085 | 2177.93 | 619 | 622 | 143.0 |
| C | 14 | 67 | 136586 | 950.74 | 619 | 622 | 143.0 |
| C | 1 | 241 | 112677 | 783.55 | 619 | 622 | 143.0 |
| D | 8 | 195 | 2441030 | 15784.18 | 596 | 583 | 154.6 |
| D | 10 | 203 | 724275 | 4680.65 | 596 | 583 | 154.6 |
| D | 12 | 227 | 645732 | 4172.66 | 596 | 583 | 154.6 |
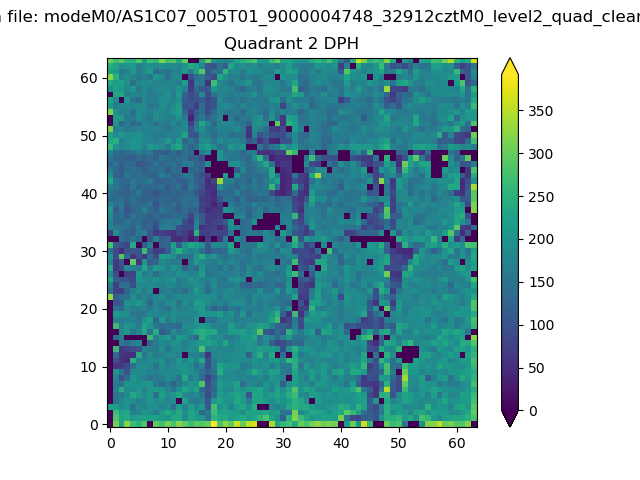
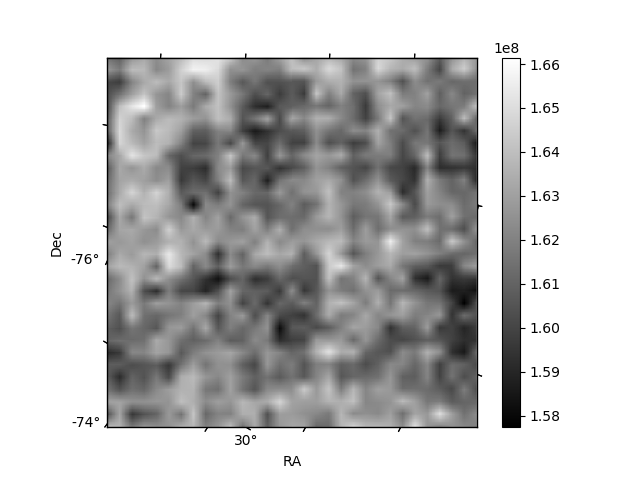
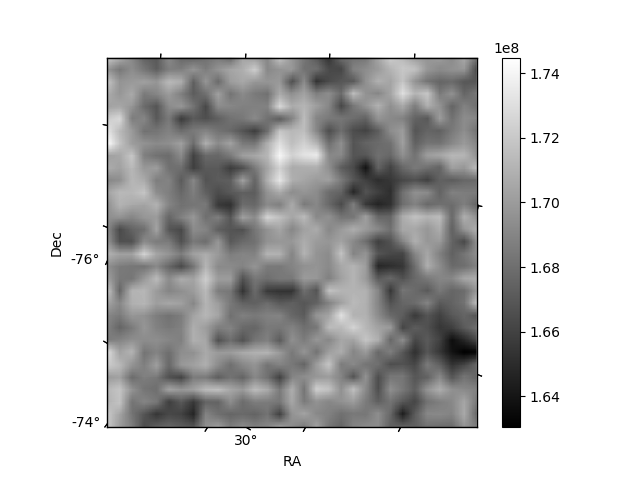
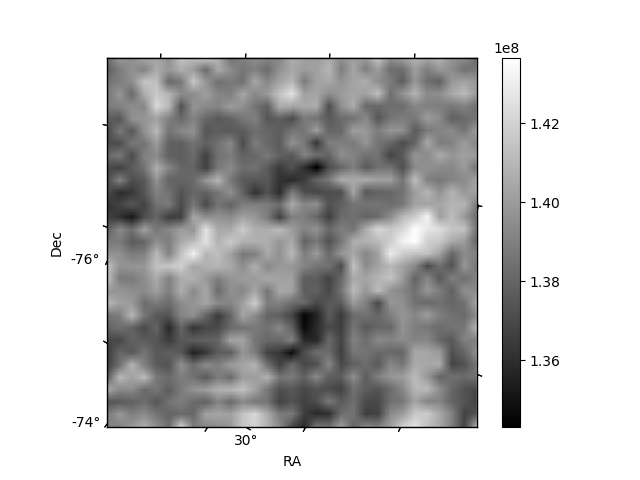
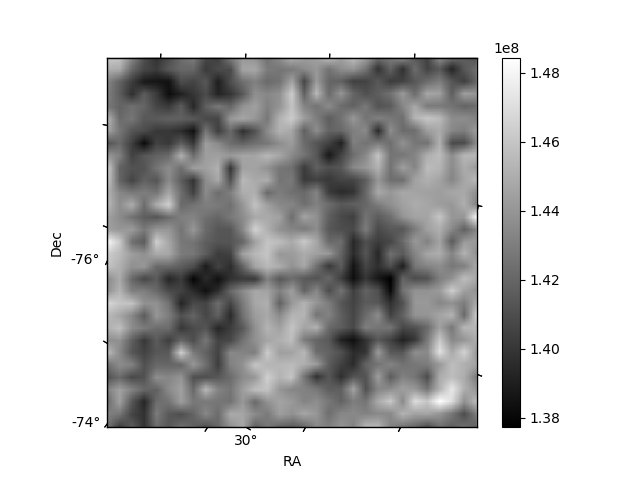
Histogram calculated using DETX and DETY for each event in the final _common_clean file
| Quadrant A |  |
 |
Quadrant B |
|---|---|---|---|
| Quadrant D |  |
 |
Quadrant C |
| Plot type | Count rate plots | Images |
|---|---|---|
| Comparison with Poisson distribution Blue bars denote a histogram of data divided into 1 sec bins. Red curve is a Poisson curve with rate = median count rate of data. |
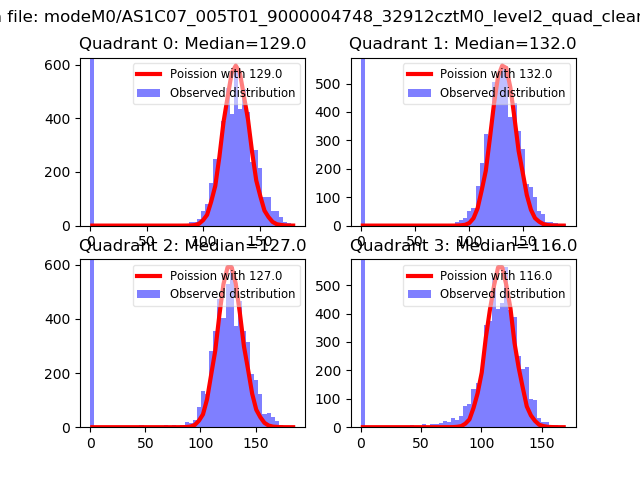 |
 |
| Quadrant-wise count rates Data is divided into 100 sec bins |
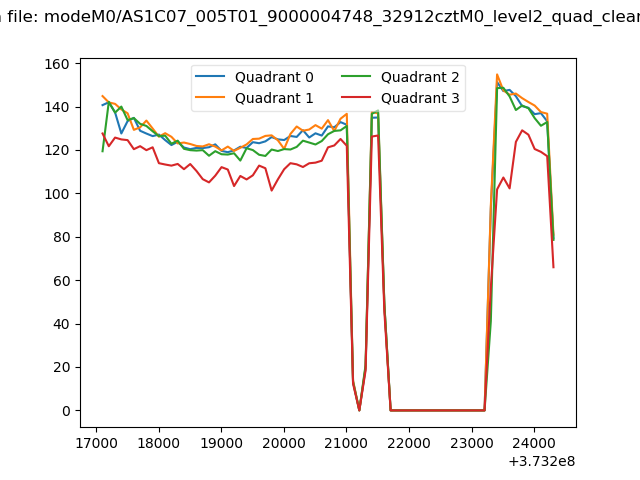 |
|
| Module-wise count rates for Quadrant A Data is divided into 100 sec bins |
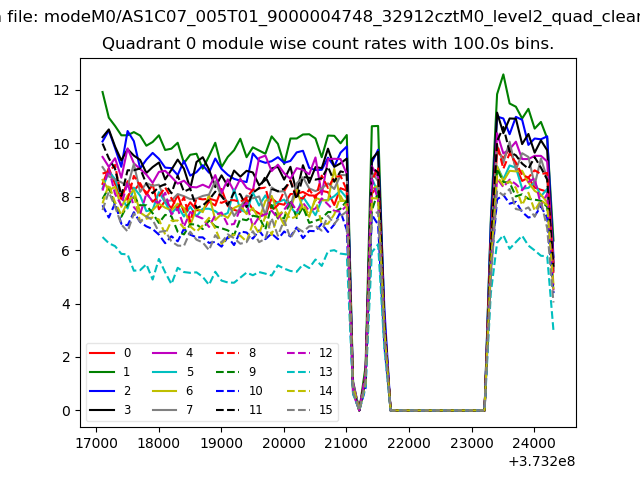 |
 |
| Module-wise count rates for Quadrant B Data is divided into 100 sec bins |
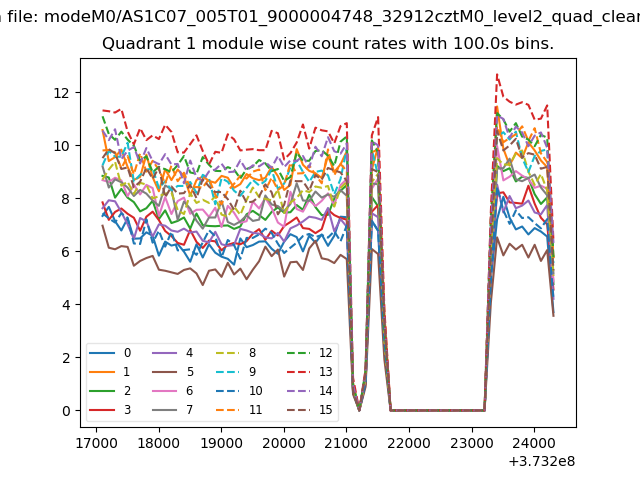 |
 |
| Module-wise count rates for Quadrant C Data is divided into 100 sec bins |
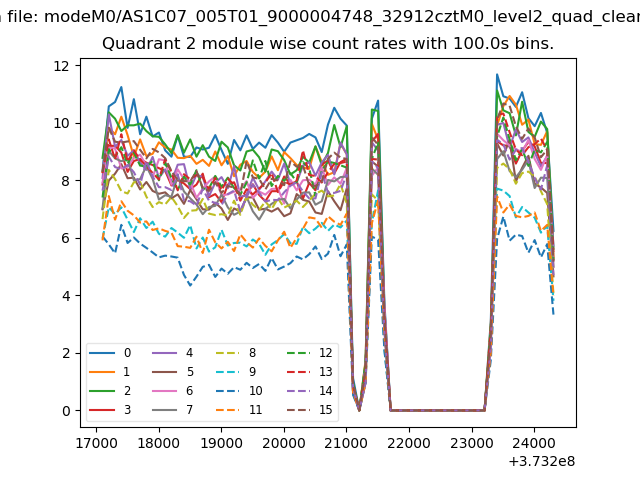 |
 |
| Module-wise count rates for Quadrant D Data is divided into 100 sec bins |
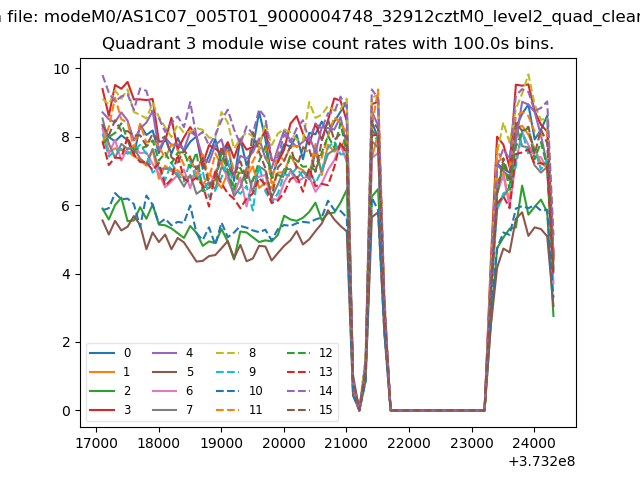 |
 |
| Parameter | Plot |
|---|---|
| CZT HV Monitor | 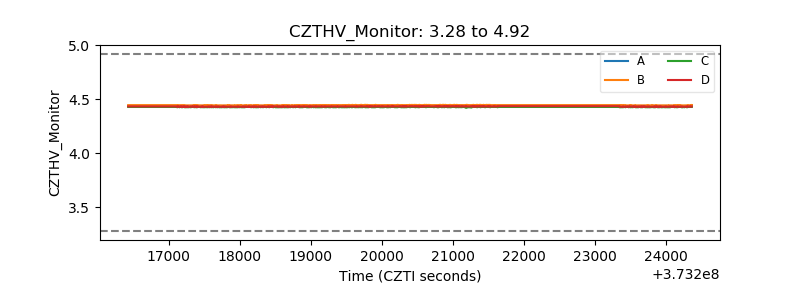 |
| D_VDD | 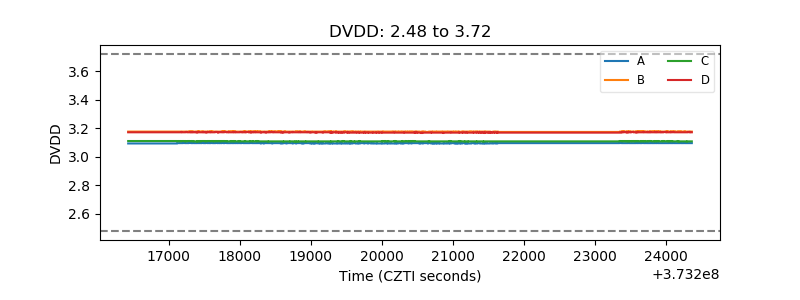 |
| Temperature 1 | 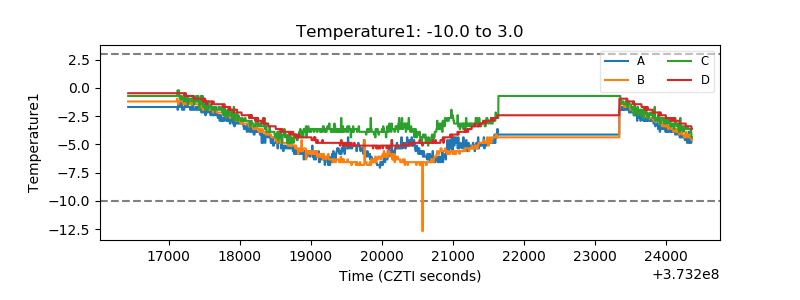 |
| Veto HV Monitor | 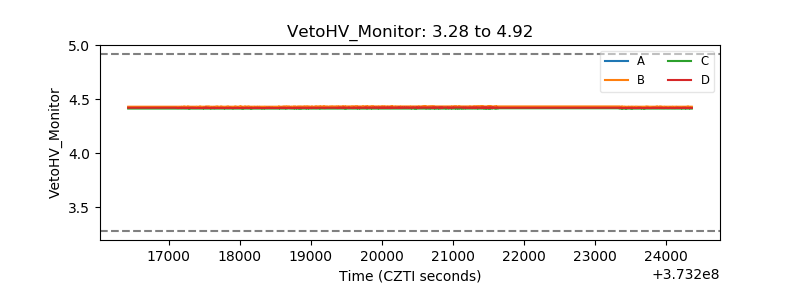 |
| Veto LLD | 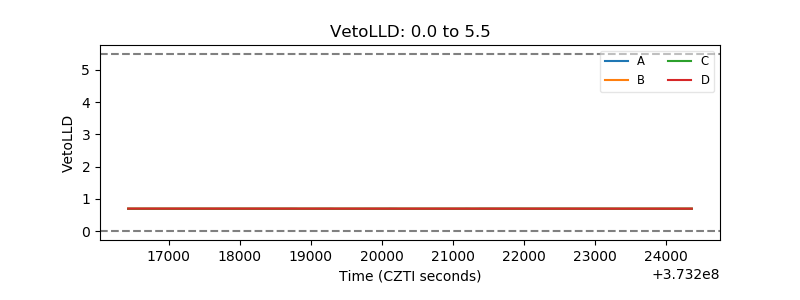 |
| Alpha Counter | 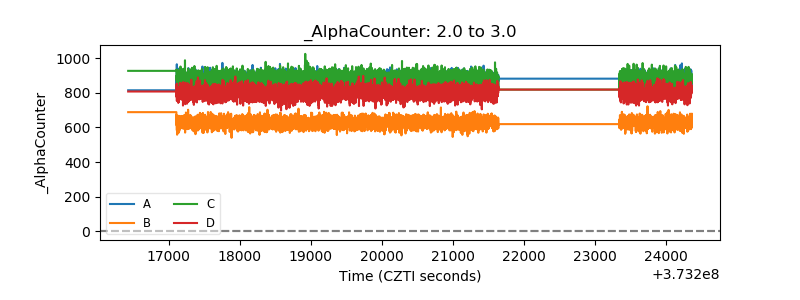 |
| _CPM_Rate | 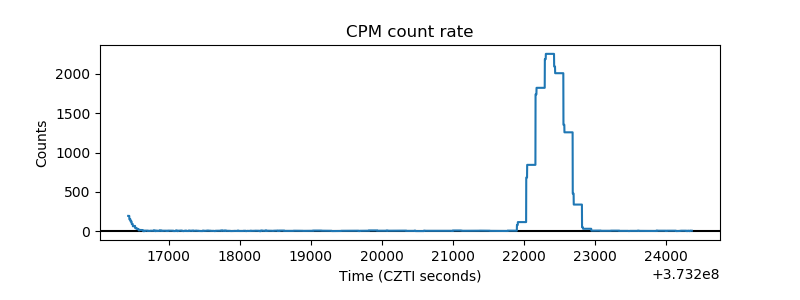 |
| CZT Counter | 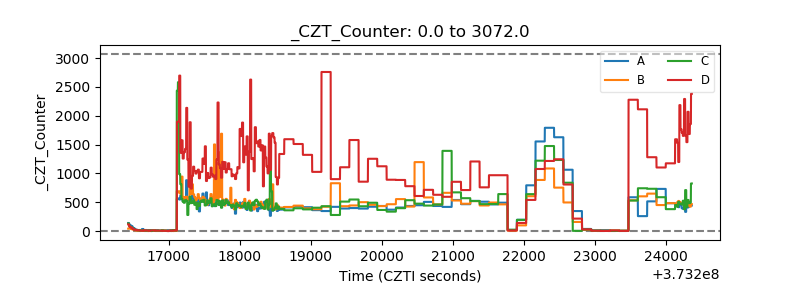 |
| +2.5 Volts monitor |  |
| +5 Volts monitor |  |
| _ROLL_ROT | 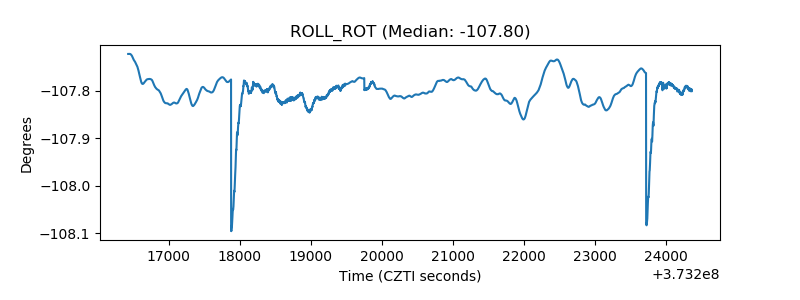 |
| _Roll_DEC | 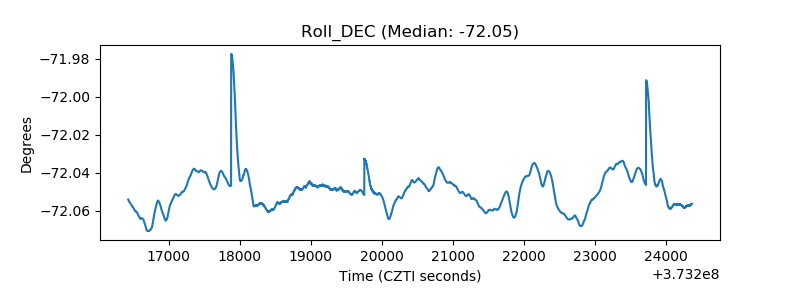 |
| _Roll_RA | 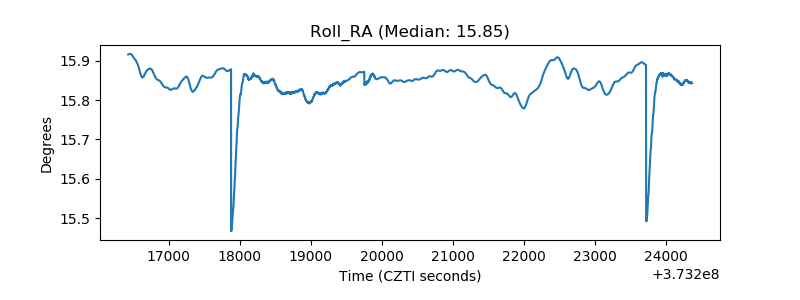 |
| Veto Counter | 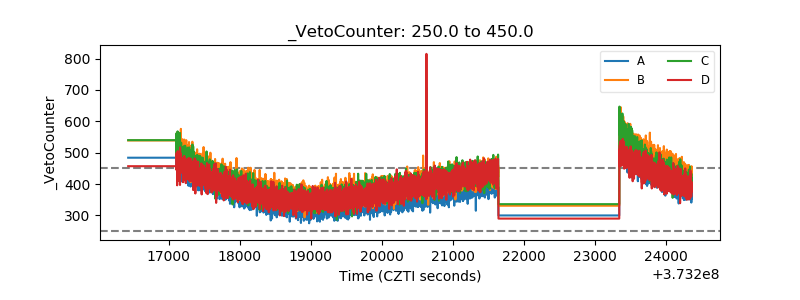 |