| Param | Original file | Final file |
|---|---|---|
| Filename | modeM0/AS1C07_005T01_9000004748_32915cztM0_level2.evt | modeM0/AS1C07_005T01_9000004748_32915cztM0_level2_quad_clean.evt |
| Size (bytes) | 529,571,520 | 99,800,640 |
| Size | 505.0 MB | 95.2 MB |
| Events in quadrant A | 2,436,236 | 697,655 |
| Events in quadrant B | 3,202,879 | 705,098 |
| Events in quadrant C | 2,889,015 | 678,291 |
| Events in quadrant D | 7,164,124 | 582,854 |
| Mode SS | |||
|---|---|---|---|
| Quadrant | BADHDUFLAG | Total packets | Discarded packets |
| A | 0 | 106 | 0 |
| B | 0 | 106 | 0 |
| C | 0 | 106 | 0 |
| D | 0 | 106 | 0 |
| Mode M9 | |||
|---|---|---|---|
| Quadrant | BADHDUFLAG | Total packets | Discarded packets |
| A | 0 | 32 | 0 |
| B | 0 | 32 | 0 |
| C | 0 | 32 | 0 |
| D | 0 | 33 | 0 |
| Mode M0 | |||
|---|---|---|---|
| Quadrant | BADHDUFLAG | Total packets | Discarded packets |
| A | 0 | 10420 | 3 |
| B | 0 | 12764 | 2 |
| C | 0 | 11715 | 2 |
| D | 0 | 24835 | 2 |
| Quadrant | Total seconds | Saturated seconds | Saturation percentage |
|---|---|---|---|
| A | 5106 | 10 | 0.195848% |
| B | 5106 | 173 | 3.388171% |
| C | 5106 | 104 | 2.036819% |
| D | 5106 | 850 | 16.647082% |
Noise dominated data is calculated using 1-second bins in cleaned event files. If a bin has >2000 counts, and if more than 50% of those come from <1% of pixels, then it is considered to be noise-dominated and hence unusable.
| Quadrant | # 1 sec bins | Bins with >0 counts | Bins with >2000 counts | High rate bins dominated by noise | Noise dominated (total time) | Noise dominated (detector-on time) | Marked lightcurve |
|---|---|---|---|---|---|---|---|
| A | 7048 | 5107 | 0 | 0 | 0.00% | 0.00% | 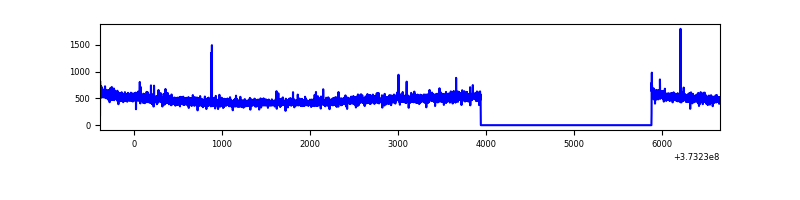 |
| B | 7048 | 5107 | 97 | 97 | 1.38% | 1.90% | 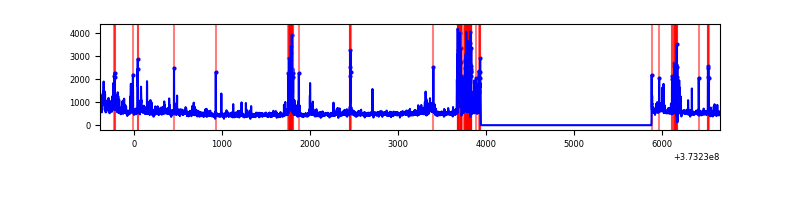 |
| C | 7048 | 5107 | 87 | 87 | 1.23% | 1.70% | 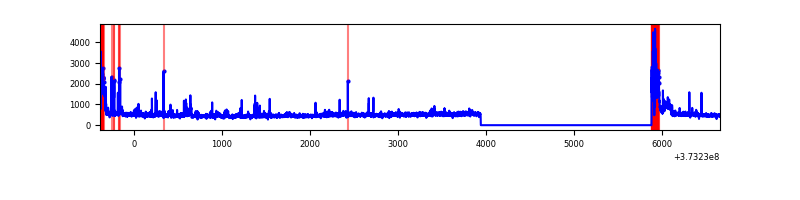 |
| D | 7048 | 5107 | 825 | 825 | 11.71% | 16.15% | 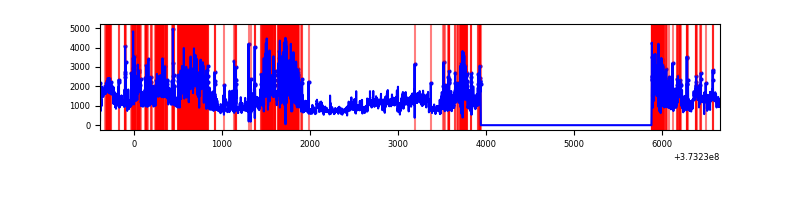 |
Top three noisy pixels from each quadrant. If the there are fewer than three noisy pixels in the level2.evt file, extra rows are filled as -1
| Pixel properties | Quadrant properties | ||||||
|---|---|---|---|---|---|---|---|
| Quadrant | DetID | PixID | Counts | Sigma | Mean | Median | Sigma |
| A | 13 | 6 | 14252 | 110.93 | 618 | 608 | 123.0 |
| A | 15 | 169 | 13677 | 106.26 | 618 | 608 | 123.0 |
| A | 13 | 254 | 9717 | 74.06 | 618 | 608 | 123.0 |
| B | 5 | 172 | 374162 | 3209.1 | 620 | 606 | 116.4 |
| B | 0 | 189 | 110440 | 943.55 | 620 | 606 | 116.4 |
| B | 5 | 200 | 76114 | 648.67 | 620 | 606 | 116.4 |
| C | 0 | 10 | 374632 | 2757.84 | 596 | 602 | 135.6 |
| C | 4 | 254 | 52684 | 384.02 | 596 | 602 | 135.6 |
| C | 15 | 159 | 42007 | 305.29 | 596 | 602 | 135.6 |
| D | 8 | 195 | 2055428 | 14509.9 | 551 | 539 | 141.6 |
| D | 2 | 250 | 803557 | 5670.24 | 551 | 539 | 141.6 |
| D | 12 | 227 | 725238 | 5117.21 | 551 | 539 | 141.6 |
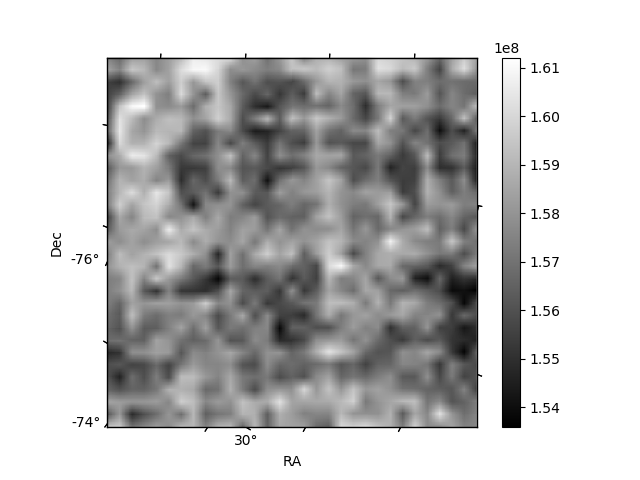
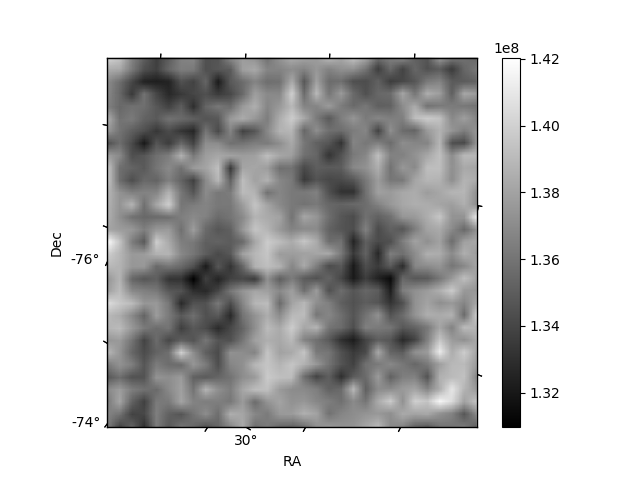
Histogram calculated using DETX and DETY for each event in the final _common_clean file
| Quadrant A |  |
 |
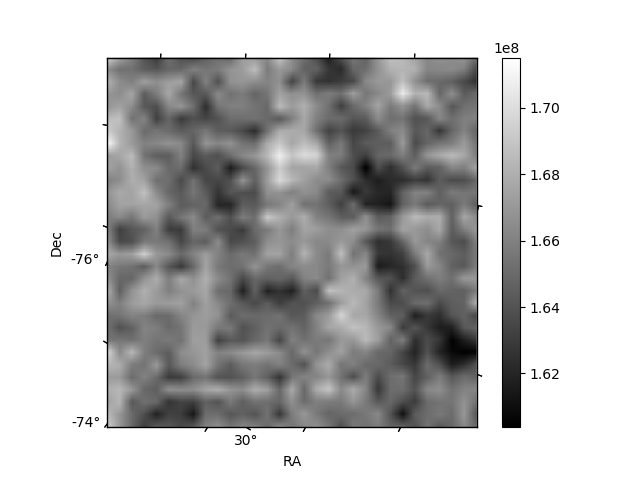
Quadrant B |
|---|---|---|---|
| Quadrant D | 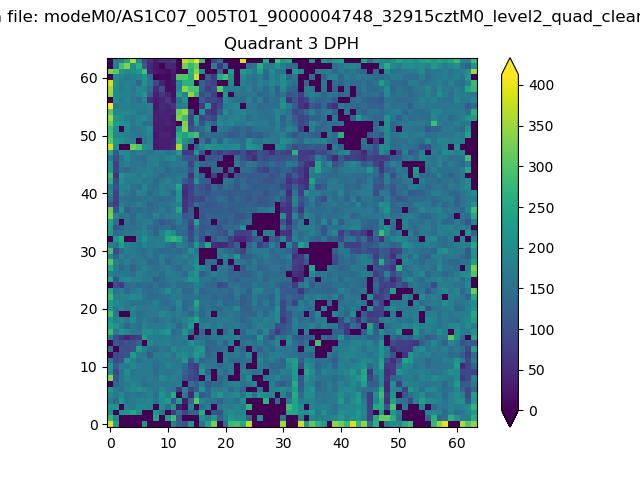 |
 |
Quadrant C |
| Plot type | Count rate plots | Images |
|---|---|---|
| Comparison with Poisson distribution Blue bars denote a histogram of data divided into 1 sec bins. Red curve is a Poisson curve with rate = median count rate of data. |
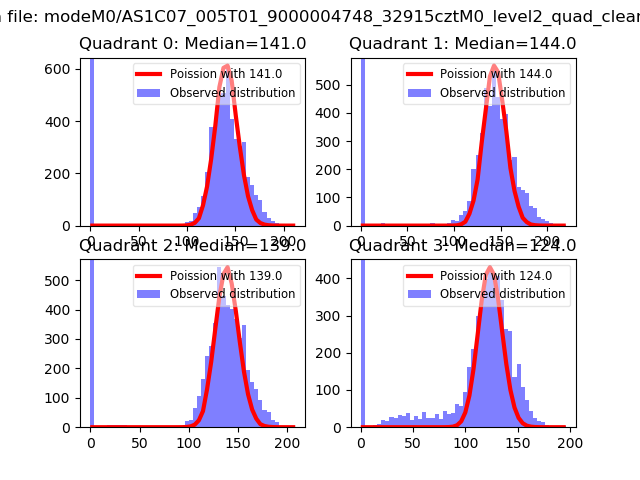 |
 |
| Quadrant-wise count rates Data is divided into 100 sec bins |
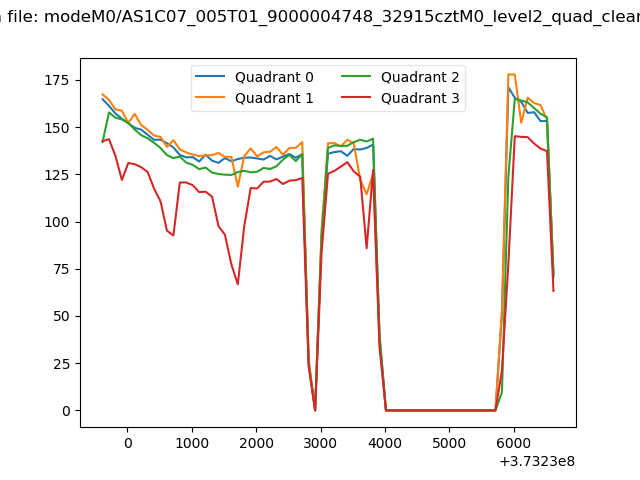 |
|
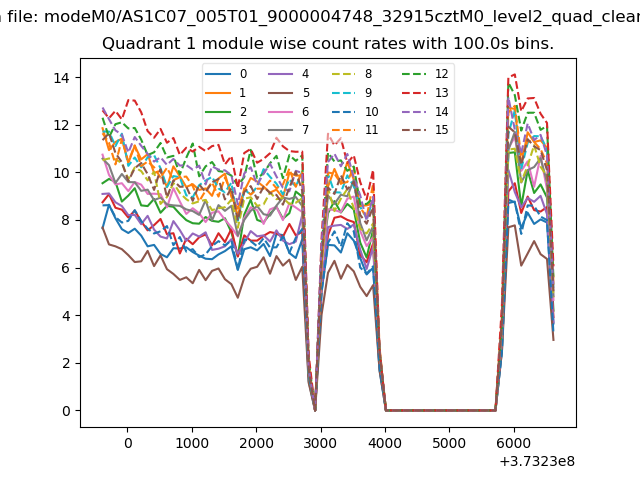
| Module-wise count rates for Quadrant A Data is divided into 100 sec bins |
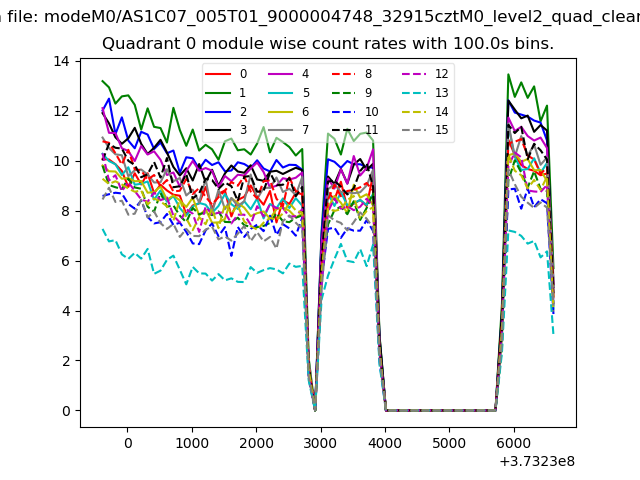 |
 |
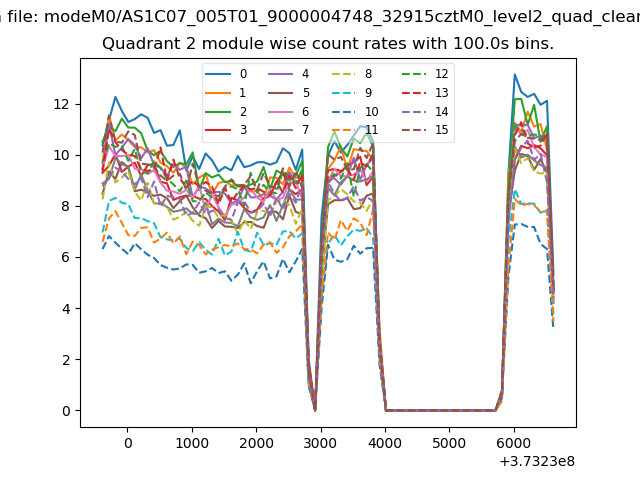
| Module-wise count rates for Quadrant B Data is divided into 100 sec bins |
 |
 |
| Module-wise count rates for Quadrant C Data is divided into 100 sec bins |
 |
 |
| Module-wise count rates for Quadrant D Data is divided into 100 sec bins |
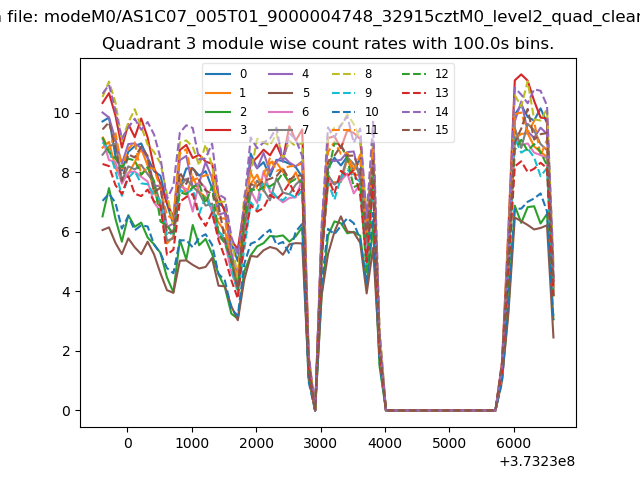 |
 |
| Parameter | Plot |
|---|---|
| CZT HV Monitor | 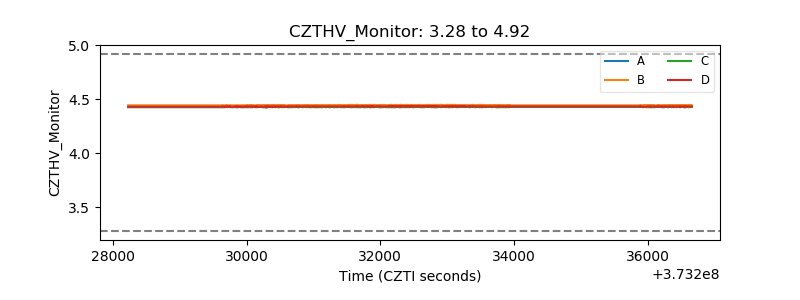 |
| D_VDD | 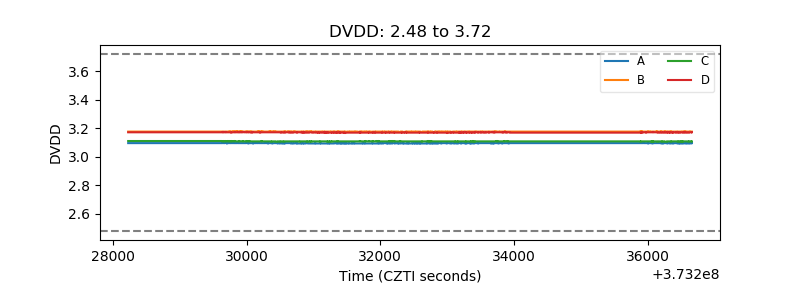 |
| Temperature 1 | 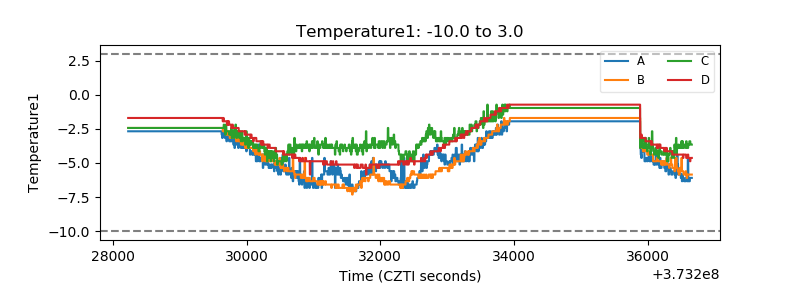 |
| Veto HV Monitor | 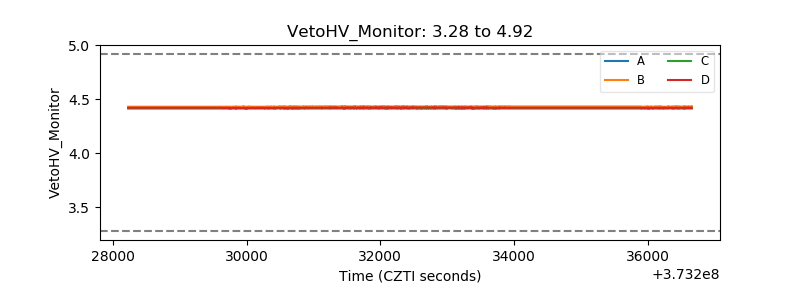 |
| Veto LLD | 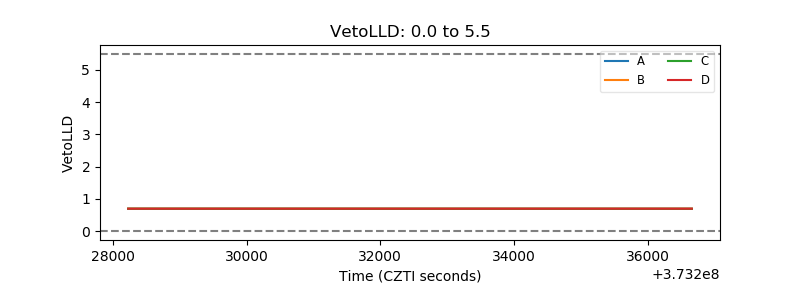 |
| Alpha Counter | 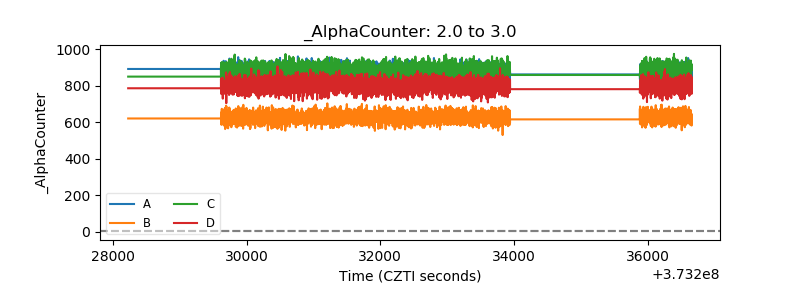 |
| _CPM_Rate | 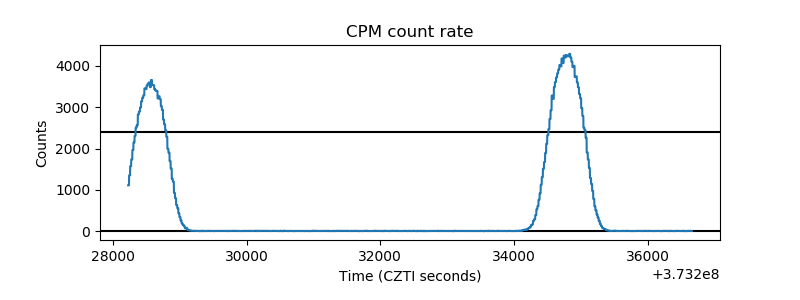 |
| CZT Counter |  |
| +2.5 Volts monitor |  |
| +5 Volts monitor |  |
| _ROLL_ROT | 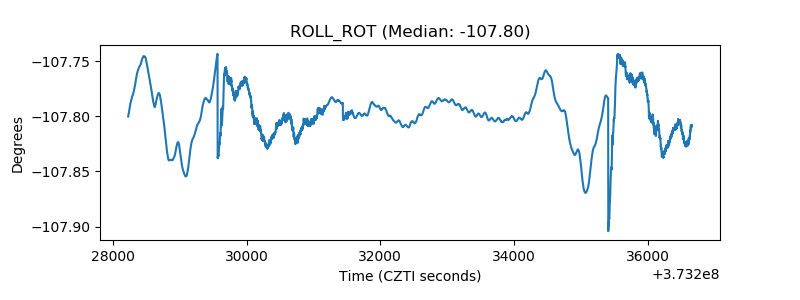 |
| _Roll_DEC | 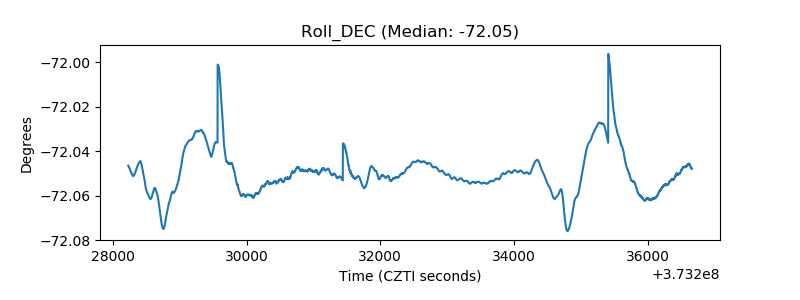 |
| _Roll_RA | 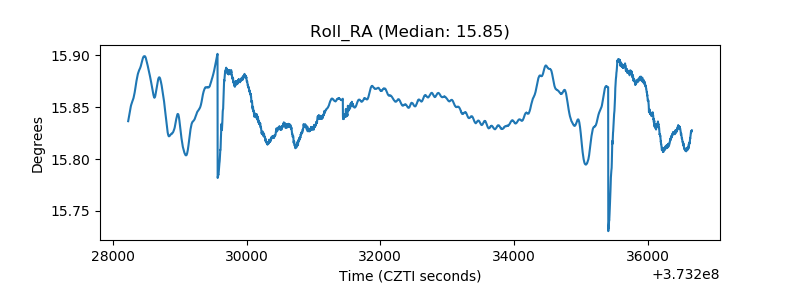 |
| Veto Counter | 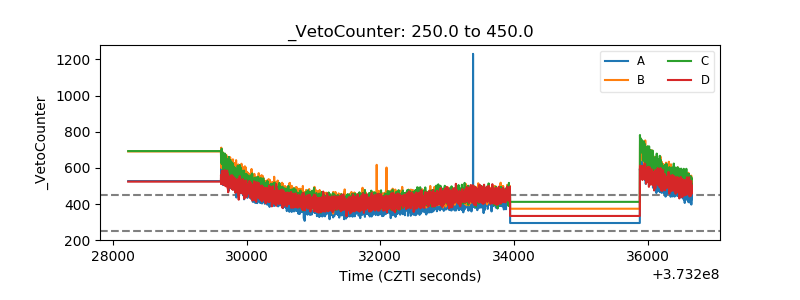 |