| Param | Original file | Final file |
|---|---|---|
| Filename | modeM0/AS1C07_005T01_9000004748_32917cztM0_level2.evt | modeM0/AS1C07_005T01_9000004748_32917cztM0_level2_quad_clean.evt |
| Size (bytes) | 530,262,720 | 106,364,160 |
| Size | 505.7 MB | 101.4 MB |
| Events in quadrant A | 2,514,843 | 742,291 |
| Events in quadrant B | 3,665,862 | 743,697 |
| Events in quadrant C | 2,918,147 | 743,466 |
| Events in quadrant D | 6,608,030 | 627,273 |
| Mode SS | |||
|---|---|---|---|
| Quadrant | BADHDUFLAG | Total packets | Discarded packets |
| A | 0 | 104 | 0 |
| B | 0 | 104 | 0 |
| C | 0 | 104 | 0 |
| D | 0 | 104 | 0 |
| Mode M9 | |||
|---|---|---|---|
| Quadrant | BADHDUFLAG | Total packets | Discarded packets |
| A | 0 | 32 | 0 |
| B | 0 | 32 | 0 |
| C | 0 | 32 | 0 |
| D | 0 | 33 | 0 |
| Mode M0 | |||
|---|---|---|---|
| Quadrant | BADHDUFLAG | Total packets | Discarded packets |
| A | 0 | 10611 | 3 |
| B | 0 | 14081 | 2 |
| C | 0 | 11701 | 2 |
| D | 0 | 23312 | 2 |
| Quadrant | Total seconds | Saturated seconds | Saturation percentage |
|---|---|---|---|
| A | 5207 | 11 | 0.211254% |
| B | 5207 | 373 | 7.163434% |
| C | 5207 | 85 | 1.632418% |
| D | 5207 | 837 | 16.074515% |
Noise dominated data is calculated using 1-second bins in cleaned event files. If a bin has >2000 counts, and if more than 50% of those come from <1% of pixels, then it is considered to be noise-dominated and hence unusable.
| Quadrant | # 1 sec bins | Bins with >0 counts | Bins with >2000 counts | High rate bins dominated by noise | Noise dominated (total time) | Noise dominated (detector-on time) | Marked lightcurve |
|---|---|---|---|---|---|---|---|
| A | 7360 | 5208 | 2 | 2 | 0.03% | 0.04% | 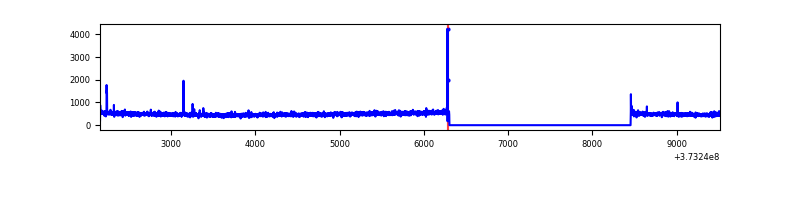 |
| B | 7360 | 5207 | 256 | 256 | 3.48% | 4.92% | 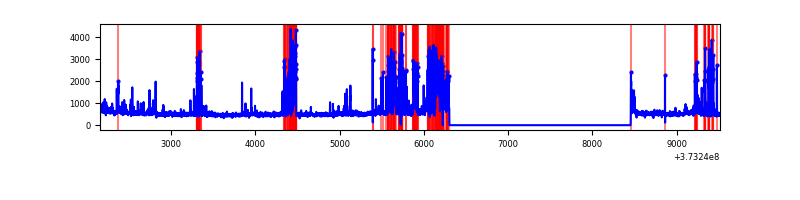 |
| C | 7360 | 5208 | 79 | 79 | 1.07% | 1.52% | 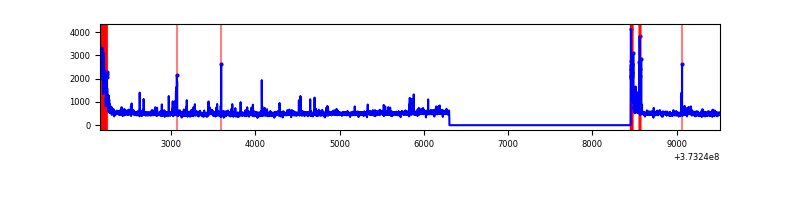 |
| D | 7360 | 5207 | 640 | 640 | 8.70% | 12.29% | 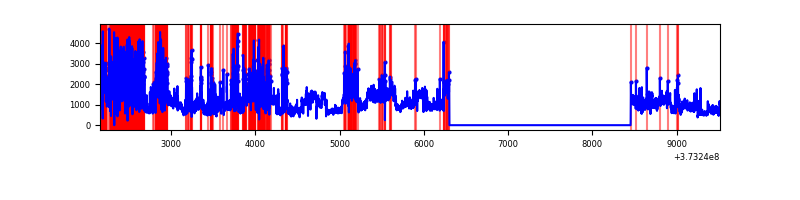 |
Top three noisy pixels from each quadrant. If the there are fewer than three noisy pixels in the level2.evt file, extra rows are filled as -1
| Pixel properties | Quadrant properties | ||||||
|---|---|---|---|---|---|---|---|
| Quadrant | DetID | PixID | Counts | Sigma | Mean | Median | Sigma |
| A | 15 | 169 | 13221 | 99.62 | 639 | 629 | 126.4 |
| A | 13 | 6 | 10026 | 74.35 | 639 | 629 | 126.4 |
| A | 13 | 254 | 9944 | 73.7 | 639 | 629 | 126.4 |
| B | 5 | 172 | 741186 | 6337.45 | 631 | 616 | 116.9 |
| B | 15 | 201 | 117698 | 1001.93 | 631 | 616 | 116.9 |
| B | 10 | 246 | 85983 | 730.53 | 631 | 616 | 116.9 |
| C | 0 | 10 | 287719 | 2000.58 | 632 | 639 | 143.5 |
| C | 14 | 67 | 46324 | 318.37 | 632 | 639 | 143.5 |
| C | 4 | 254 | 43016 | 295.31 | 632 | 639 | 143.5 |
| D | 8 | 195 | 2071285 | 13939.82 | 576 | 566 | 148.5 |
| D | 2 | 250 | 1416161 | 9529.61 | 576 | 566 | 148.5 |
| D | 12 | 218 | 447449 | 3008.36 | 576 | 566 | 148.5 |
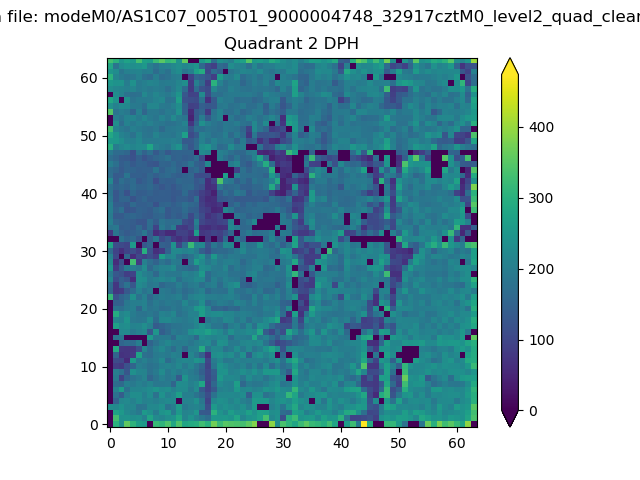
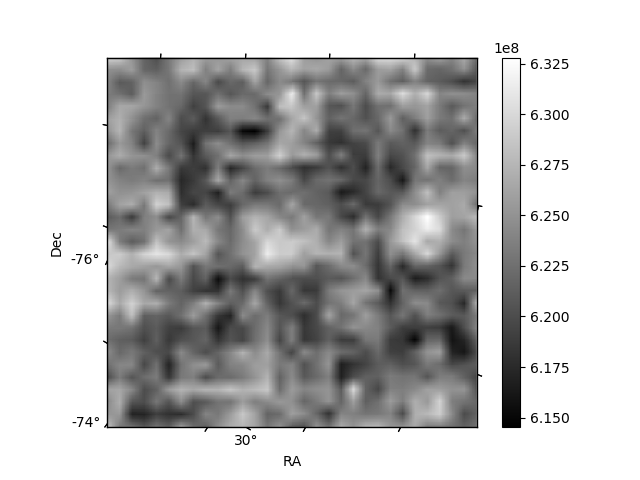
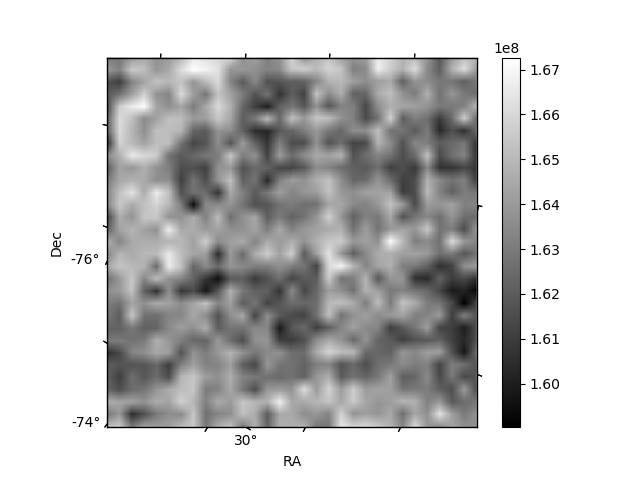
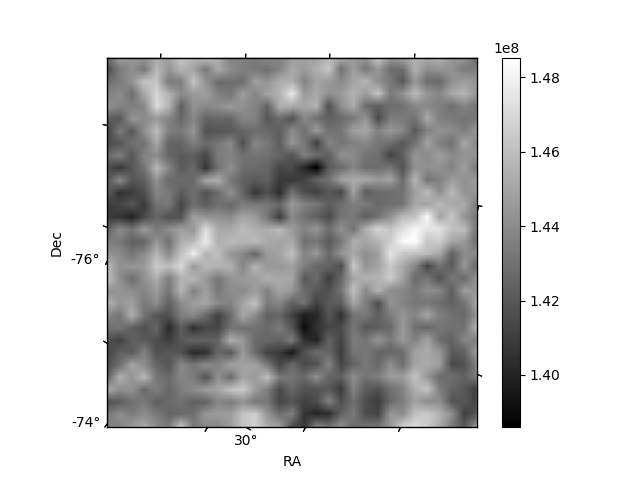
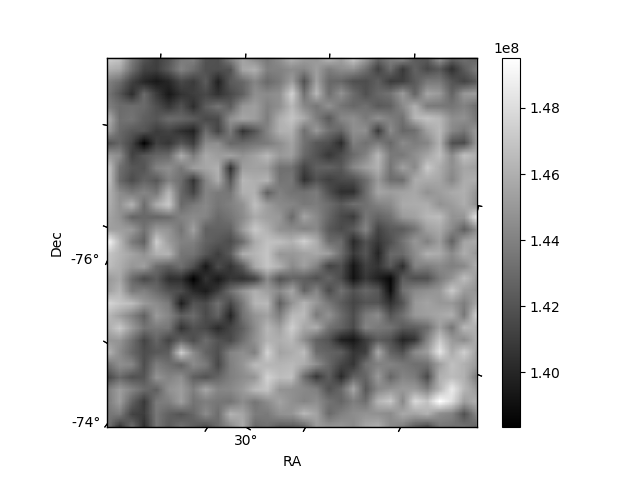
Histogram calculated using DETX and DETY for each event in the final _common_clean file
| Quadrant A | 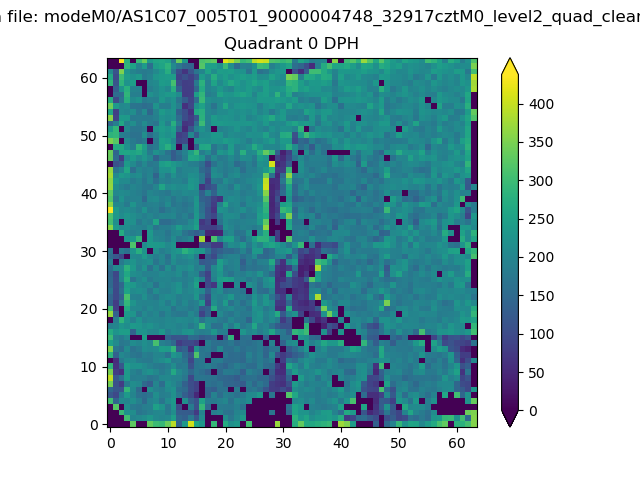 |
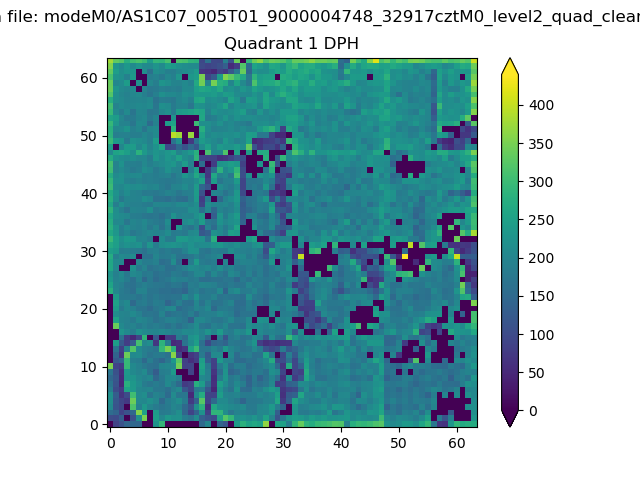 |
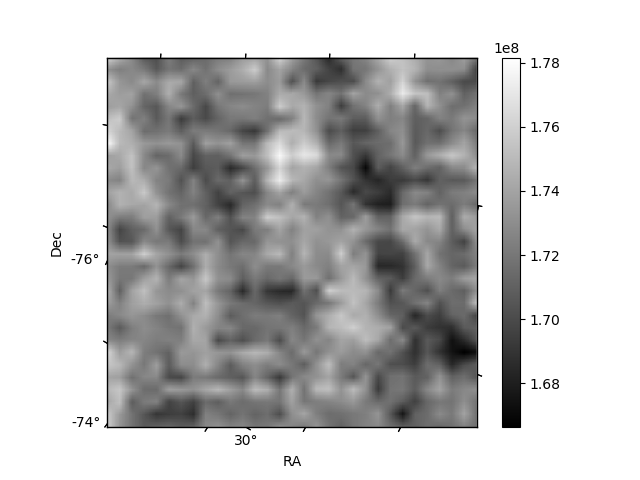
Quadrant B |
|---|---|---|---|
| Quadrant D | 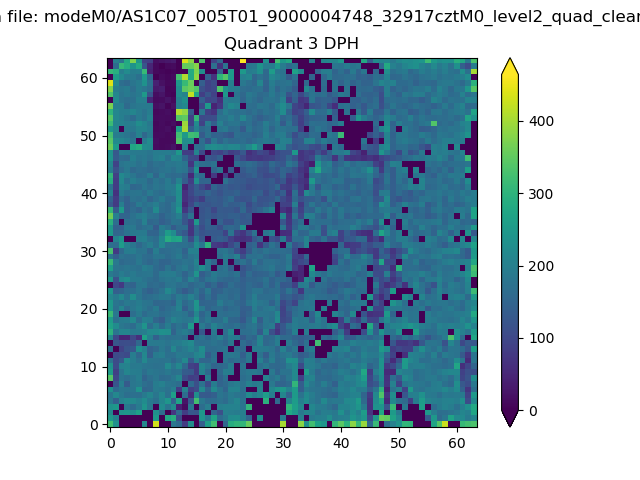 |
 |
Quadrant C |
| Plot type | Count rate plots | Images |
|---|---|---|
| Comparison with Poisson distribution Blue bars denote a histogram of data divided into 1 sec bins. Red curve is a Poisson curve with rate = median count rate of data. |
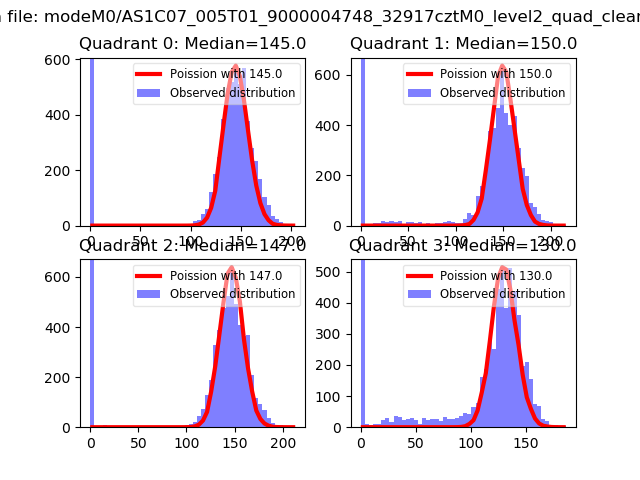 |
 |
| Quadrant-wise count rates Data is divided into 100 sec bins |
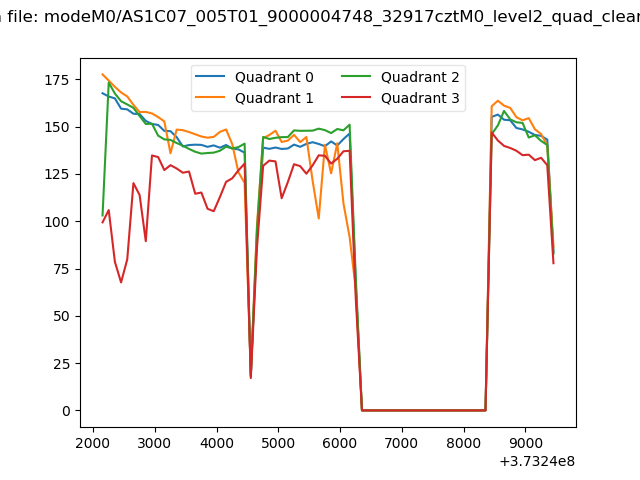 |
|
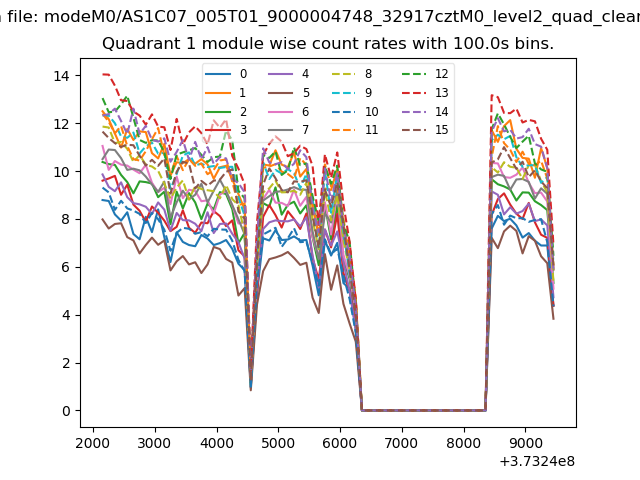
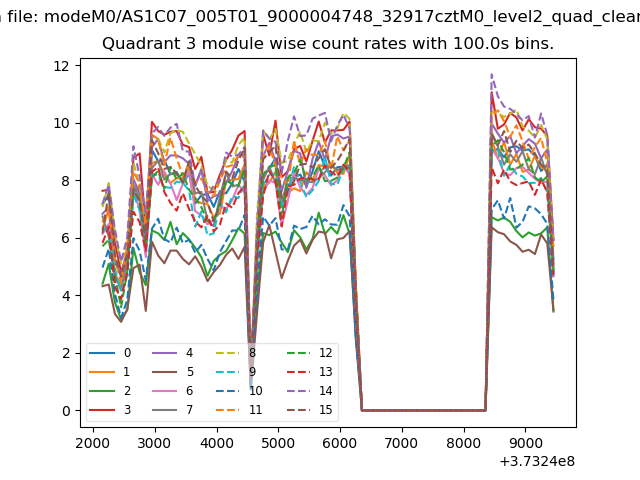
| Module-wise count rates for Quadrant A Data is divided into 100 sec bins |
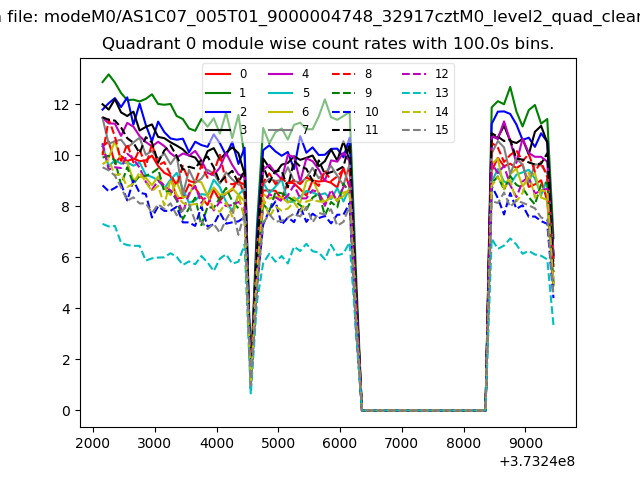 |
 |
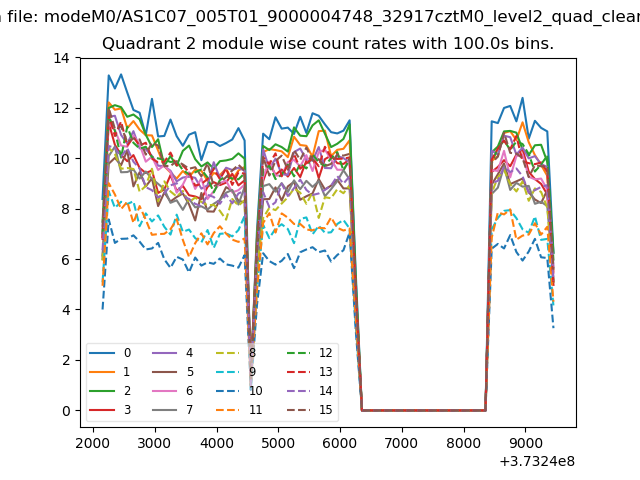
| Module-wise count rates for Quadrant B Data is divided into 100 sec bins |
 |
 |
| Module-wise count rates for Quadrant C Data is divided into 100 sec bins |
 |
 |
| Module-wise count rates for Quadrant D Data is divided into 100 sec bins |
 |
 |
| Parameter | Plot |
|---|---|
| CZT HV Monitor | 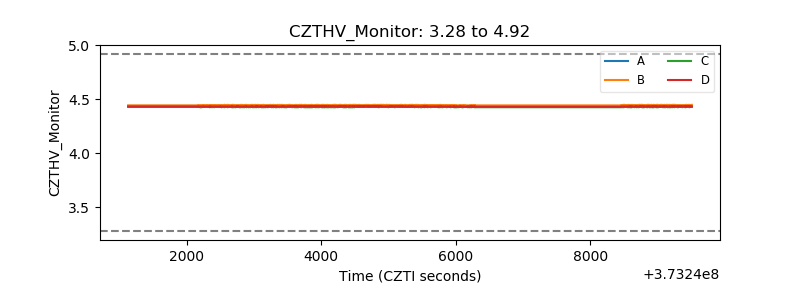 |
| D_VDD | 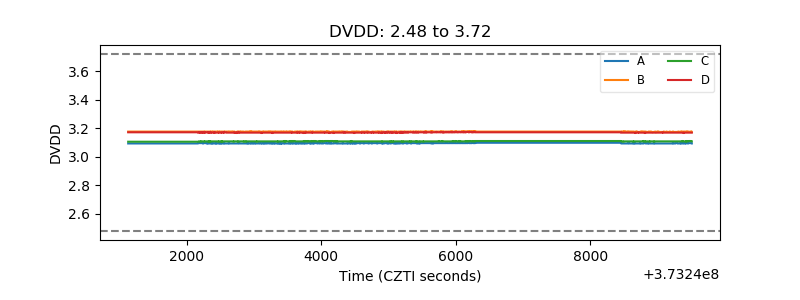 |
| Temperature 1 | 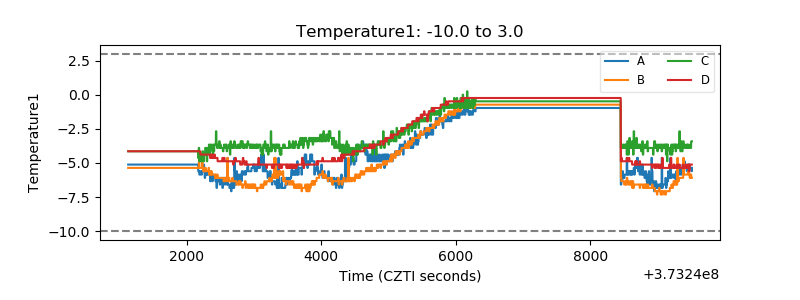 |
| Veto HV Monitor | 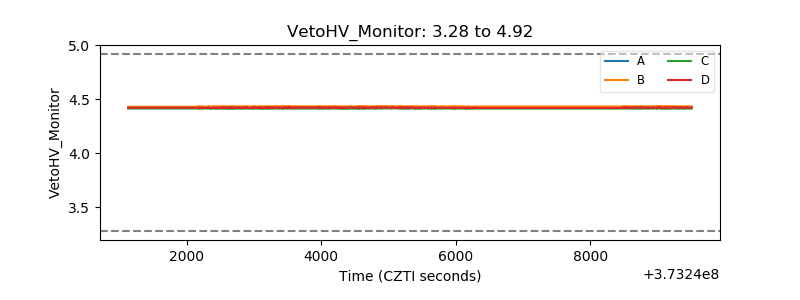 |
| Veto LLD | 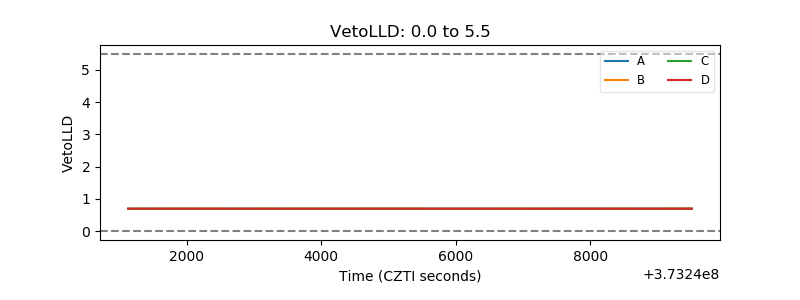 |
| Alpha Counter | 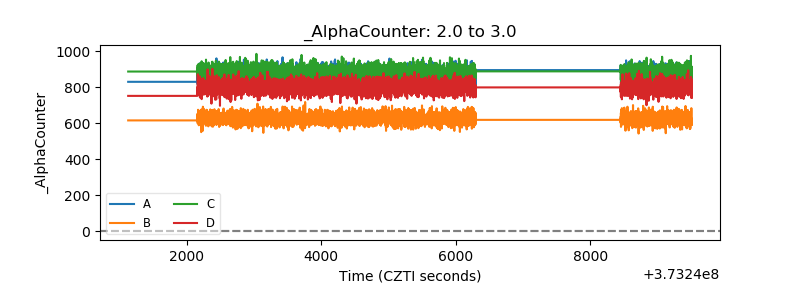 |
| _CPM_Rate | 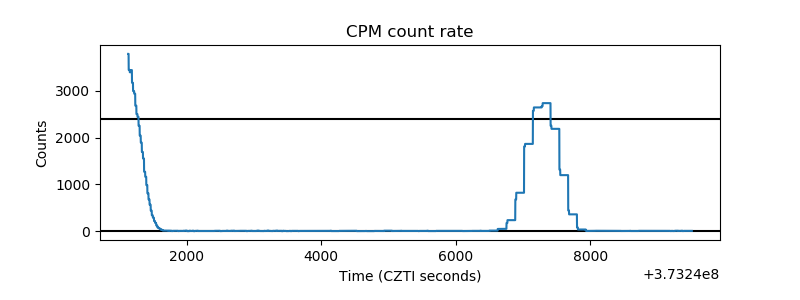 |
| CZT Counter | 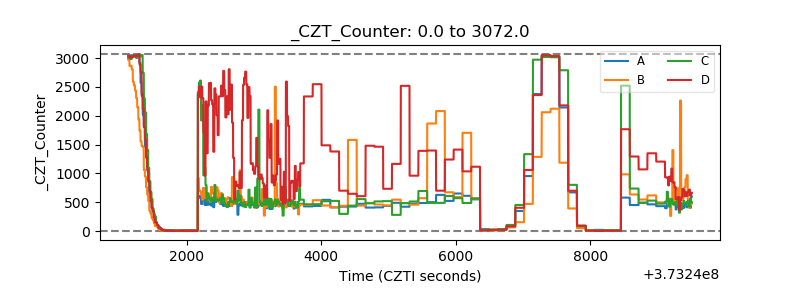 |
| +2.5 Volts monitor |  |
| +5 Volts monitor |  |
| _ROLL_ROT | 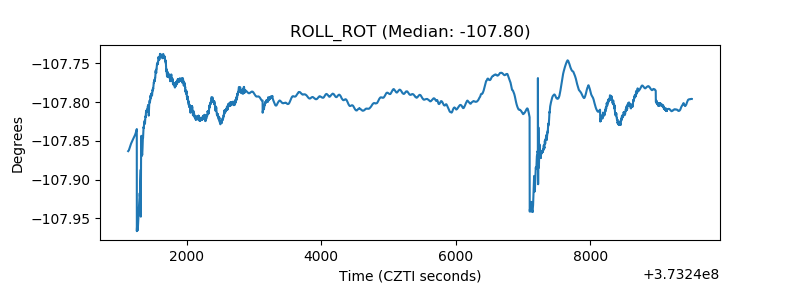 |
| _Roll_DEC | 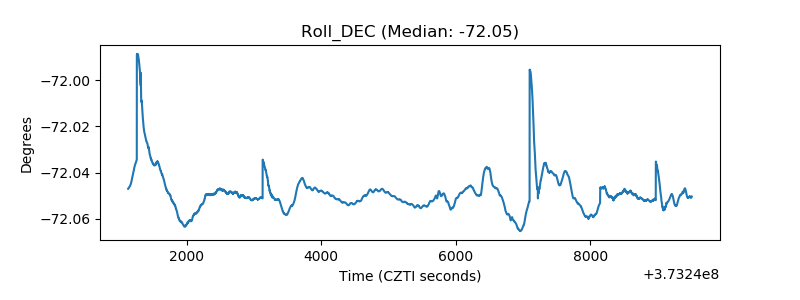 |
| _Roll_RA | 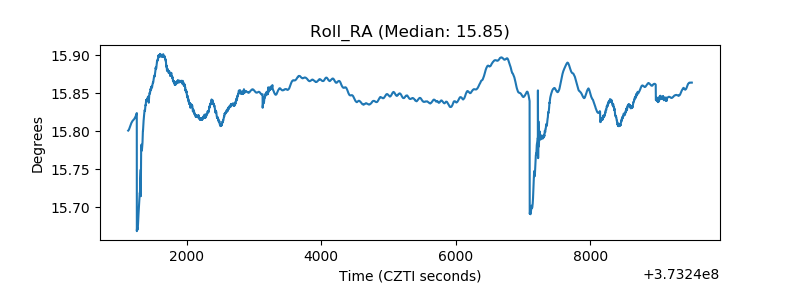 |
| Veto Counter | 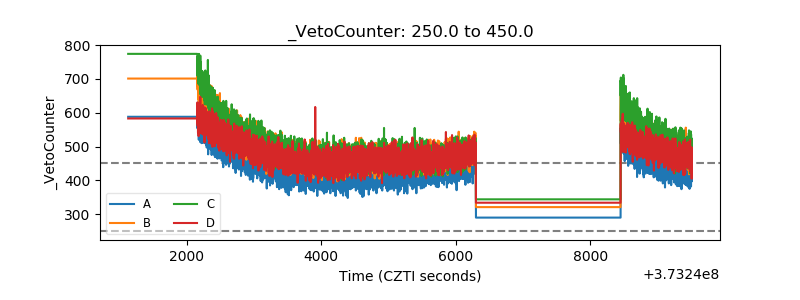 |