| Param | Original file | Final file |
|---|---|---|
| Filename | modeM0/AS1C07_005T01_9000004748_32918cztM0_level2.evt | modeM0/AS1C07_005T01_9000004748_32918cztM0_level2_quad_clean.evt |
| Size (bytes) | 441,541,440 | 104,575,680 |
| Size | 421.1 MB | 99.7 MB |
| Events in quadrant A | 2,381,822 | 713,629 |
| Events in quadrant B | 3,112,911 | 722,296 |
| Events in quadrant C | 2,692,124 | 719,226 |
| Events in quadrant D | 4,841,338 | 656,677 |
| Mode SS | |||
|---|---|---|---|
| Quadrant | BADHDUFLAG | Total packets | Discarded packets |
| A | 0 | 104 | 0 |
| B | 0 | 104 | 0 |
| C | 0 | 104 | 0 |
| D | 0 | 104 | 0 |
| Mode M9 | |||
|---|---|---|---|
| Quadrant | BADHDUFLAG | Total packets | Discarded packets |
| A | 0 | 36 | 0 |
| B | 0 | 36 | 0 |
| C | 0 | 36 | 0 |
| D | 0 | 37 | 0 |
| Mode M0 | |||
|---|---|---|---|
| Quadrant | BADHDUFLAG | Total packets | Discarded packets |
| A | 0 | 10199 | 3 |
| B | 0 | 12309 | 2 |
| C | 0 | 10959 | 2 |
| D | 0 | 17952 | 2 |
| Quadrant | Total seconds | Saturated seconds | Saturation percentage |
|---|---|---|---|
| A | 5066 | 5 | 0.098697% |
| B | 5066 | 203 | 4.007106% |
| C | 5066 | 64 | 1.263324% |
| D | 5066 | 169 | 3.335965% |
Noise dominated data is calculated using 1-second bins in cleaned event files. If a bin has >2000 counts, and if more than 50% of those come from <1% of pixels, then it is considered to be noise-dominated and hence unusable.
| Quadrant | # 1 sec bins | Bins with >0 counts | Bins with >2000 counts | High rate bins dominated by noise | Noise dominated (total time) | Noise dominated (detector-on time) | Marked lightcurve |
|---|---|---|---|---|---|---|---|
| A | 7219 | 5066 | 0 | 0 | 0.00% | 0.00% |  |
| B | 7219 | 5066 | 118 | 118 | 1.63% | 2.33% | 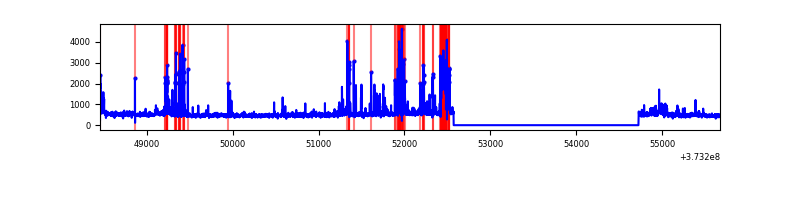 |
| C | 7219 | 5067 | 57 | 57 | 0.79% | 1.12% | 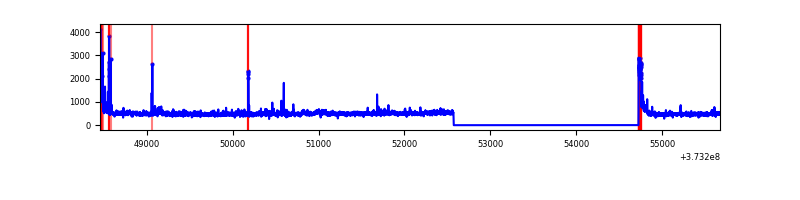 |
| D | 7219 | 5066 | 152 | 152 | 2.11% | 3.00% | 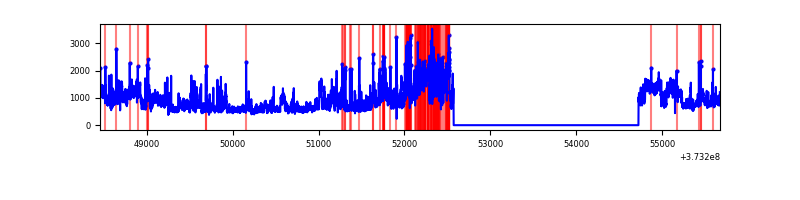 |
Top three noisy pixels from each quadrant. If the there are fewer than three noisy pixels in the level2.evt file, extra rows are filled as -1
| Pixel properties | Quadrant properties | ||||||
|---|---|---|---|---|---|---|---|
| Quadrant | DetID | PixID | Counts | Sigma | Mean | Median | Sigma |
| A | 13 | 254 | 9772 | 76.23 | 611 | 600 | 120.3 |
| A | 13 | 6 | 6606 | 49.91 | 611 | 600 | 120.3 |
| A | 0 | 226 | 5265 | 38.77 | 611 | 600 | 120.3 |
| B | 5 | 172 | 509144 | 4488.34 | 611 | 596 | 113.3 |
| B | 0 | 230 | 63980 | 559.41 | 611 | 596 | 113.3 |
| B | 5 | 200 | 55144 | 481.43 | 611 | 596 | 113.3 |
| C | 0 | 10 | 206054 | 1480.69 | 609 | 613 | 138.7 |
| C | 14 | 67 | 45986 | 327.02 | 609 | 613 | 138.7 |
| C | 3 | 233 | 29698 | 209.62 | 609 | 613 | 138.7 |
| D | 8 | 195 | 1778645 | 11560.27 | 589 | 579 | 153.8 |
| D | 2 | 250 | 330976 | 2148.11 | 589 | 579 | 153.8 |
| D | 12 | 227 | 165638 | 1073.15 | 589 | 579 | 153.8 |
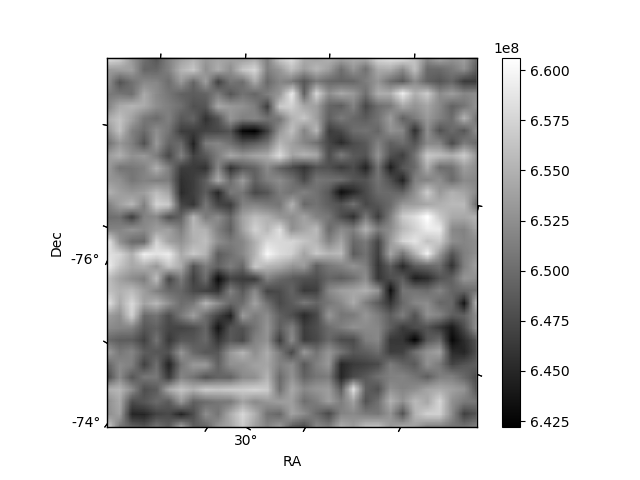
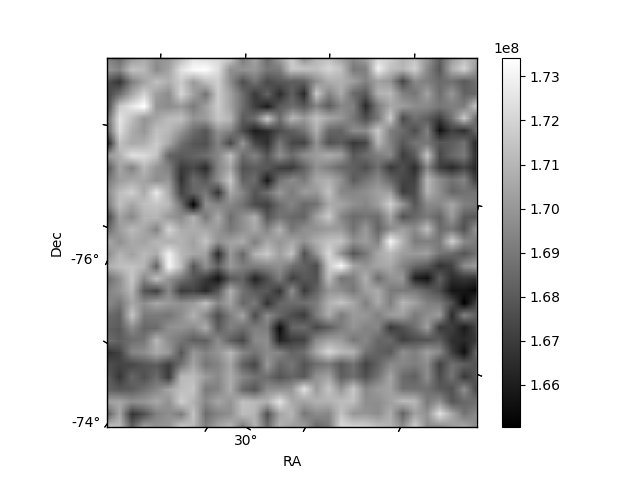
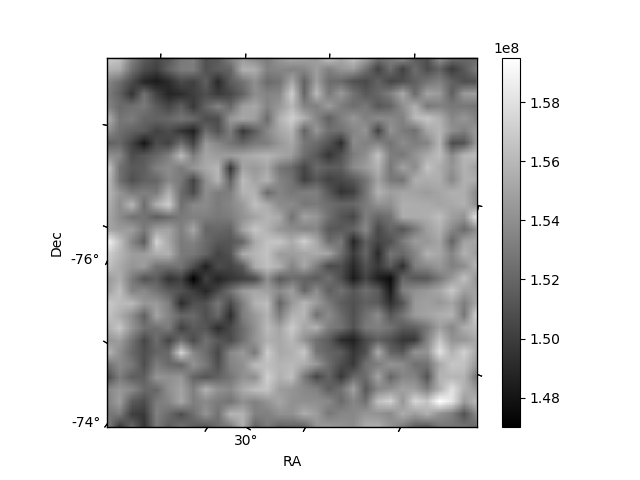
Histogram calculated using DETX and DETY for each event in the final _common_clean file
| Quadrant A |  |
 |
Quadrant B |
|---|---|---|---|
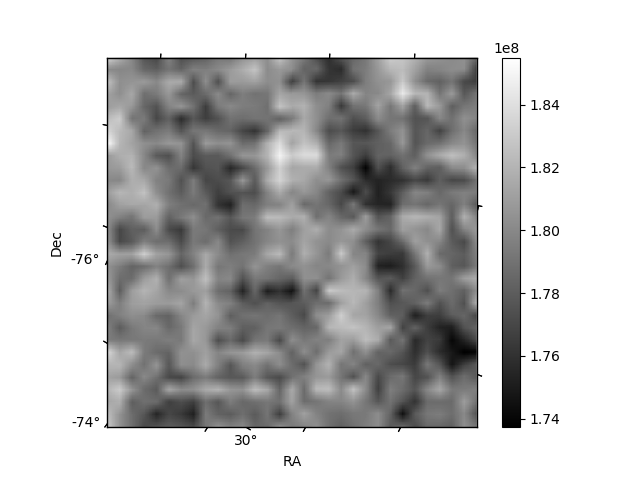
| Quadrant D | 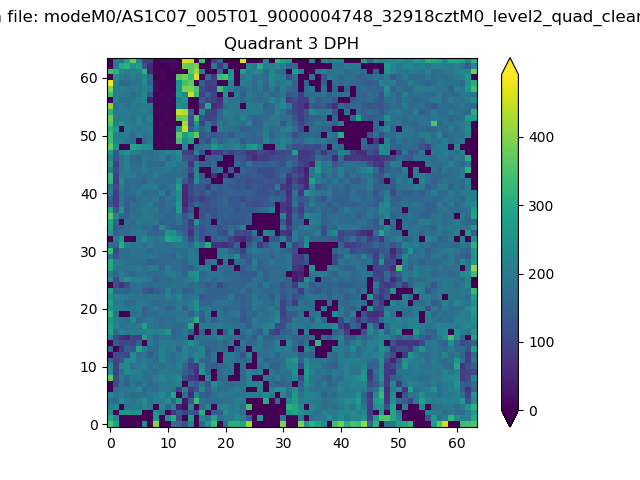 |
 |
Quadrant C |
| Plot type | Count rate plots | Images |
|---|---|---|
| Comparison with Poisson distribution Blue bars denote a histogram of data divided into 1 sec bins. Red curve is a Poisson curve with rate = median count rate of data. |
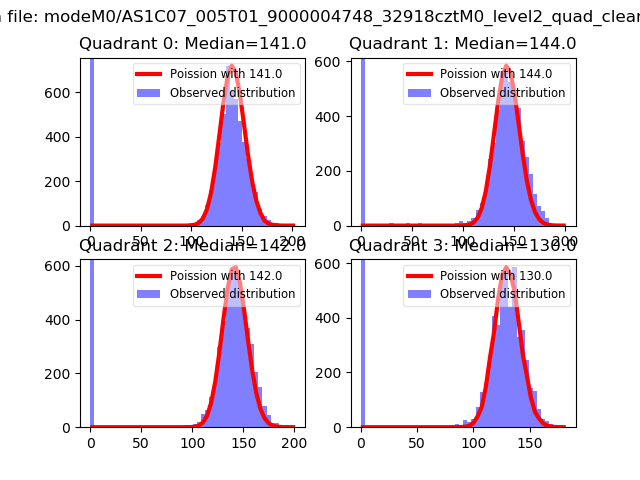 |
 |
| Quadrant-wise count rates Data is divided into 100 sec bins |
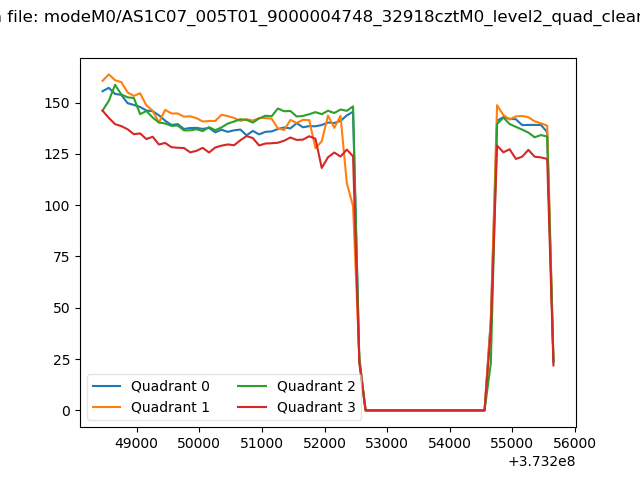 |
|
| Module-wise count rates for Quadrant A Data is divided into 100 sec bins |
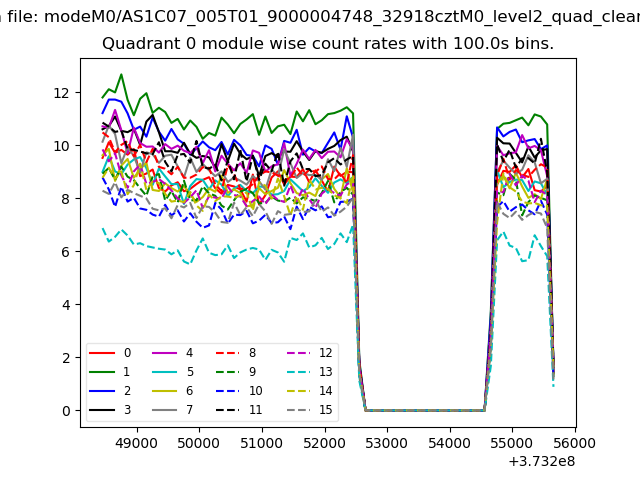 |
 |
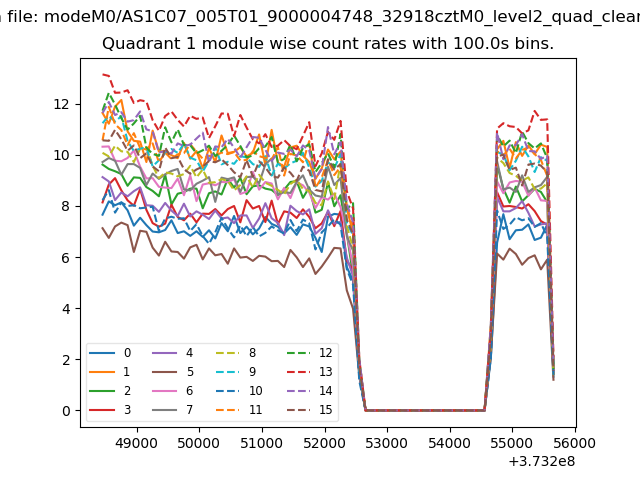
| Module-wise count rates for Quadrant B Data is divided into 100 sec bins |
 |
 |
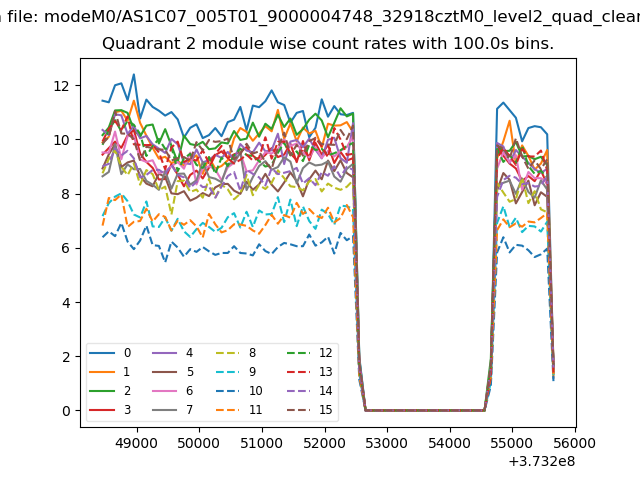
| Module-wise count rates for Quadrant C Data is divided into 100 sec bins |
 |
 |
| Module-wise count rates for Quadrant D Data is divided into 100 sec bins |
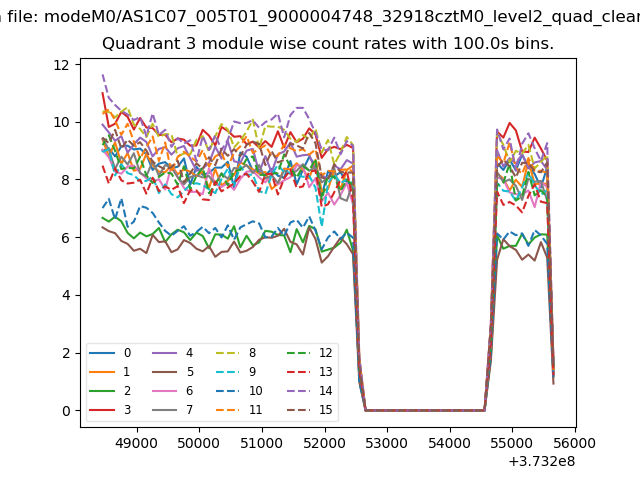 |
 |
| Parameter | Plot |
|---|---|
| CZT HV Monitor | 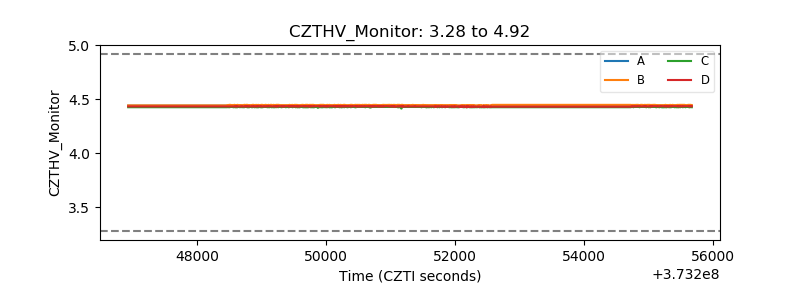 |
| D_VDD | 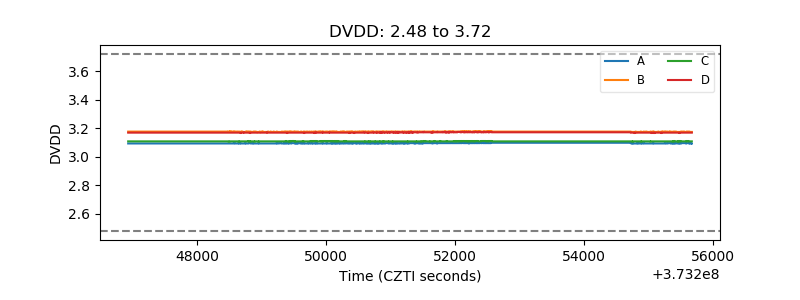 |
| Temperature 1 | 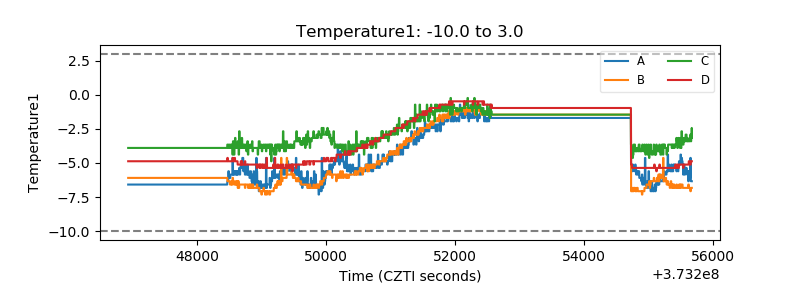 |
| Veto HV Monitor | 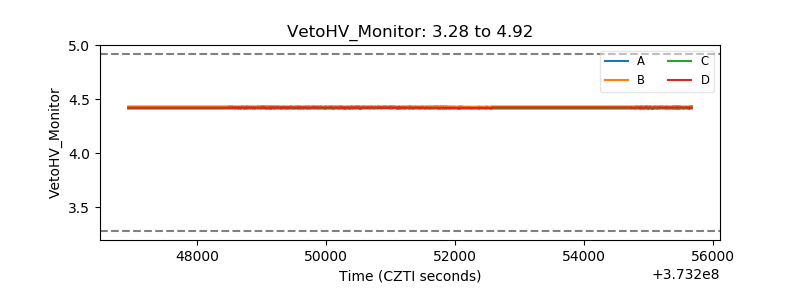 |
| Veto LLD | 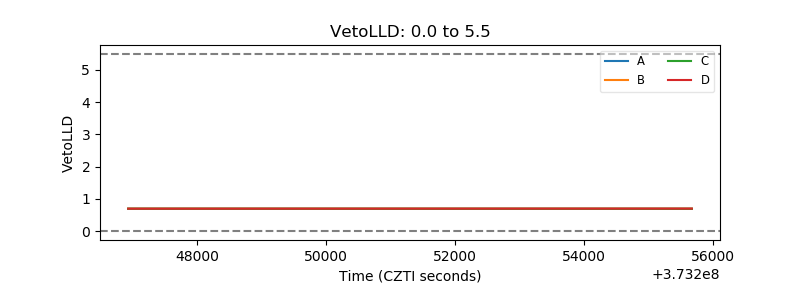 |
| Alpha Counter | 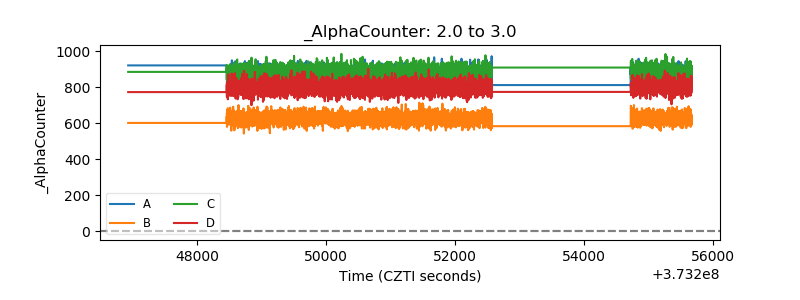 |
| _CPM_Rate | 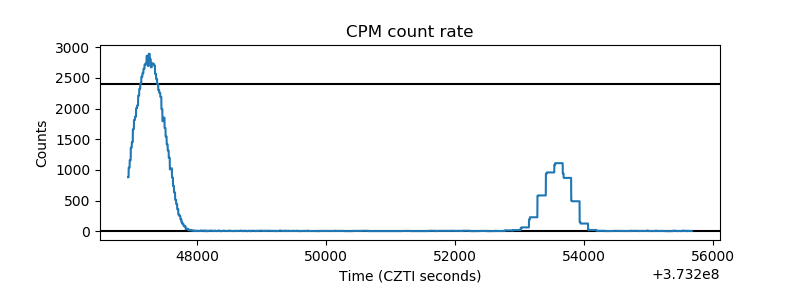 |
| CZT Counter |  |
| +2.5 Volts monitor |  |
| +5 Volts monitor |  |
| _ROLL_ROT | 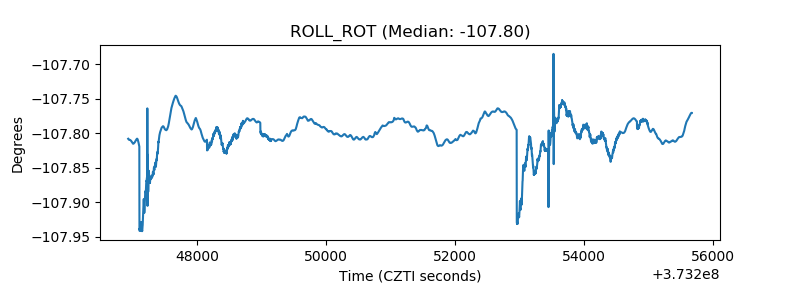 |
| _Roll_DEC | 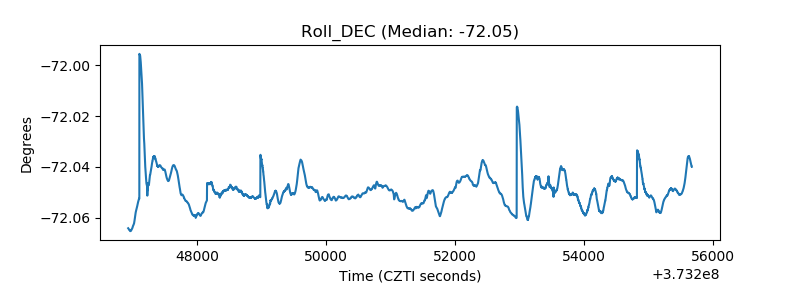 |
| _Roll_RA |  |
| Veto Counter | 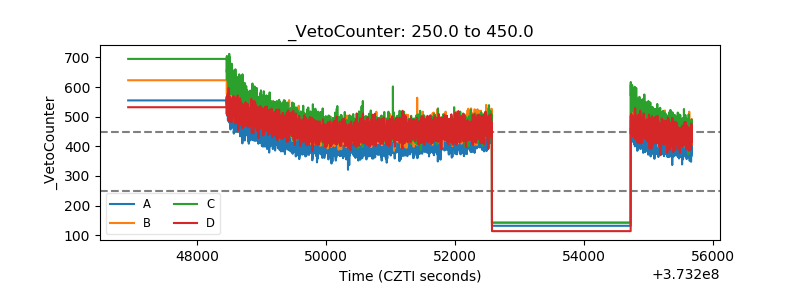 |