| Param | Original file | Final file |
|---|---|---|
| Filename | modeM0/AS1C07_005T01_9000004748_32919cztM0_level2.evt | modeM0/AS1C07_005T01_9000004748_32919cztM0_level2_quad_clean.evt |
| Size (bytes) | 503,735,040 | 99,881,280 |
| Size | 480.4 MB | 95.3 MB |
| Events in quadrant A | 2,361,050 | 685,551 |
| Events in quadrant B | 3,104,776 | 695,544 |
| Events in quadrant C | 2,739,667 | 690,234 |
| Events in quadrant D | 6,702,287 | 593,591 |
| Mode SS | |||
|---|---|---|---|
| Quadrant | BADHDUFLAG | Total packets | Discarded packets |
| A | 0 | 104 | 0 |
| B | 0 | 104 | 0 |
| C | 0 | 104 | 0 |
| D | 0 | 104 | 0 |
| Mode M9 | |||
|---|---|---|---|
| Quadrant | BADHDUFLAG | Total packets | Discarded packets |
| A | 0 | 20 | 0 |
| B | 0 | 20 | 0 |
| C | 0 | 20 | 0 |
| D | 0 | 20 | 0 |
| Mode M0 | |||
|---|---|---|---|
| Quadrant | BADHDUFLAG | Total packets | Discarded packets |
| A | 0 | 10325 | 2 |
| B | 0 | 12473 | 1 |
| C | 0 | 11230 | 1 |
| D | 0 | 23522 | 1 |
| Quadrant | Total seconds | Saturated seconds | Saturation percentage |
|---|---|---|---|
| A | 5136 | 5 | 0.097352% |
| B | 5136 | 164 | 3.193146% |
| C | 5136 | 67 | 1.304517% |
| D | 5136 | 769 | 14.972741% |
Noise dominated data is calculated using 1-second bins in cleaned event files. If a bin has >2000 counts, and if more than 50% of those come from <1% of pixels, then it is considered to be noise-dominated and hence unusable.
| Quadrant | # 1 sec bins | Bins with >0 counts | Bins with >2000 counts | High rate bins dominated by noise | Noise dominated (total time) | Noise dominated (detector-on time) | Marked lightcurve |
|---|---|---|---|---|---|---|---|
| A | 7139 | 5137 | 0 | 0 | 0.00% | 0.00% | 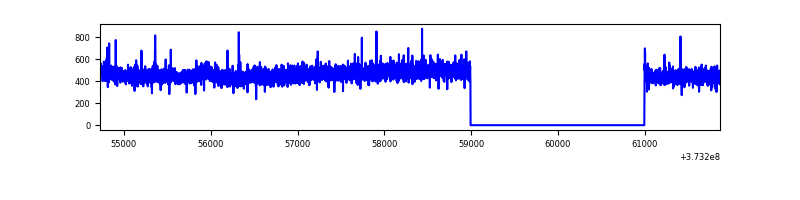 |
| B | 7139 | 5137 | 97 | 97 | 1.36% | 1.89% | 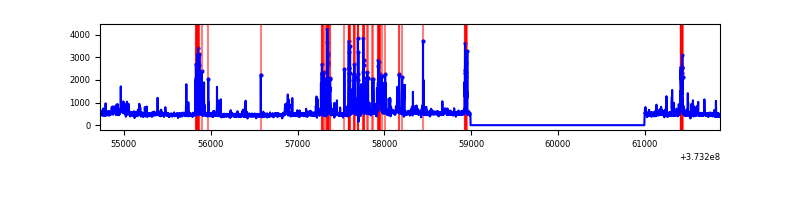 |
| C | 7139 | 5137 | 61 | 61 | 0.85% | 1.19% | 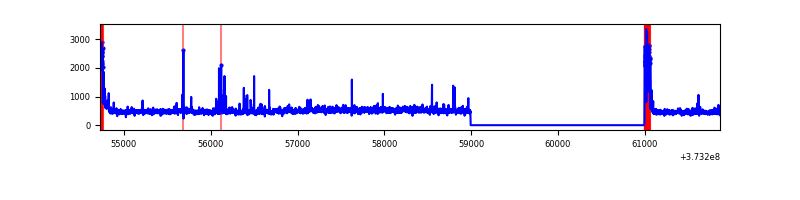 |
| D | 7139 | 5137 | 700 | 700 | 9.81% | 13.63% | 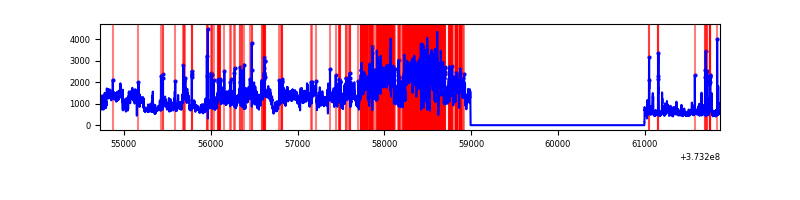 |
Top three noisy pixels from each quadrant. If the there are fewer than three noisy pixels in the level2.evt file, extra rows are filled as -1
| Pixel properties | Quadrant properties | ||||||
|---|---|---|---|---|---|---|---|
| Quadrant | DetID | PixID | Counts | Sigma | Mean | Median | Sigma |
| A | 15 | 169 | 13428 | 106.51 | 604 | 593 | 120.5 |
| A | 13 | 254 | 9841 | 76.75 | 604 | 593 | 120.5 |
| A | 3 | 137 | 5198 | 38.22 | 604 | 593 | 120.5 |
| B | 5 | 172 | 492832 | 4377.88 | 604 | 589 | 112.4 |
| B | 0 | 230 | 54797 | 482.11 | 604 | 589 | 112.4 |
| B | 0 | 219 | 45463 | 399.1 | 604 | 589 | 112.4 |
| C | 0 | 10 | 210443 | 1523.83 | 599 | 604 | 137.7 |
| C | 14 | 67 | 114089 | 824.12 | 599 | 604 | 137.7 |
| C | 3 | 233 | 38378 | 274.31 | 599 | 604 | 137.7 |
| D | 8 | 195 | 2300732 | 15877.2 | 556 | 544 | 144.9 |
| D | 12 | 227 | 1385445 | 9559.37 | 556 | 544 | 144.9 |
| D | 2 | 120 | 281981 | 1942.64 | 556 | 544 | 144.9 |
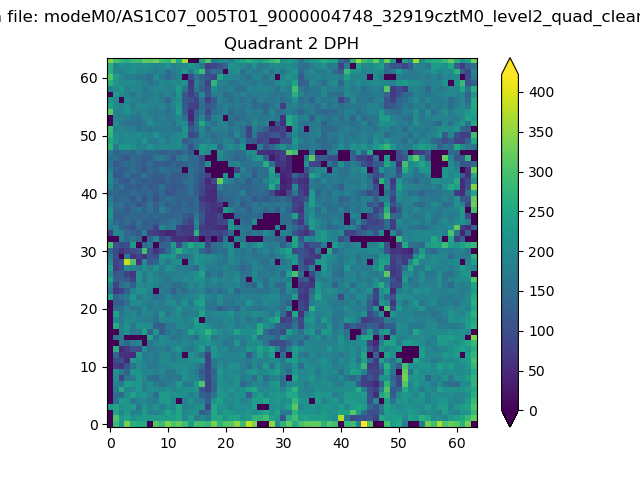
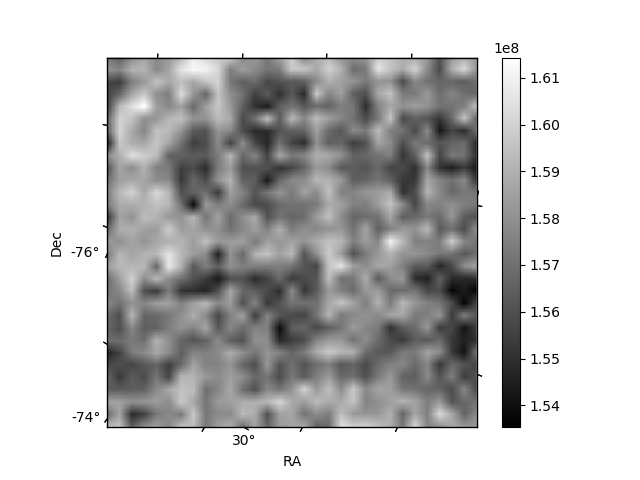
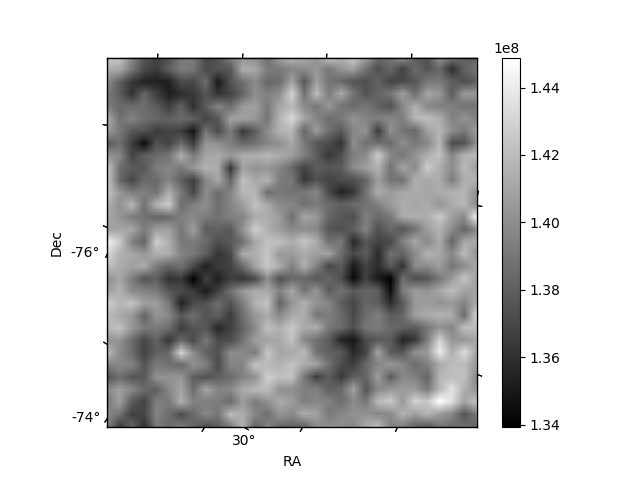
Histogram calculated using DETX and DETY for each event in the final _common_clean file
| Quadrant A | 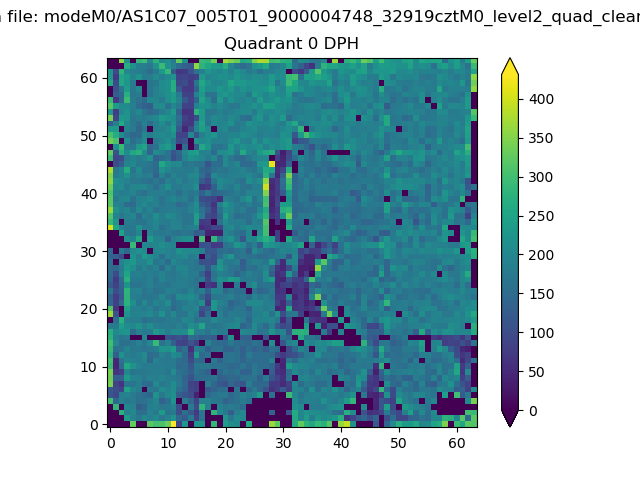 |
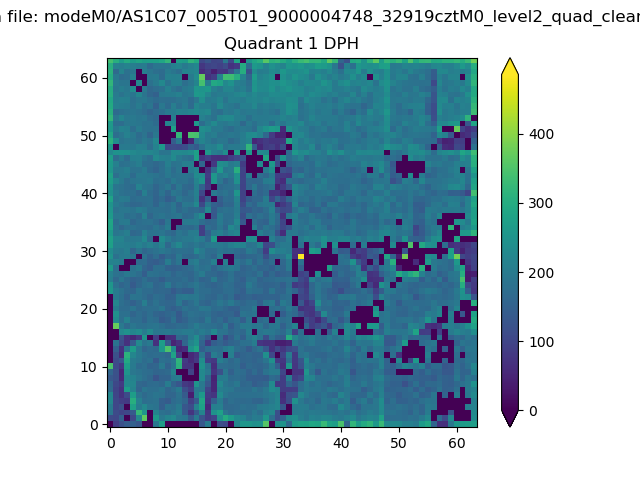 |
Quadrant B |
|---|---|---|---|
| Quadrant D | 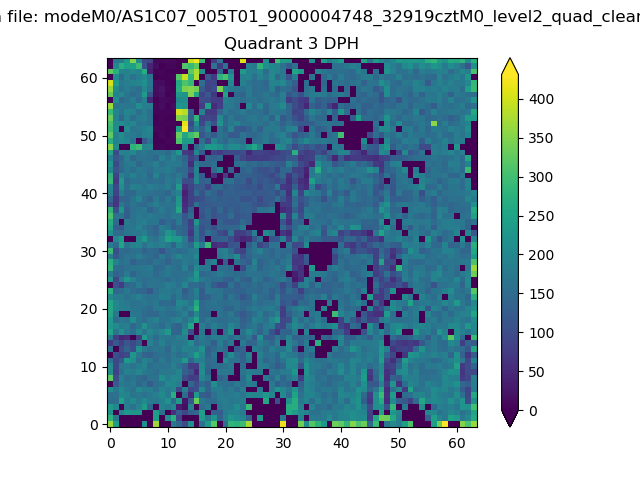 |
 |
Quadrant C |
| Plot type | Count rate plots | Images |
|---|---|---|
| Comparison with Poisson distribution Blue bars denote a histogram of data divided into 1 sec bins. Red curve is a Poisson curve with rate = median count rate of data. |
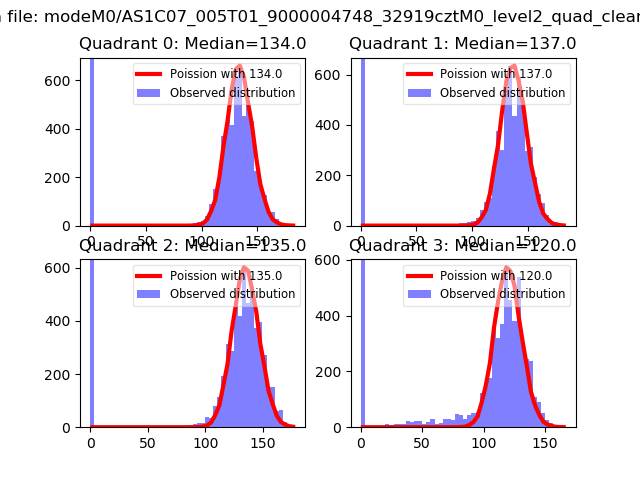 |
 |
| Quadrant-wise count rates Data is divided into 100 sec bins |
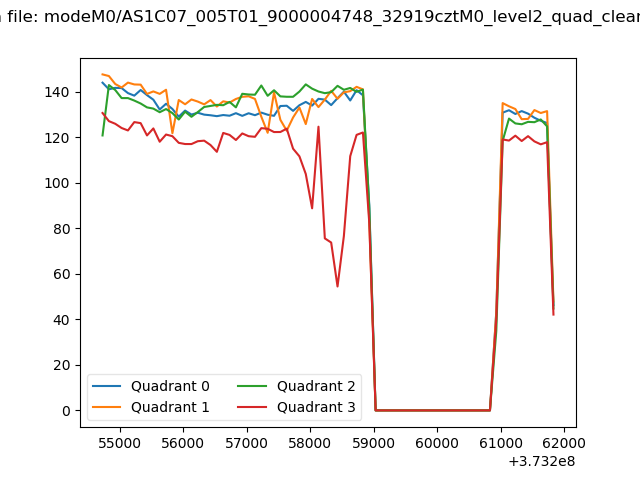 |
|
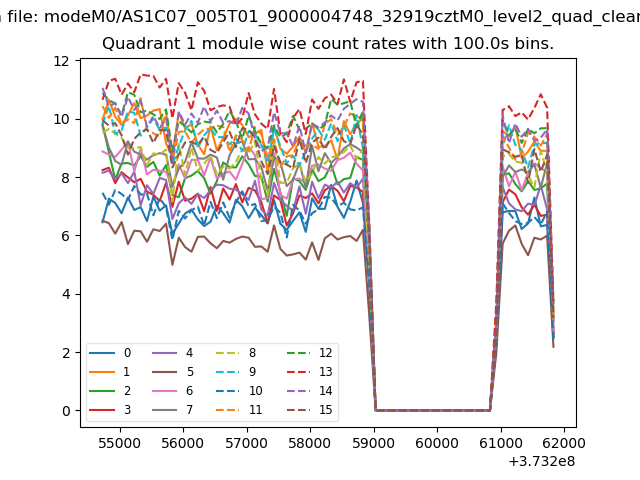
| Module-wise count rates for Quadrant A Data is divided into 100 sec bins |
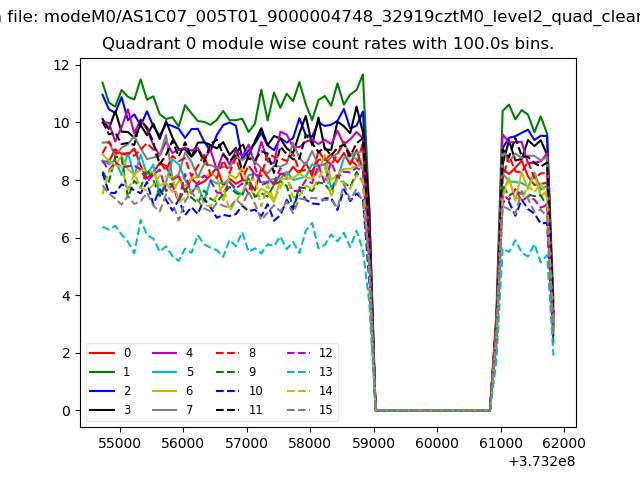 |
 |
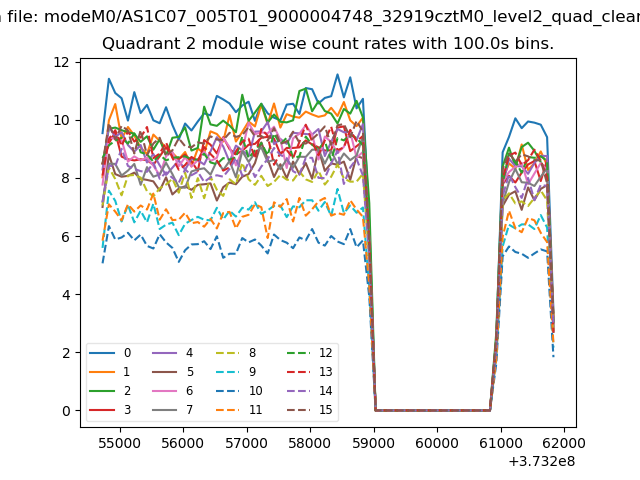
| Module-wise count rates for Quadrant B Data is divided into 100 sec bins |
 |
 |
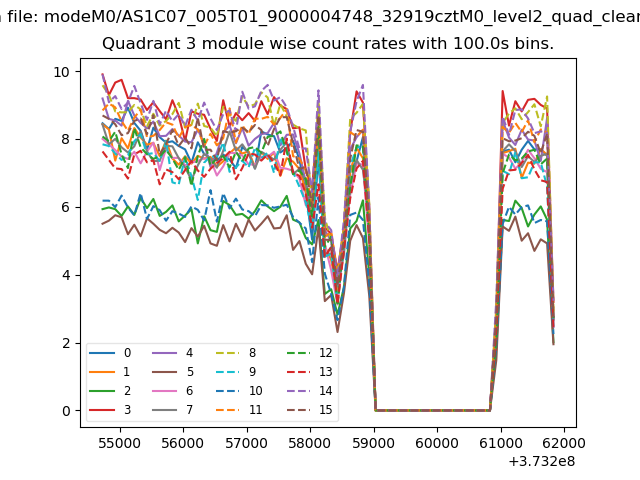
| Module-wise count rates for Quadrant C Data is divided into 100 sec bins |
 |
 |
| Module-wise count rates for Quadrant D Data is divided into 100 sec bins |
 |
 |
| Parameter | Plot |
|---|---|
| CZT HV Monitor | 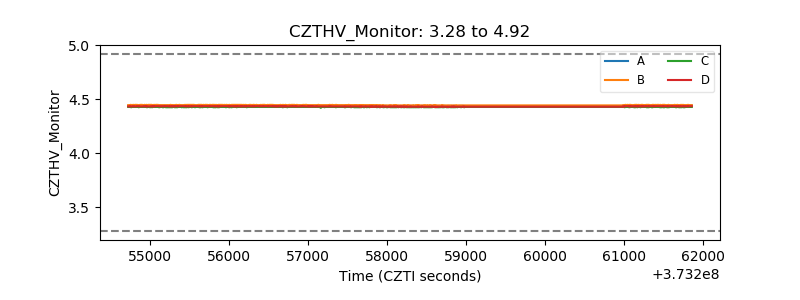 |
| D_VDD | 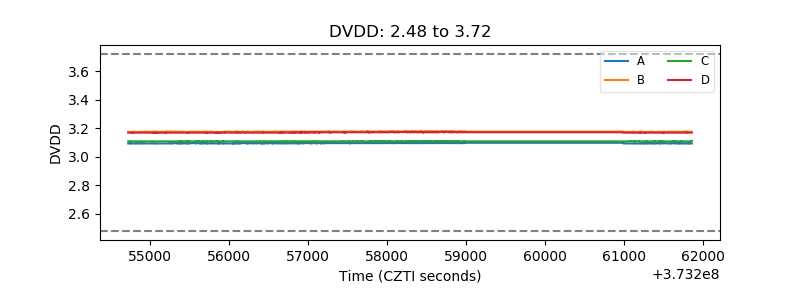 |
| Temperature 1 | 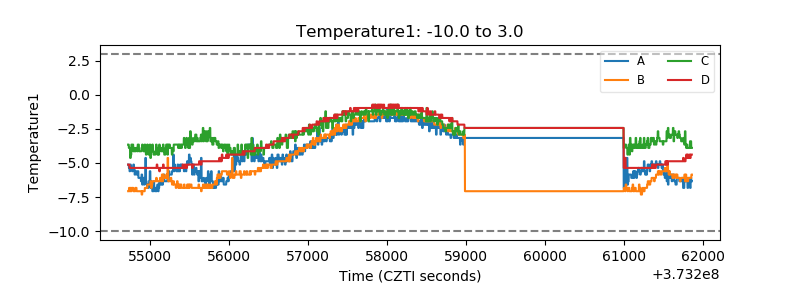 |
| Veto HV Monitor | 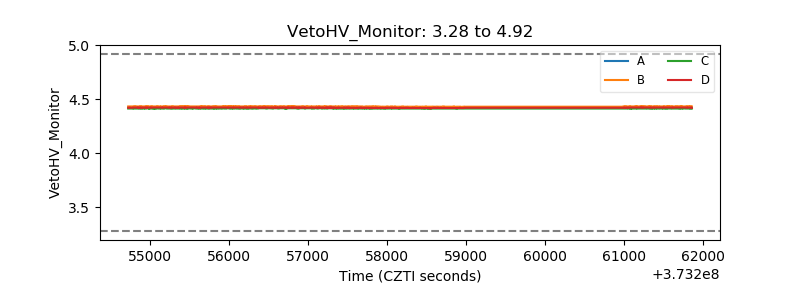 |
| Veto LLD | 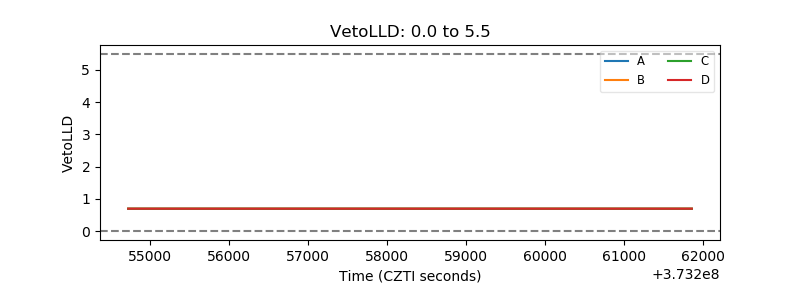 |
| Alpha Counter | 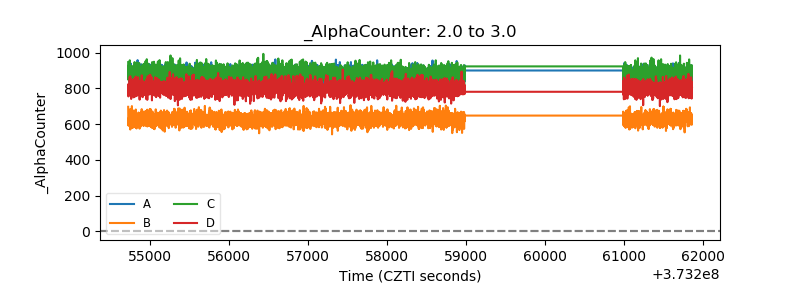 |
| _CPM_Rate | 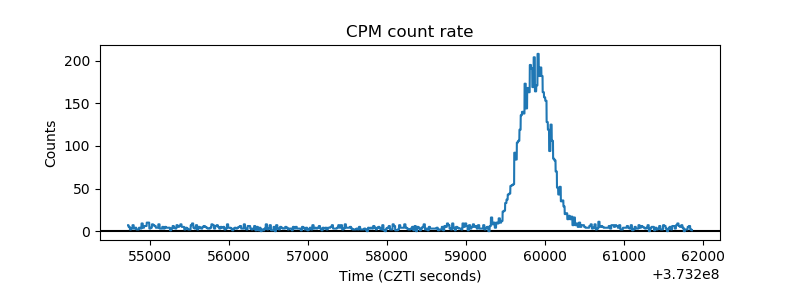 |
| CZT Counter | 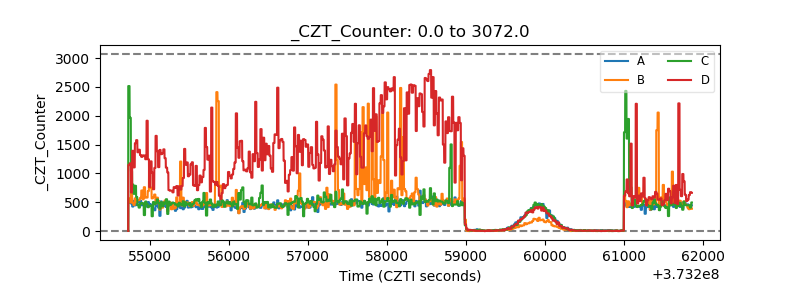 |
| +2.5 Volts monitor |  |
| +5 Volts monitor |  |
| _ROLL_ROT | 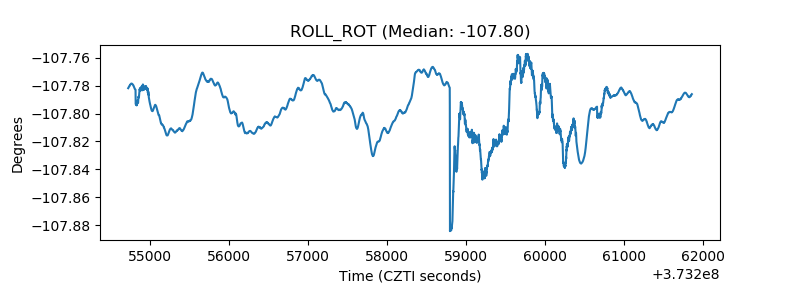 |
| _Roll_DEC | 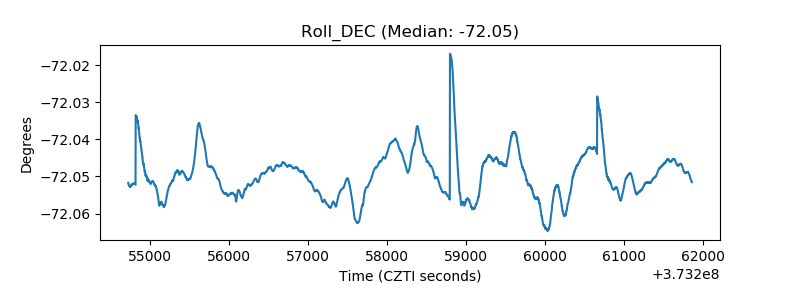 |
| _Roll_RA | 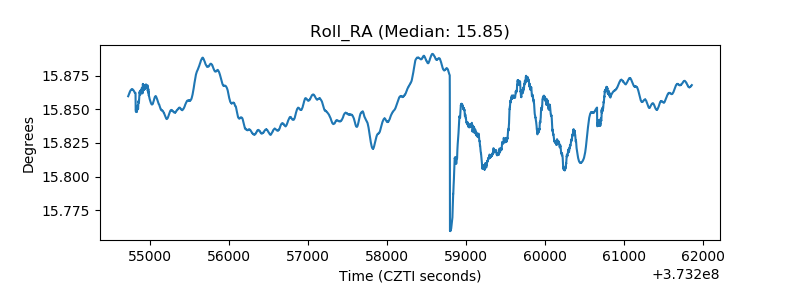 |
| Veto Counter | 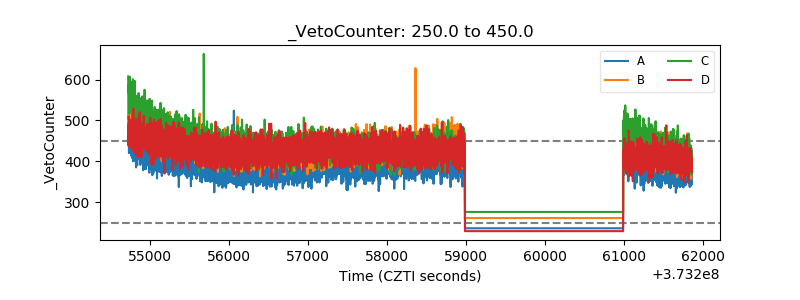 |