| Param | Original file | Final file |
|---|---|---|
| Filename | modeM0/AS1C07_005T01_9000004748_32921cztM0_level2.evt | modeM0/AS1C07_005T01_9000004748_32921cztM0_level2_quad_clean.evt |
| Size (bytes) | 547,813,440 | 107,377,920 |
| Size | 522.4 MB | 102.4 MB |
| Events in quadrant A | 2,891,963 | 721,413 |
| Events in quadrant B | 3,386,362 | 728,969 |
| Events in quadrant C | 2,922,932 | 735,582 |
| Events in quadrant D | 6,996,156 | 659,913 |
| Mode SS | |||
|---|---|---|---|
| Quadrant | BADHDUFLAG | Total packets | Discarded packets |
| A | 0 | 118 | 0 |
| B | 0 | 118 | 0 |
| C | 0 | 118 | 0 |
| D | 0 | 118 | 0 |
| Mode M9 | |||
|---|---|---|---|
| Quadrant | BADHDUFLAG | Total packets | Discarded packets |
| A | 0 | 20 | 0 |
| B | 0 | 20 | 0 |
| C | 0 | 20 | 0 |
| D | 0 | 21 | 0 |
| Mode M0 | |||
|---|---|---|---|
| Quadrant | BADHDUFLAG | Total packets | Discarded packets |
| A | 0 | 12460 | 3 |
| B | 0 | 13779 | 2 |
| C | 0 | 12388 | 2 |
| D | 0 | 25038 | 2 |
| Quadrant | Total seconds | Saturated seconds | Saturation percentage |
|---|---|---|---|
| A | 5808 | 49 | 0.843664% |
| B | 5808 | 202 | 3.477961% |
| C | 5808 | 58 | 0.998623% |
| D | 5808 | 569 | 9.796832% |
Noise dominated data is calculated using 1-second bins in cleaned event files. If a bin has >2000 counts, and if more than 50% of those come from <1% of pixels, then it is considered to be noise-dominated and hence unusable.
| Quadrant | # 1 sec bins | Bins with >0 counts | Bins with >2000 counts | High rate bins dominated by noise | Noise dominated (total time) | Noise dominated (detector-on time) | Marked lightcurve |
|---|---|---|---|---|---|---|---|
| A | 7182 | 5809 | 40 | 40 | 0.56% | 0.69% | 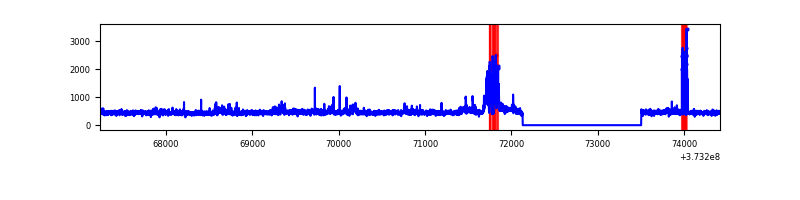 |
| B | 7182 | 5809 | 134 | 134 | 1.87% | 2.31% | 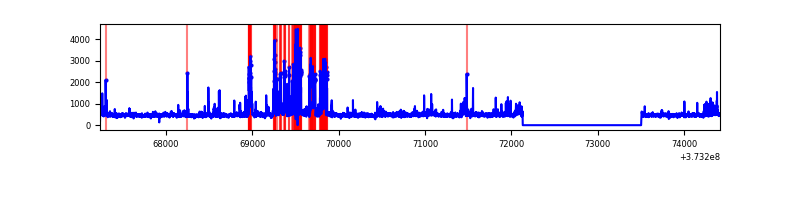 |
| C | 7182 | 5809 | 39 | 39 | 0.54% | 0.67% | 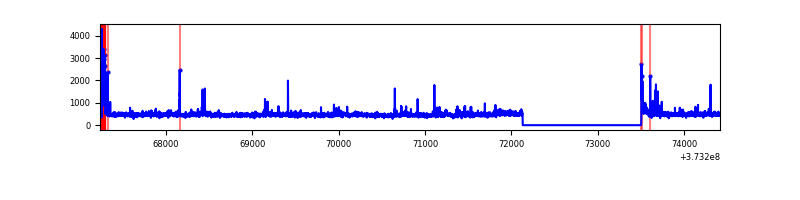 |
| D | 7182 | 5809 | 660 | 660 | 9.19% | 11.36% | 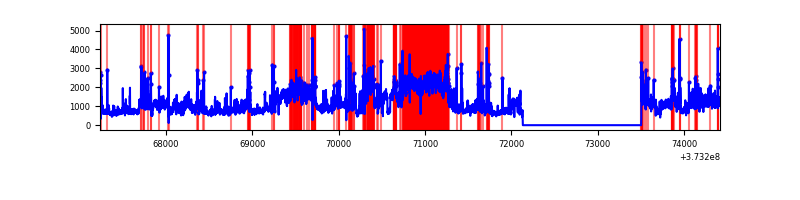 |
Top three noisy pixels from each quadrant. If the there are fewer than three noisy pixels in the level2.evt file, extra rows are filled as -1
| Pixel properties | Quadrant properties | ||||||
|---|---|---|---|---|---|---|---|
| Quadrant | DetID | PixID | Counts | Sigma | Mean | Median | Sigma |
| A | 11 | 29 | 161699 | 1205.77 | 665 | 650 | 133.6 |
| A | 0 | 143 | 135615 | 1010.48 | 665 | 650 | 133.6 |
| A | 13 | 254 | 11101 | 78.25 | 665 | 650 | 133.6 |
| B | 5 | 172 | 582275 | 4621.64 | 660 | 643 | 125.8 |
| B | 0 | 199 | 64762 | 509.49 | 660 | 643 | 125.8 |
| B | 4 | 81 | 29160 | 226.6 | 660 | 643 | 125.8 |
| C | 0 | 10 | 149616 | 994.15 | 651 | 655 | 149.8 |
| C | 14 | 67 | 113839 | 755.38 | 651 | 655 | 149.8 |
| C | 4 | 254 | 46411 | 305.37 | 651 | 655 | 149.8 |
| D | 8 | 195 | 3205017 | 19504.05 | 630 | 615 | 164.3 |
| D | 7 | 80 | 282120 | 1713.42 | 630 | 615 | 164.3 |
| D | 12 | 227 | 270361 | 1641.85 | 630 | 615 | 164.3 |
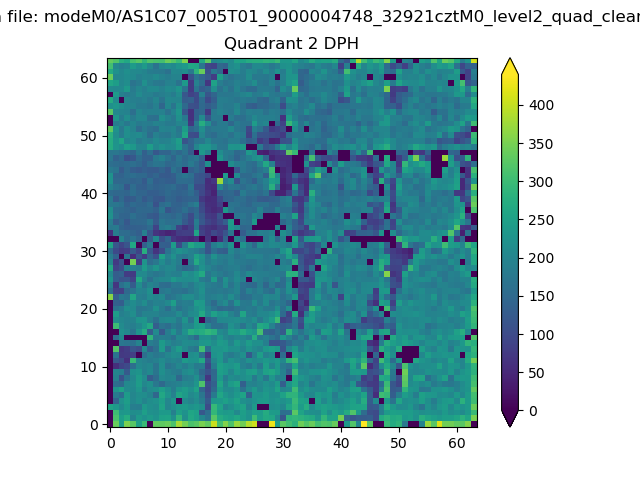
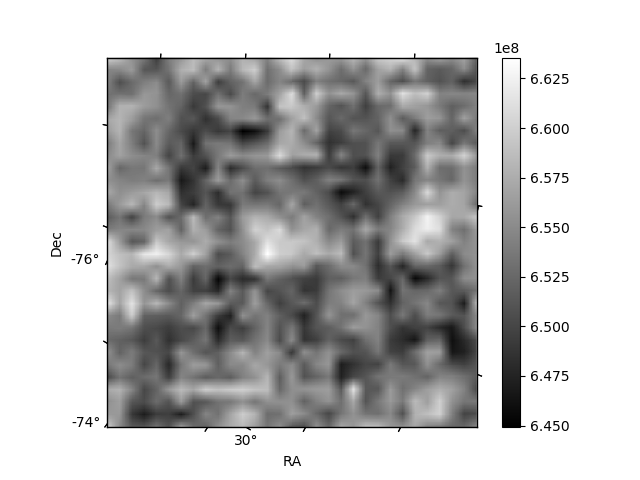
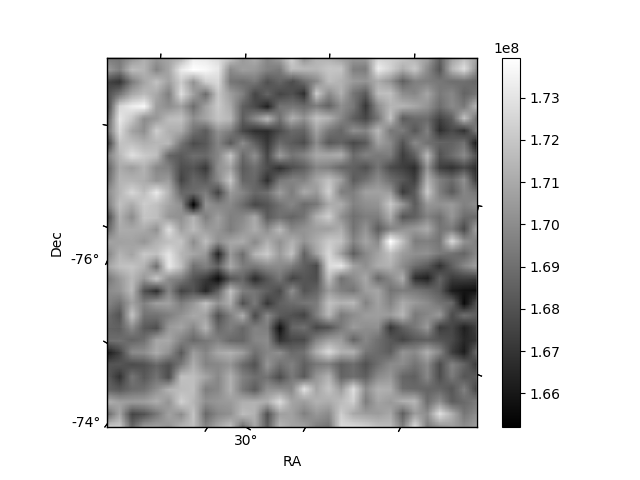
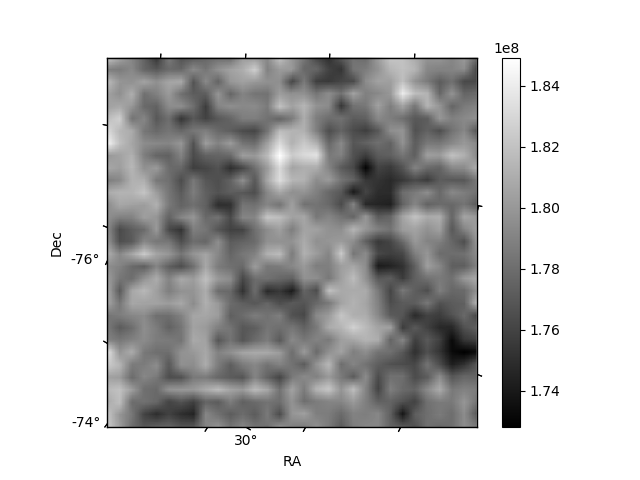
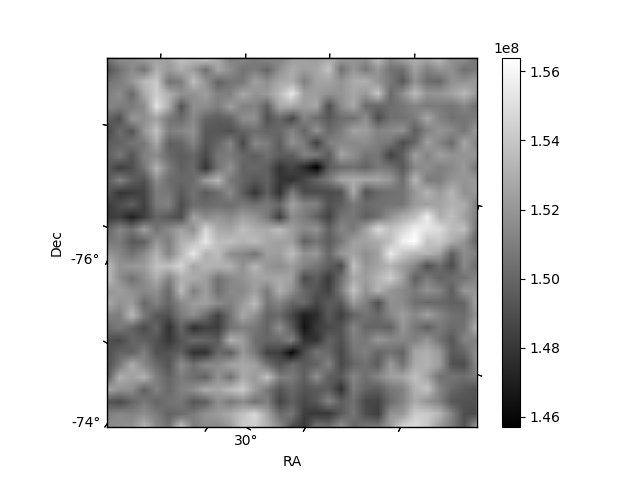
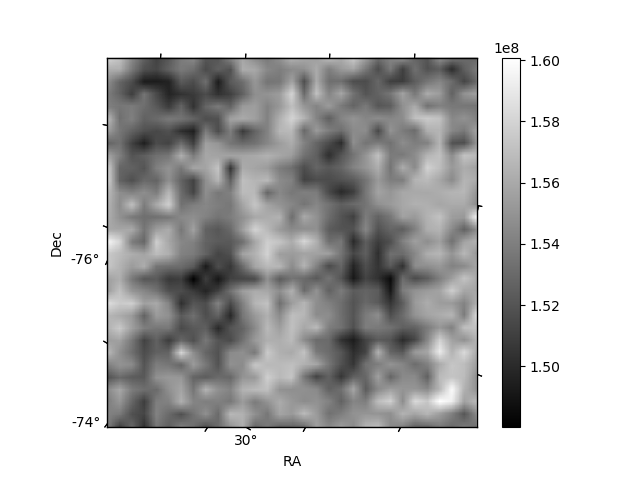
Histogram calculated using DETX and DETY for each event in the final _common_clean file
| Quadrant A | 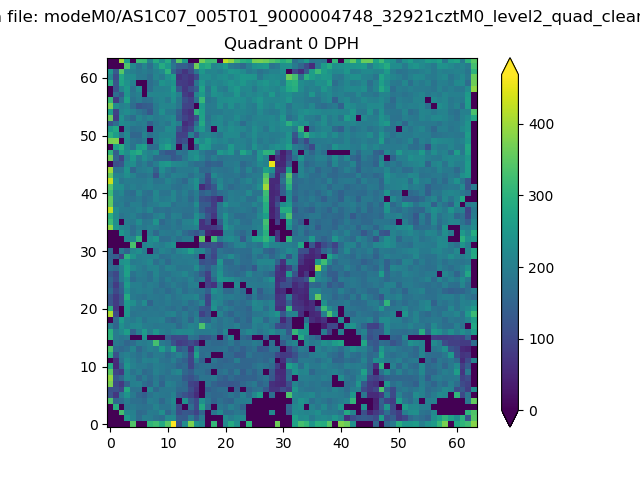 |
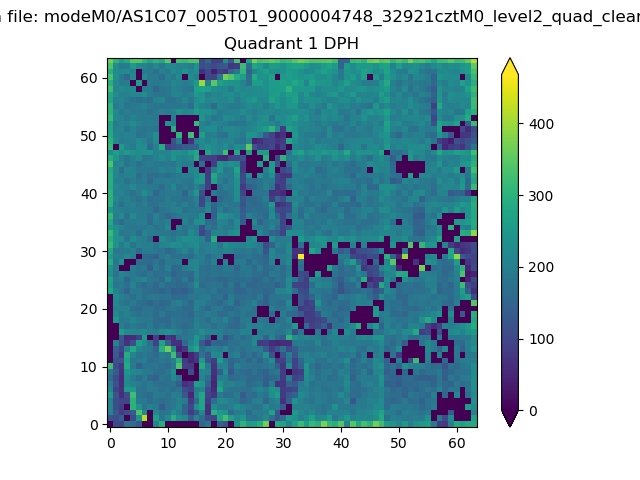 |
Quadrant B |
|---|---|---|---|
| Quadrant D | 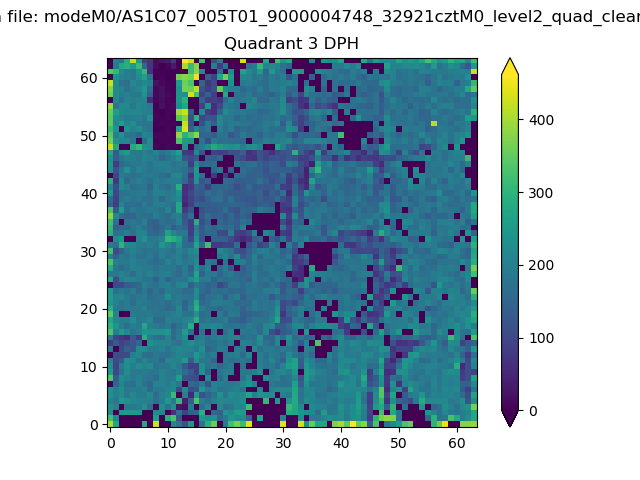 |
 |
Quadrant C |
| Plot type | Count rate plots | Images |
|---|---|---|
| Comparison with Poisson distribution Blue bars denote a histogram of data divided into 1 sec bins. Red curve is a Poisson curve with rate = median count rate of data. |
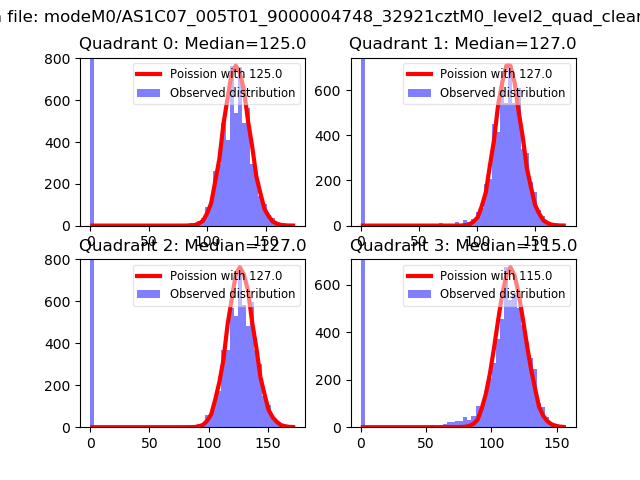 |
 |
| Quadrant-wise count rates Data is divided into 100 sec bins |
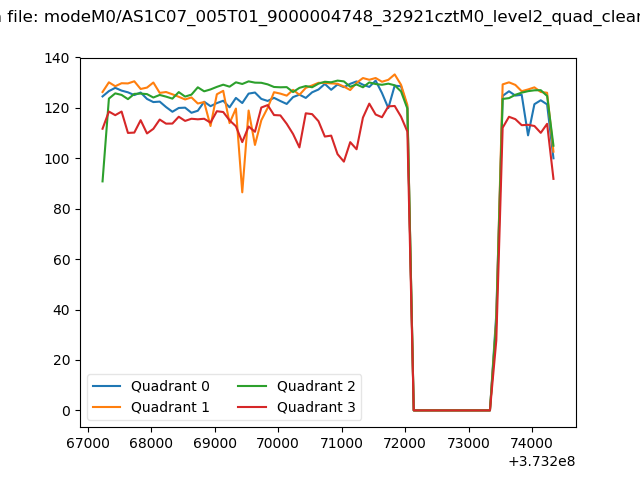 |
|
| Module-wise count rates for Quadrant A Data is divided into 100 sec bins |
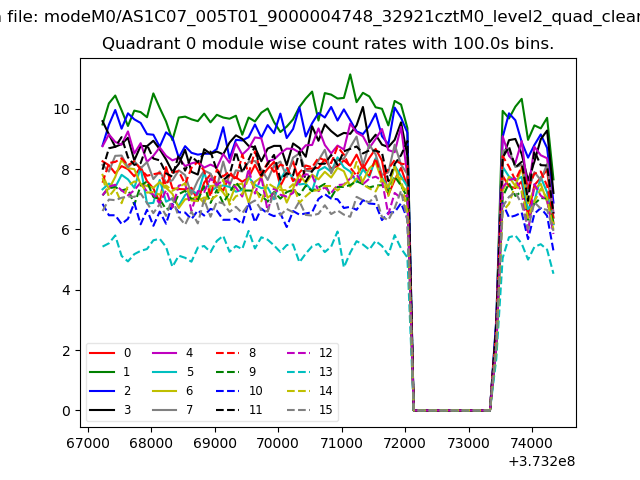 |
 |
| Module-wise count rates for Quadrant B Data is divided into 100 sec bins |
 |
 |
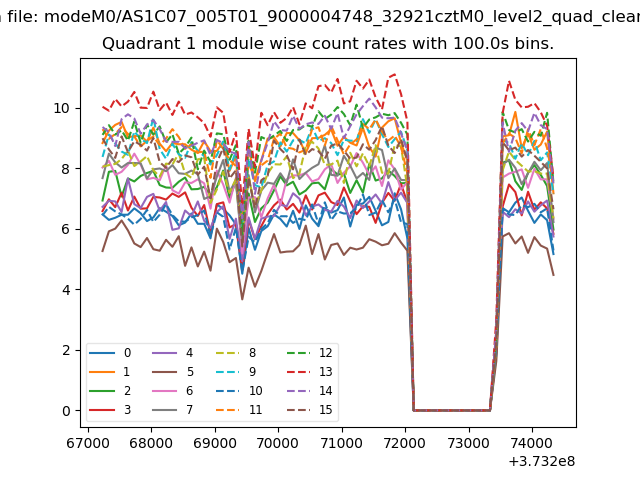
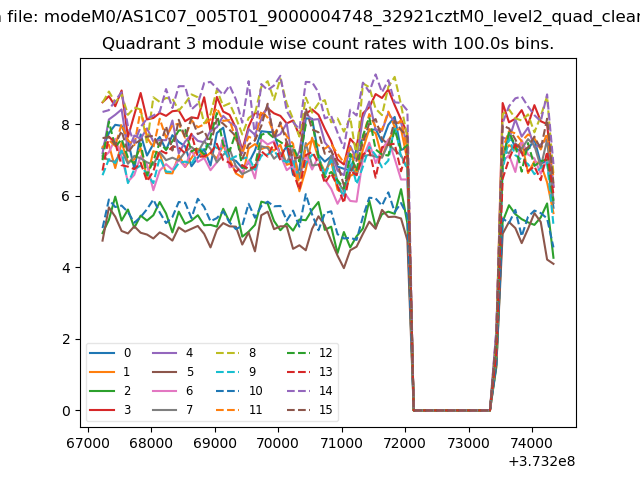
| Module-wise count rates for Quadrant C Data is divided into 100 sec bins |
 |
 |
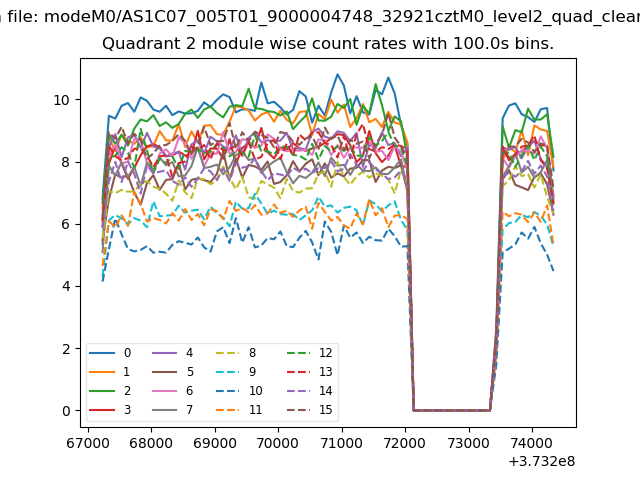
| Module-wise count rates for Quadrant D Data is divided into 100 sec bins |
 |
 |
| Parameter | Plot |
|---|---|
| CZT HV Monitor | 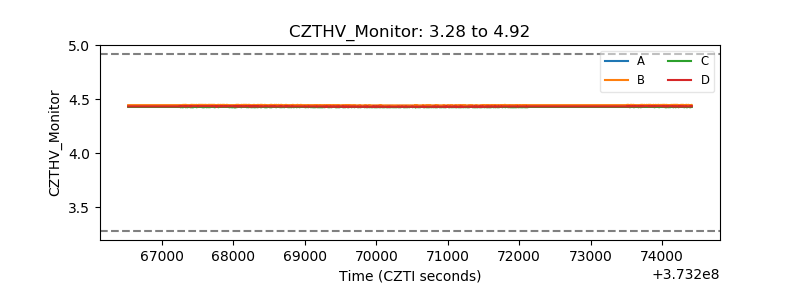 |
| D_VDD | 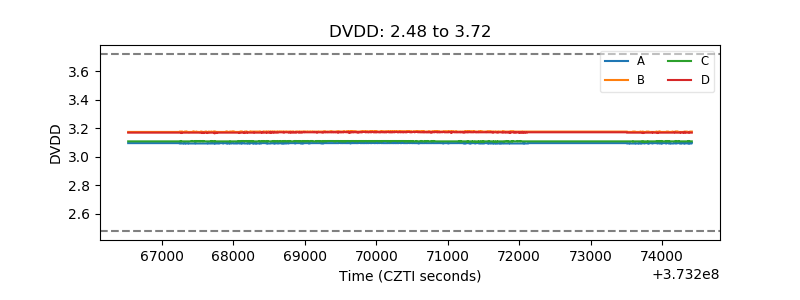 |
| Temperature 1 | 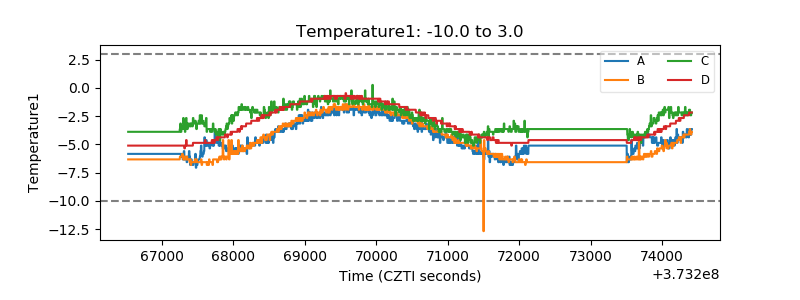 |
| Veto HV Monitor | 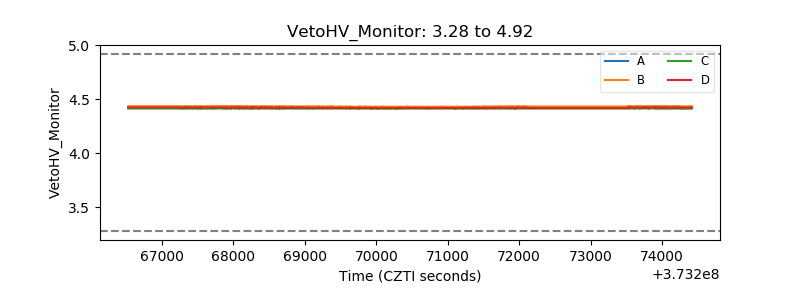 |
| Veto LLD | 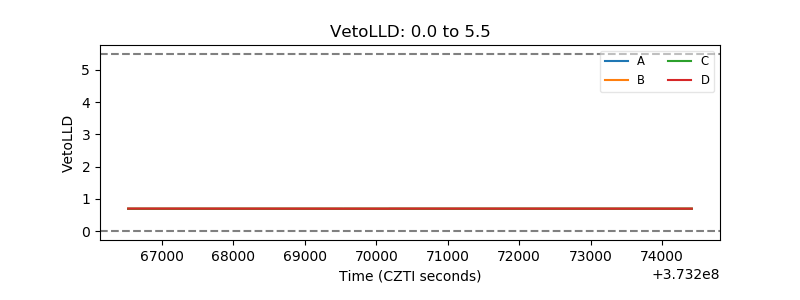 |
| Alpha Counter | 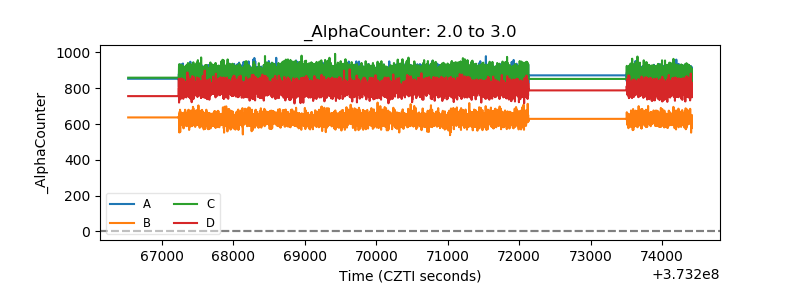 |
| _CPM_Rate | 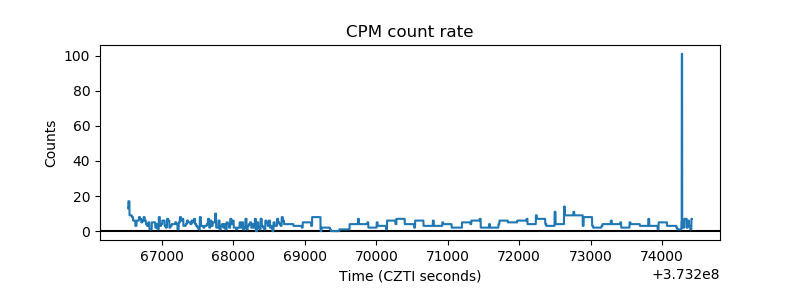 |
| CZT Counter | 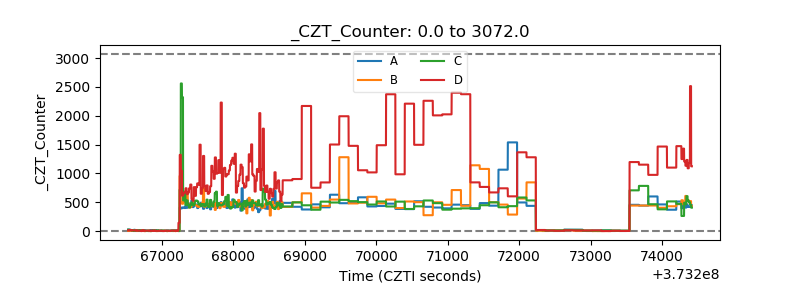 |
| +2.5 Volts monitor |  |
| +5 Volts monitor |  |
| _ROLL_ROT | 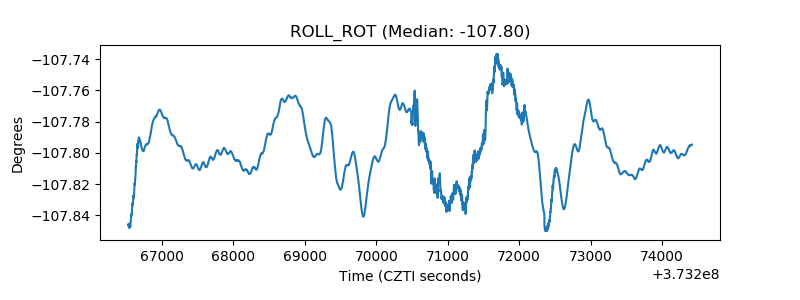 |
| _Roll_DEC | 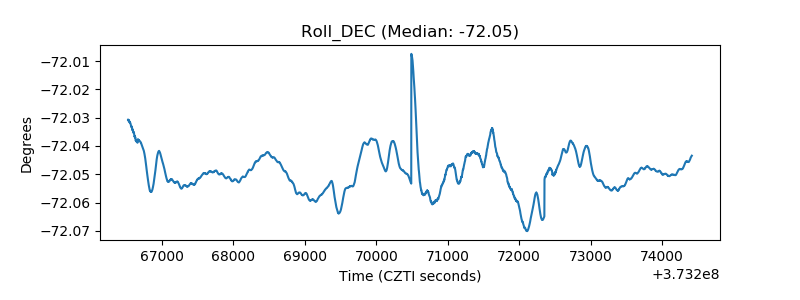 |
| _Roll_RA | 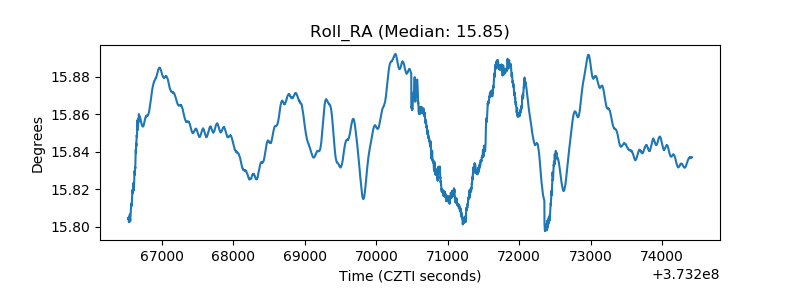 |
| Veto Counter | 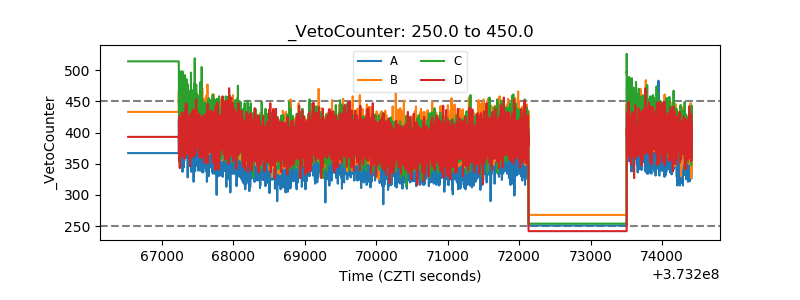 |