| Param | Original file | Final file |
|---|---|---|
| Filename | modeM0/AS1C07_005T01_9000004748_32926cztM0_level2.evt | modeM0/AS1C07_005T01_9000004748_32926cztM0_level2_quad_clean.evt |
| Size (bytes) | 561,467,520 | 103,763,520 |
| Size | 535.5 MB | 99.0 MB |
| Events in quadrant A | 2,539,198 | 714,481 |
| Events in quadrant B | 3,305,389 | 713,191 |
| Events in quadrant C | 2,781,174 | 706,647 |
| Events in quadrant D | 8,001,065 | 617,755 |
| Mode SS | |||
|---|---|---|---|
| Quadrant | BADHDUFLAG | Total packets | Discarded packets |
| A | 0 | 112 | 0 |
| B | 0 | 112 | 0 |
| C | 0 | 112 | 0 |
| D | 0 | 112 | 0 |
| Mode M9 | |||
|---|---|---|---|
| Quadrant | BADHDUFLAG | Total packets | Discarded packets |
| A | 0 | 17 | 0 |
| B | 0 | 17 | 0 |
| C | 0 | 17 | 0 |
| D | 0 | 17 | 0 |
| Mode M0 | |||
|---|---|---|---|
| Quadrant | BADHDUFLAG | Total packets | Discarded packets |
| A | 0 | 11317 | 2 |
| B | 0 | 13498 | 1 |
| C | 0 | 11945 | 1 |
| D | 0 | 27703 | 1 |
| Quadrant | Total seconds | Saturated seconds | Saturation percentage |
|---|---|---|---|
| A | 5583 | 12 | 0.214938% |
| B | 5583 | 131 | 2.346409% |
| C | 5583 | 26 | 0.465699% |
| D | 5583 | 892 | 15.977073% |
Noise dominated data is calculated using 1-second bins in cleaned event files. If a bin has >2000 counts, and if more than 50% of those come from <1% of pixels, then it is considered to be noise-dominated and hence unusable.
| Quadrant | # 1 sec bins | Bins with >0 counts | Bins with >2000 counts | High rate bins dominated by noise | Noise dominated (total time) | Noise dominated (detector-on time) | Marked lightcurve |
|---|---|---|---|---|---|---|---|
| A | 7225 | 5584 | 4 | 4 | 0.06% | 0.07% | 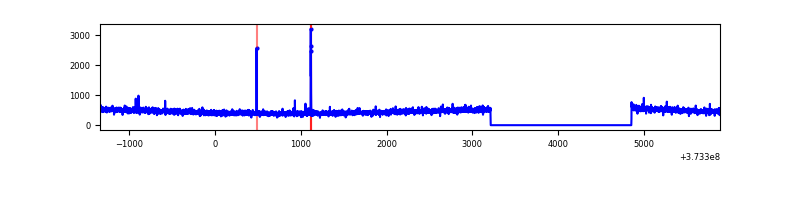 |
| B | 7225 | 5584 | 84 | 84 | 1.16% | 1.50% | 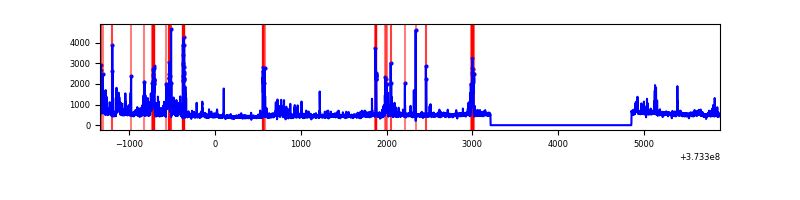 |
| C | 7225 | 5584 | 18 | 18 | 0.25% | 0.32% | 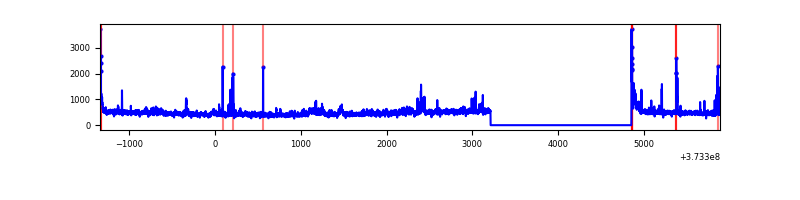 |
| D | 7225 | 5584 | 1001 | 1001 | 13.85% | 17.93% | 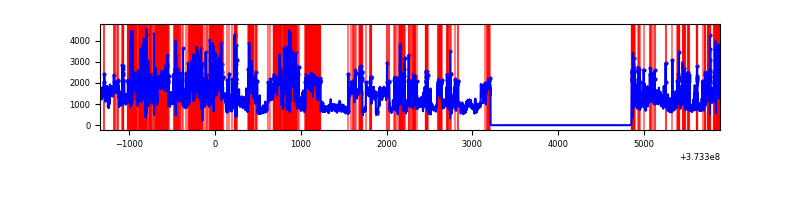 |
Top three noisy pixels from each quadrant. If the there are fewer than three noisy pixels in the level2.evt file, extra rows are filled as -1
| Pixel properties | Quadrant properties | ||||||
|---|---|---|---|---|---|---|---|
| Quadrant | DetID | PixID | Counts | Sigma | Mean | Median | Sigma |
| A | 13 | 6 | 16525 | 120.41 | 647 | 633 | 132.0 |
| A | 10 | 248 | 12967 | 93.45 | 647 | 633 | 132.0 |
| A | 13 | 254 | 9966 | 70.71 | 647 | 633 | 132.0 |
| B | 5 | 172 | 259552 | 2108.72 | 645 | 629 | 122.8 |
| B | 0 | 199 | 125041 | 1013.24 | 645 | 629 | 122.8 |
| B | 10 | 246 | 106124 | 859.17 | 645 | 629 | 122.8 |
| C | 3 | 233 | 91836 | 630.39 | 625 | 629 | 144.7 |
| C | 0 | 10 | 86724 | 595.06 | 625 | 629 | 144.7 |
| C | 14 | 67 | 64026 | 438.18 | 625 | 629 | 144.7 |
| D | 8 | 195 | 3485244 | 23044.82 | 588 | 575 | 151.2 |
| D | 7 | 80 | 1091263 | 7212.94 | 588 | 575 | 151.2 |
| D | 10 | 203 | 269457 | 1778.17 | 588 | 575 | 151.2 |
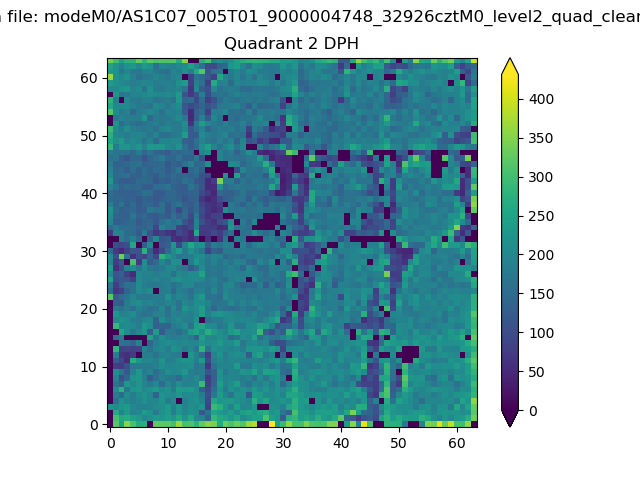
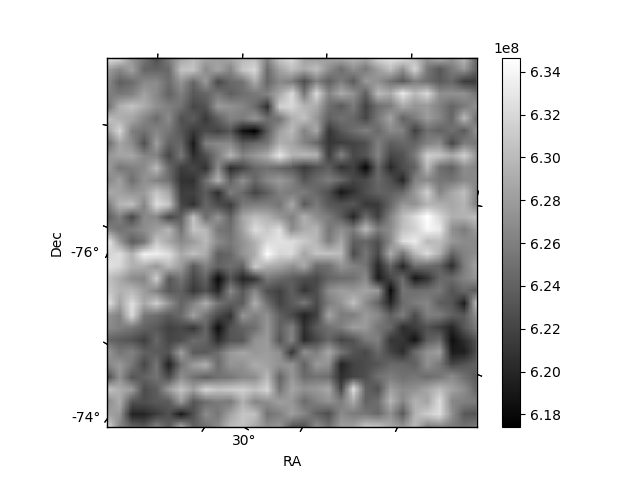
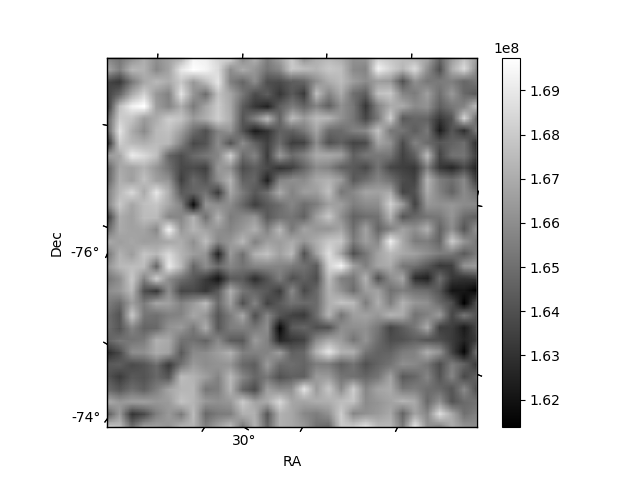
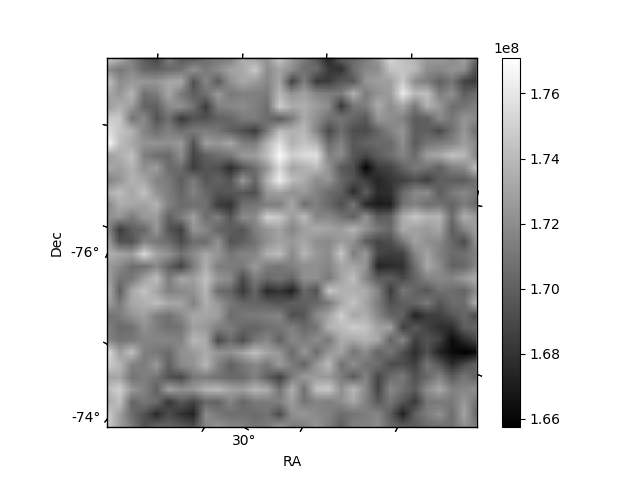
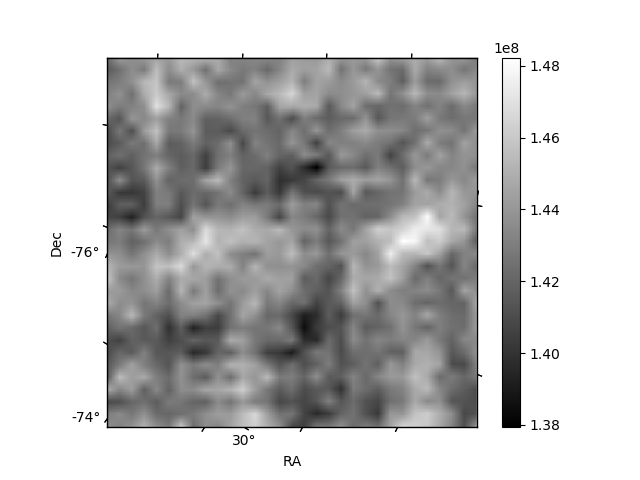
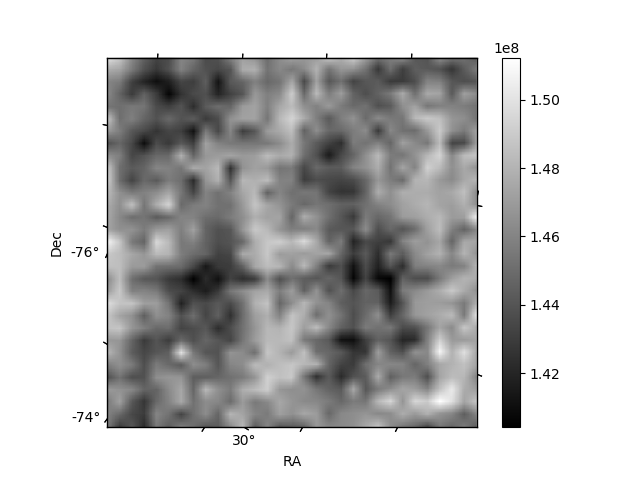
Histogram calculated using DETX and DETY for each event in the final _common_clean file
| Quadrant A | 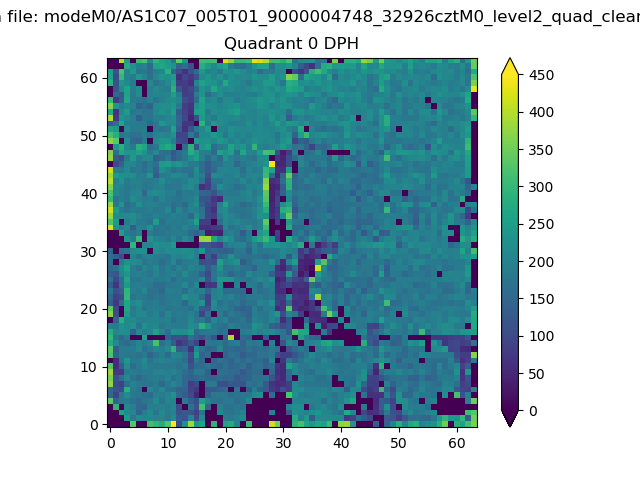 |
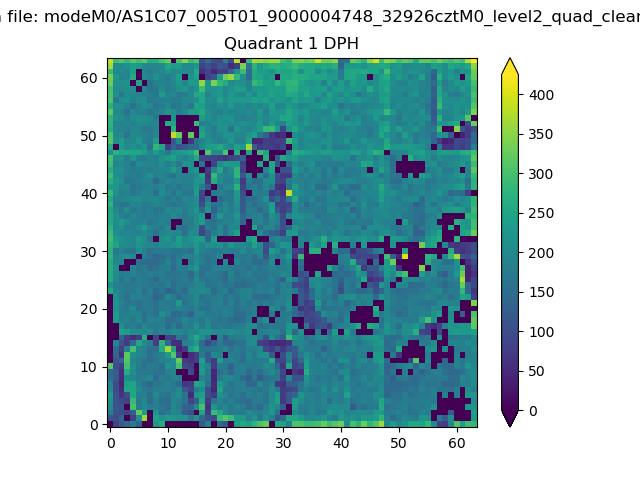 |
Quadrant B |
|---|---|---|---|
| Quadrant D | 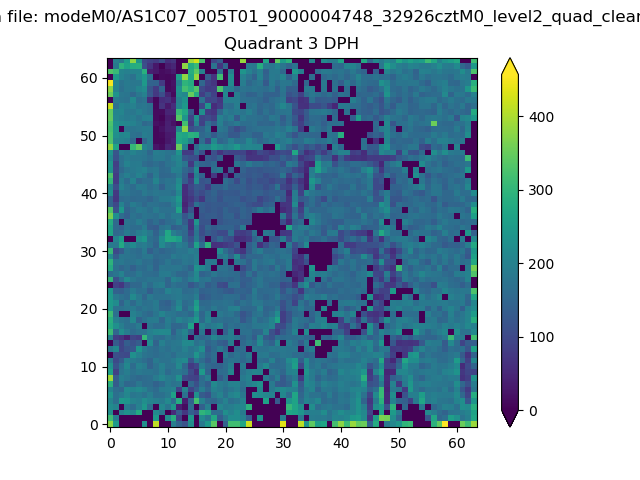 |
 |
Quadrant C |
| Plot type | Count rate plots | Images |
|---|---|---|
| Comparison with Poisson distribution Blue bars denote a histogram of data divided into 1 sec bins. Red curve is a Poisson curve with rate = median count rate of data. |
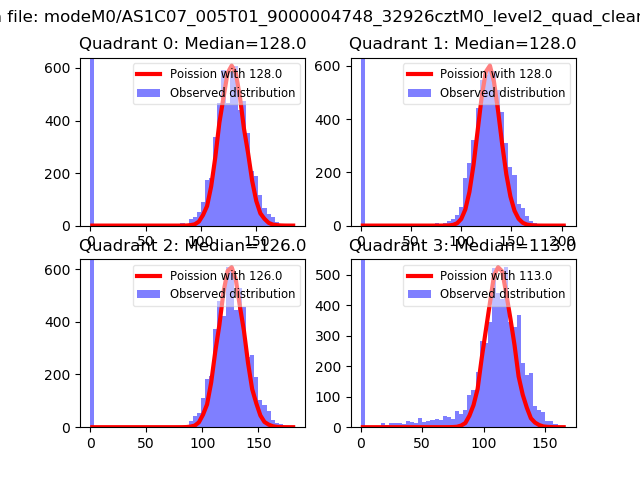 |
 |
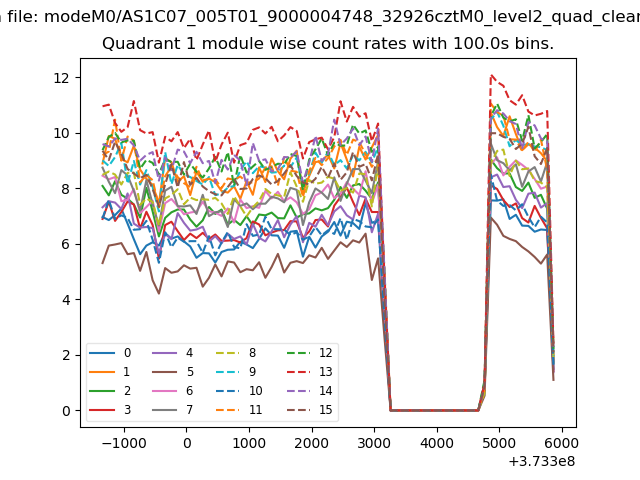
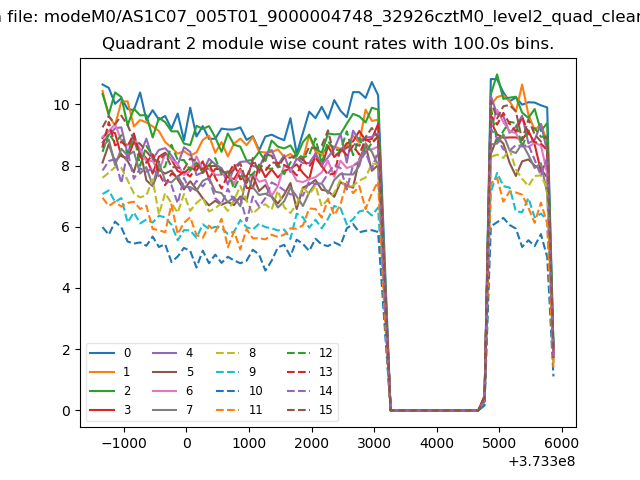
| Quadrant-wise count rates Data is divided into 100 sec bins |
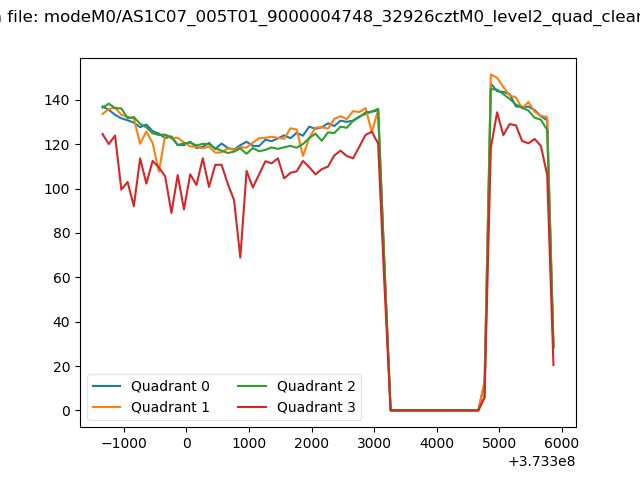 |
|
| Module-wise count rates for Quadrant A Data is divided into 100 sec bins |
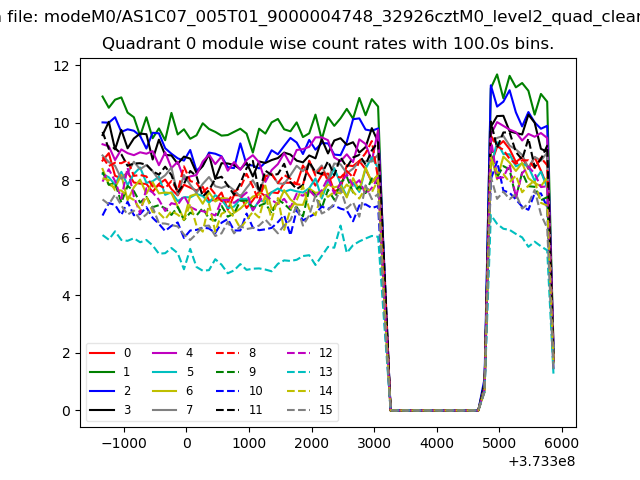 |
 |
| Module-wise count rates for Quadrant B Data is divided into 100 sec bins |
 |
 |
| Module-wise count rates for Quadrant C Data is divided into 100 sec bins |
 |
 |
| Module-wise count rates for Quadrant D Data is divided into 100 sec bins |
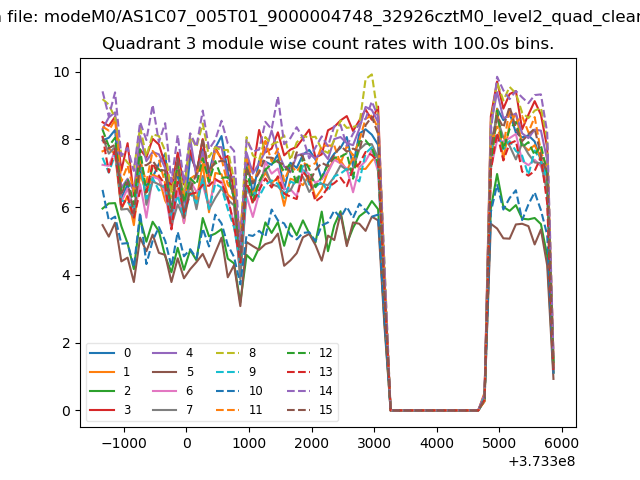 |
 |
| Parameter | Plot |
|---|---|
| CZT HV Monitor | 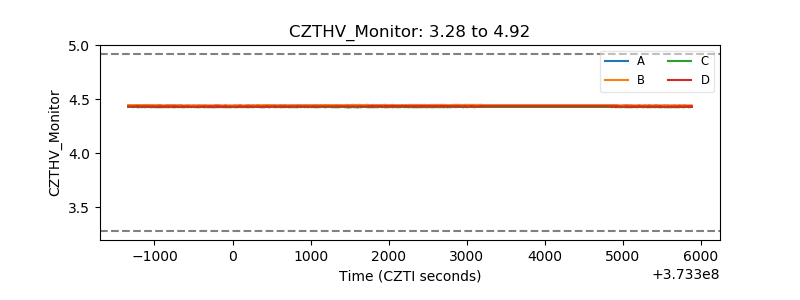 |
| D_VDD | 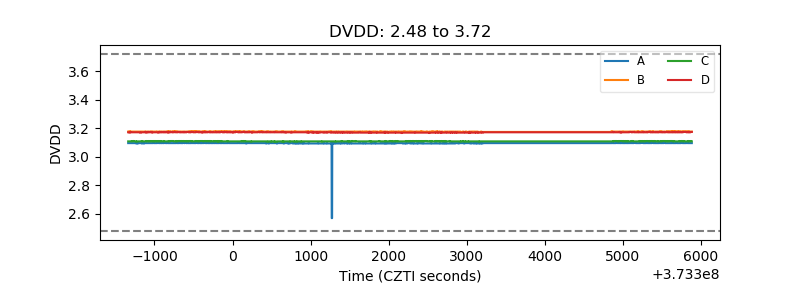 |
| Temperature 1 | 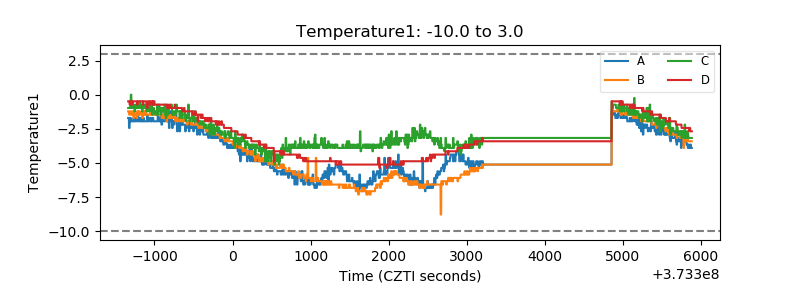 |
| Veto HV Monitor | 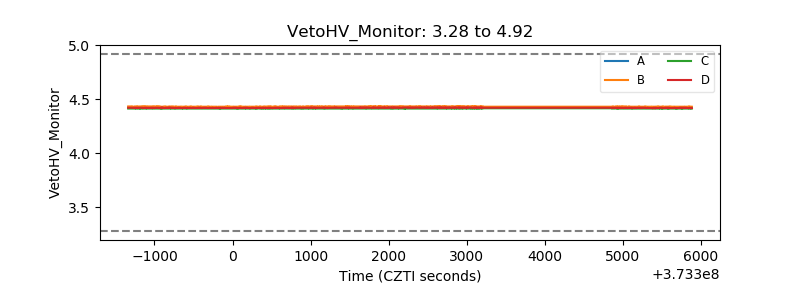 |
| Veto LLD | 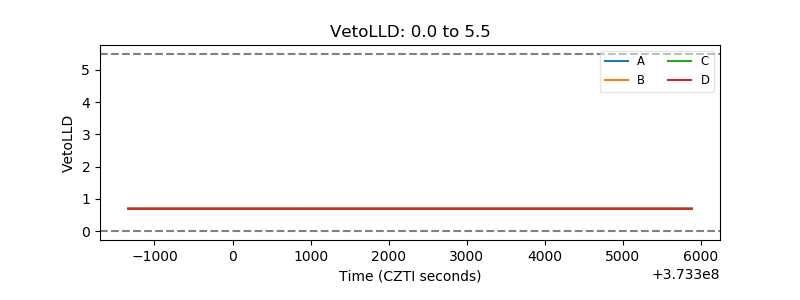 |
| Alpha Counter | 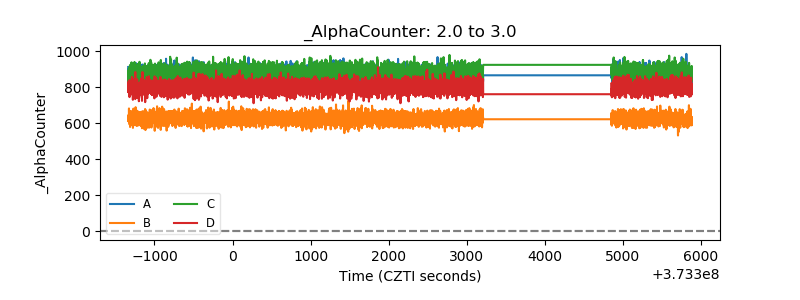 |
| _CPM_Rate | 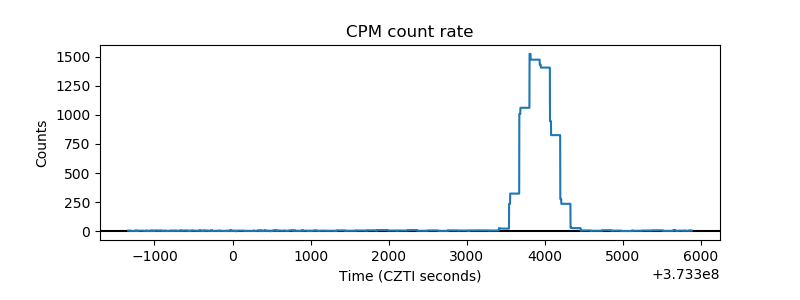 |
| CZT Counter | 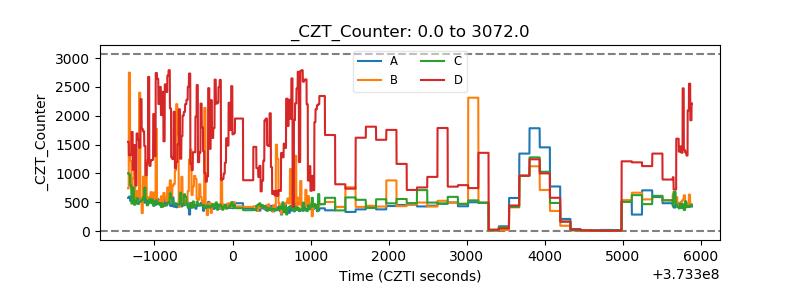 |
| +2.5 Volts monitor |  |
| +5 Volts monitor |  |
| _ROLL_ROT | 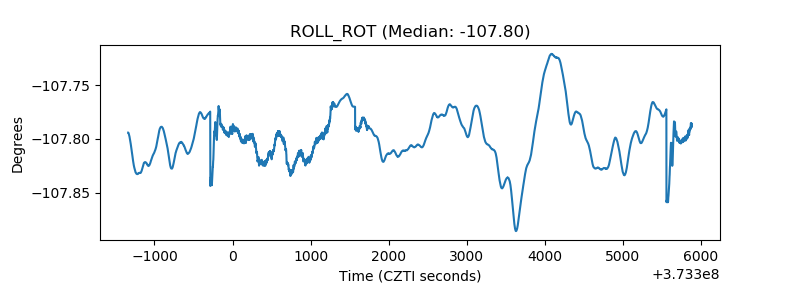 |
| _Roll_DEC | 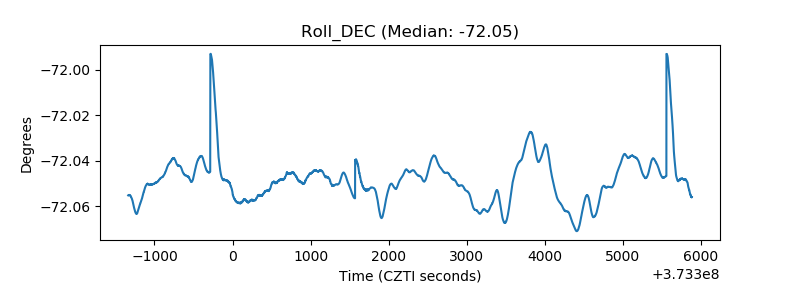 |
| _Roll_RA | 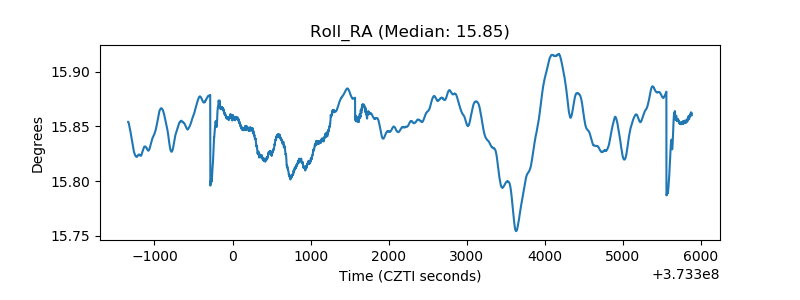 |
| Veto Counter | 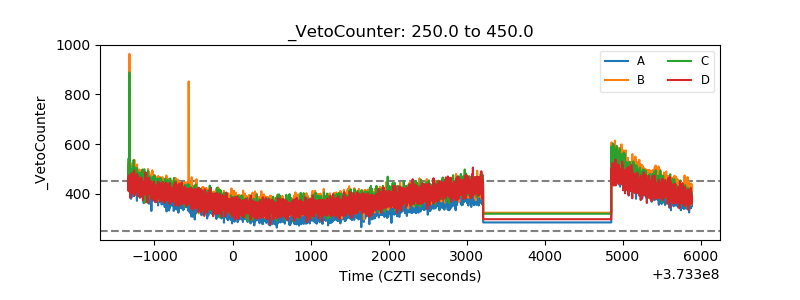 |