| Param | Original file | Final file |
|---|---|---|
| Filename | modeM0/AS1C07_005T01_9000004748_32928cztM0_level2.evt | modeM0/AS1C07_005T01_9000004748_32928cztM0_level2_quad_clean.evt |
| Size (bytes) | 530,994,240 | 102,170,880 |
| Size | 506.4 MB | 97.4 MB |
| Events in quadrant A | 2,463,618 | 711,219 |
| Events in quadrant B | 3,349,344 | 705,812 |
| Events in quadrant C | 2,822,990 | 695,607 |
| Events in quadrant D | 7,082,841 | 606,381 |
| Mode SS | |||
|---|---|---|---|
| Quadrant | BADHDUFLAG | Total packets | Discarded packets |
| A | 0 | 110 | 0 |
| B | 0 | 110 | 0 |
| C | 0 | 110 | 0 |
| D | 0 | 110 | 0 |
| Mode M9 | |||
|---|---|---|---|
| Quadrant | BADHDUFLAG | Total packets | Discarded packets |
| A | 0 | 20 | 0 |
| B | 0 | 20 | 0 |
| C | 0 | 20 | 0 |
| D | 0 | 21 | 0 |
| Mode M0 | |||
|---|---|---|---|
| Quadrant | BADHDUFLAG | Total packets | Discarded packets |
| A | 0 | 10877 | 3 |
| B | 0 | 13431 | 2 |
| C | 0 | 11931 | 2 |
| D | 0 | 24848 | 2 |
| Quadrant | Total seconds | Saturated seconds | Saturation percentage |
|---|---|---|---|
| A | 5351 | 7 | 0.130817% |
| B | 5351 | 233 | 4.354326% |
| C | 5351 | 75 | 1.401607% |
| D | 5351 | 817 | 15.268174% |
Noise dominated data is calculated using 1-second bins in cleaned event files. If a bin has >2000 counts, and if more than 50% of those come from <1% of pixels, then it is considered to be noise-dominated and hence unusable.
| Quadrant | # 1 sec bins | Bins with >0 counts | Bins with >2000 counts | High rate bins dominated by noise | Noise dominated (total time) | Noise dominated (detector-on time) | Marked lightcurve |
|---|---|---|---|---|---|---|---|
| A | 7114 | 5351 | 0 | 0 | 0.00% | 0.00% | 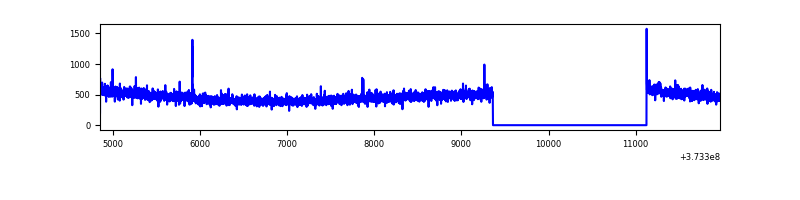 |
| B | 7114 | 5351 | 144 | 144 | 2.02% | 2.69% | 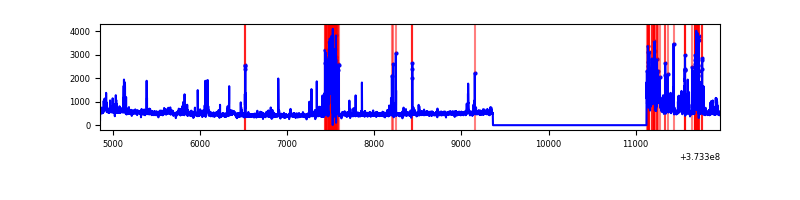 |
| C | 7114 | 5351 | 54 | 54 | 0.76% | 1.01% | 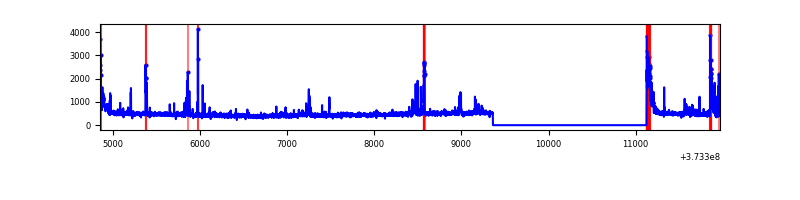 |
| D | 7114 | 5351 | 823 | 823 | 11.57% | 15.38% | 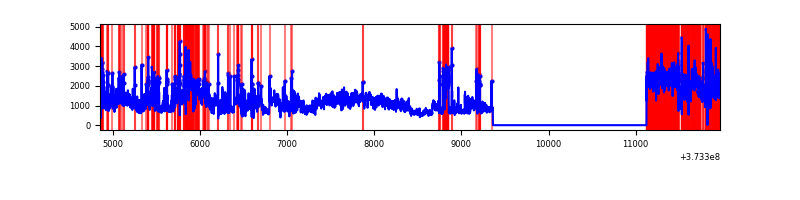 |
Top three noisy pixels from each quadrant. If the there are fewer than three noisy pixels in the level2.evt file, extra rows are filled as -1
| Pixel properties | Quadrant properties | ||||||
|---|---|---|---|---|---|---|---|
| Quadrant | DetID | PixID | Counts | Sigma | Mean | Median | Sigma |
| A | 13 | 6 | 14436 | 108.8 | 629 | 618 | 127.0 |
| A | 13 | 254 | 10296 | 76.2 | 629 | 618 | 127.0 |
| A | 0 | 191 | 7528 | 54.41 | 629 | 618 | 127.0 |
| B | 5 | 172 | 600735 | 5089.02 | 624 | 609 | 117.9 |
| B | 0 | 197 | 136419 | 1151.66 | 624 | 609 | 117.9 |
| B | 0 | 219 | 47909 | 401.1 | 624 | 609 | 117.9 |
| C | 0 | 10 | 272275 | 1958.68 | 603 | 609 | 138.7 |
| C | 1 | 241 | 72335 | 517.14 | 603 | 609 | 138.7 |
| C | 14 | 67 | 33912 | 240.11 | 603 | 609 | 138.7 |
| D | 8 | 195 | 2685818 | 18167.19 | 565 | 550 | 147.8 |
| D | 12 | 227 | 1134462 | 7671.49 | 565 | 550 | 147.8 |
| D | 2 | 250 | 312263 | 2108.89 | 565 | 550 | 147.8 |
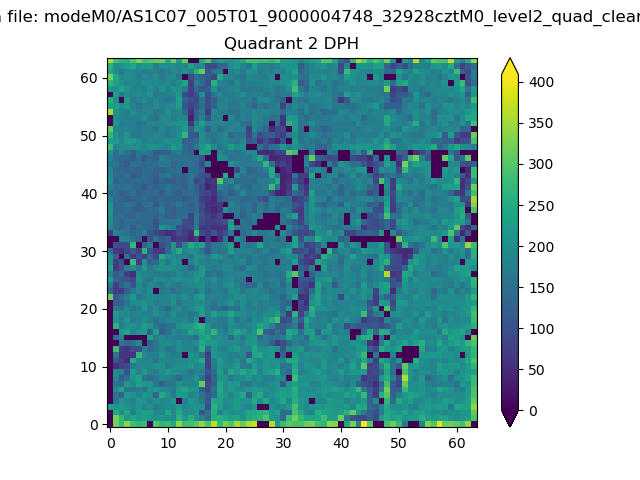
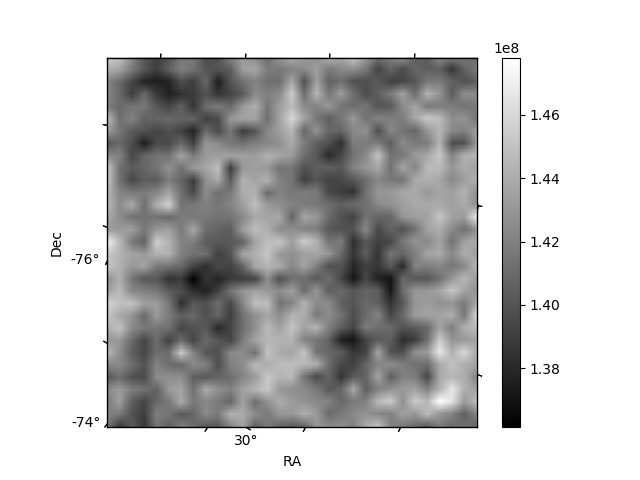
Histogram calculated using DETX and DETY for each event in the final _common_clean file
| Quadrant A | 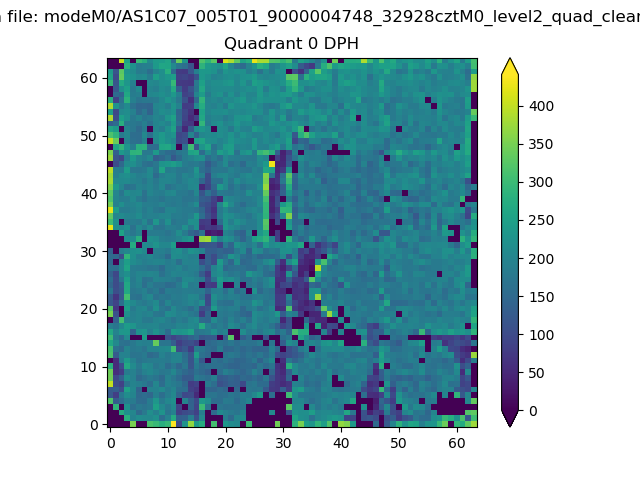 |
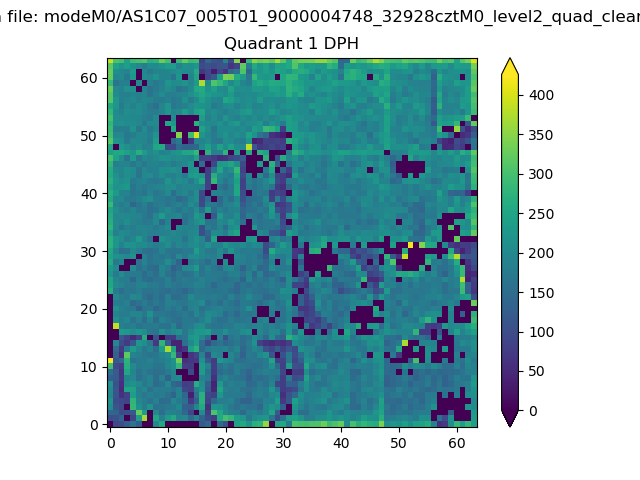 |
Quadrant B |
|---|---|---|---|
| Quadrant D | 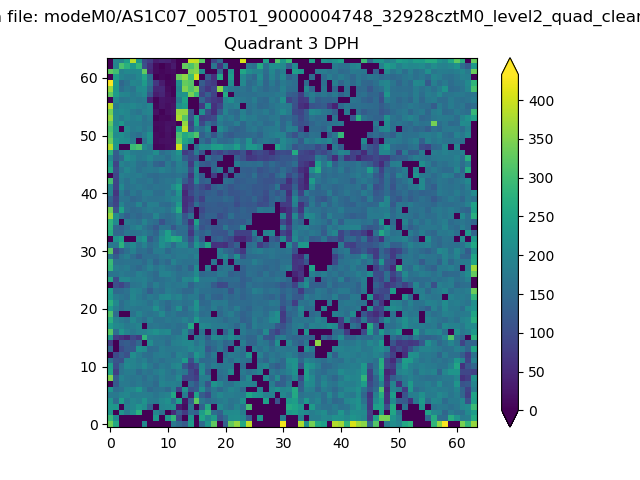 |
 |
Quadrant C |
| Plot type | Count rate plots | Images |
|---|---|---|
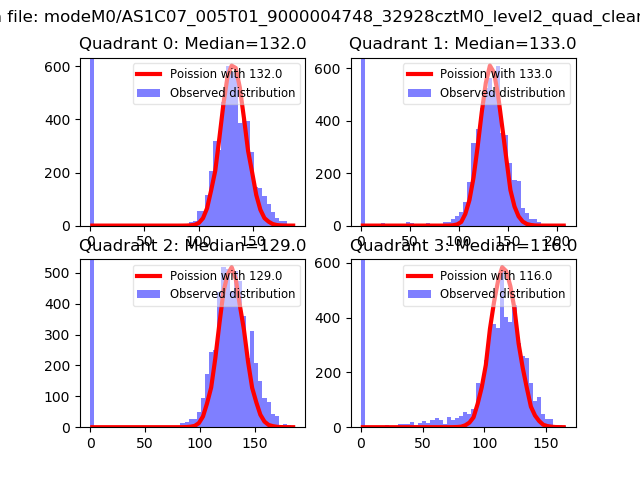
| Comparison with Poisson distribution Blue bars denote a histogram of data divided into 1 sec bins. Red curve is a Poisson curve with rate = median count rate of data. |
 |
 |
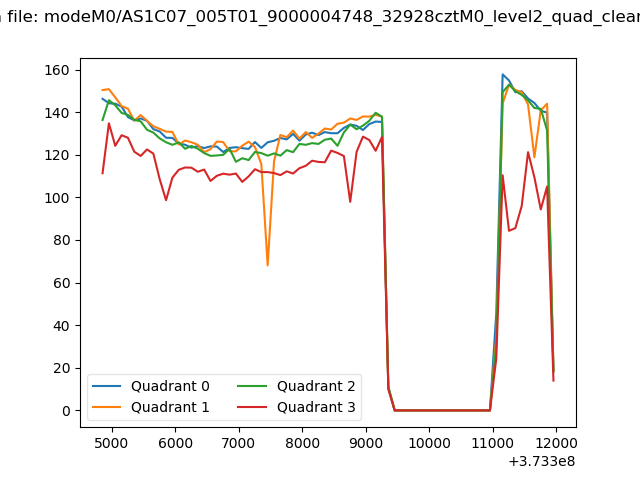
| Quadrant-wise count rates Data is divided into 100 sec bins |
 |
|
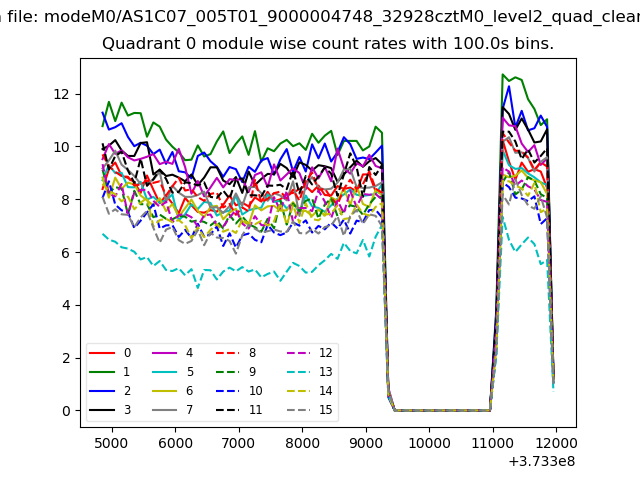
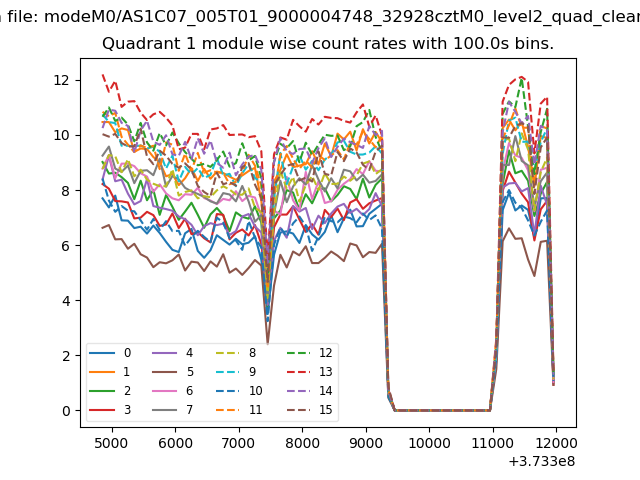
| Module-wise count rates for Quadrant A Data is divided into 100 sec bins |
 |
 |
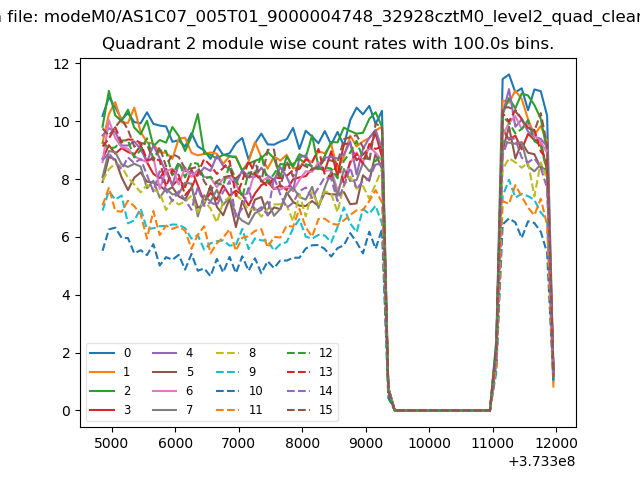
| Module-wise count rates for Quadrant B Data is divided into 100 sec bins |
 |
 |
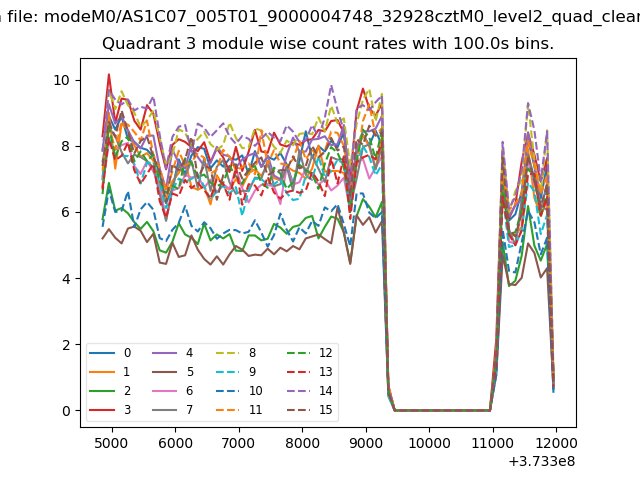
| Module-wise count rates for Quadrant C Data is divided into 100 sec bins |
 |
 |
| Module-wise count rates for Quadrant D Data is divided into 100 sec bins |
 |
 |
| Parameter | Plot |
|---|---|
| CZT HV Monitor | 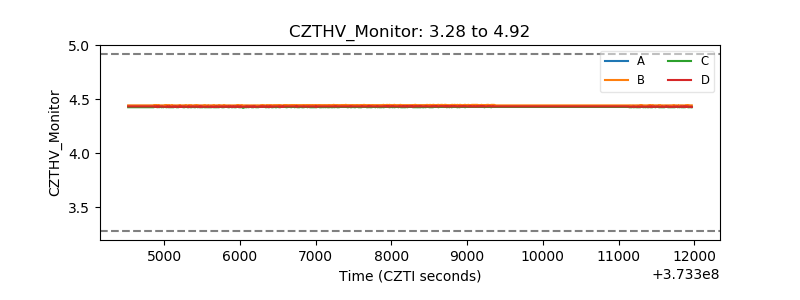 |
| D_VDD |  |
| Temperature 1 | 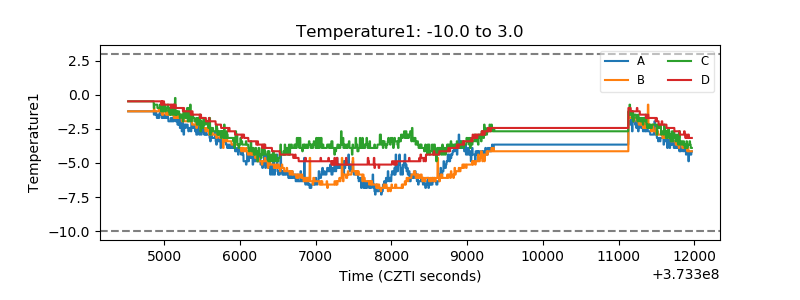 |
| Veto HV Monitor |  |
| Veto LLD | 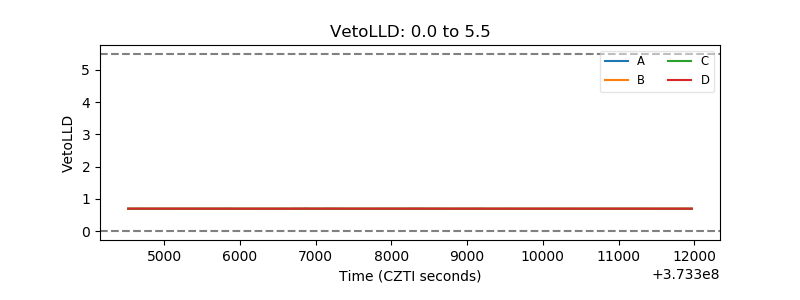 |
| Alpha Counter | 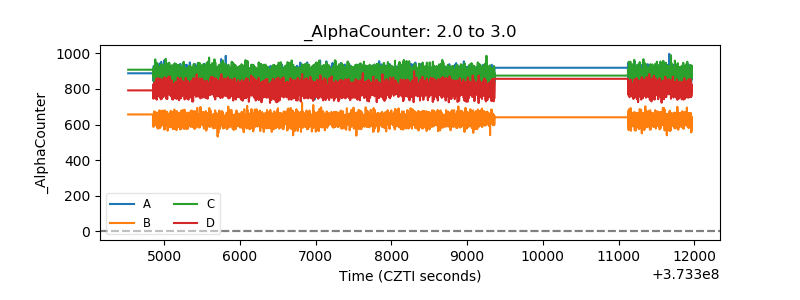 |
| _CPM_Rate | 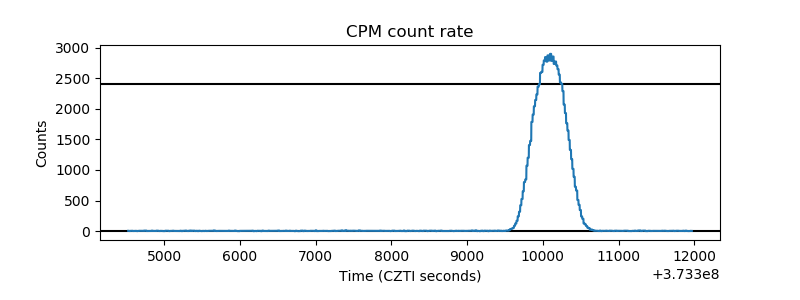 |
| CZT Counter | 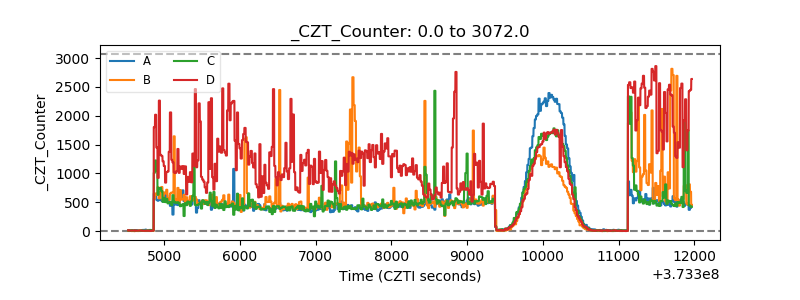 |
| +2.5 Volts monitor |  |
| +5 Volts monitor |  |
| _ROLL_ROT | 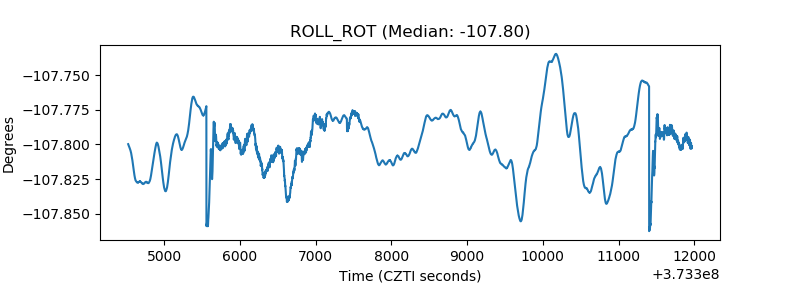 |
| _Roll_DEC | 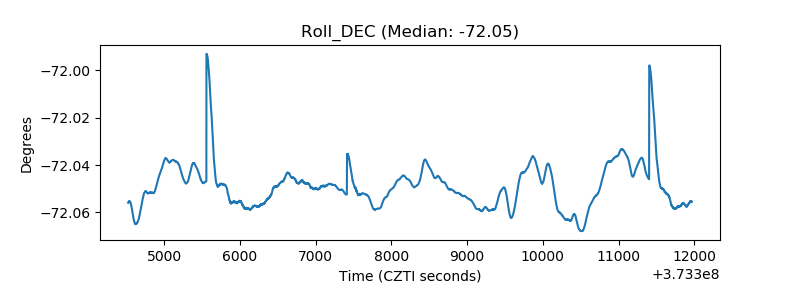 |
| _Roll_RA |  |
| Veto Counter | 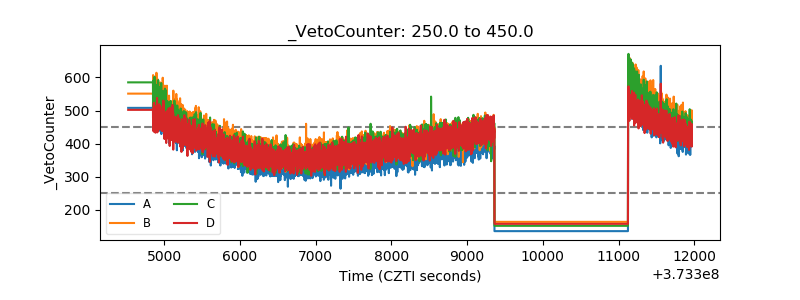 |