| Param | Original file | Final file |
|---|---|---|
| Filename | modeM0/AS1C07_005T01_9000004748_32929cztM0_level2.evt | modeM0/AS1C07_005T01_9000004748_32929cztM0_level2_quad_clean.evt |
| Size (bytes) | 530,746,560 | 102,130,560 |
| Size | 506.2 MB | 97.4 MB |
| Events in quadrant A | 2,629,382 | 714,683 |
| Events in quadrant B | 3,484,123 | 713,864 |
| Events in quadrant C | 3,040,783 | 696,425 |
| Events in quadrant D | 6,568,770 | 604,989 |
| Mode SS | |||
|---|---|---|---|
| Quadrant | BADHDUFLAG | Total packets | Discarded packets |
| A | 0 | 106 | 0 |
| B | 0 | 106 | 0 |
| C | 0 | 106 | 0 |
| D | 0 | 106 | 0 |
| Mode M9 | |||
|---|---|---|---|
| Quadrant | BADHDUFLAG | Total packets | Discarded packets |
| A | 0 | 24 | 0 |
| B | 0 | 24 | 0 |
| C | 0 | 24 | 0 |
| D | 0 | 25 | 0 |
| Mode M0 | |||
|---|---|---|---|
| Quadrant | BADHDUFLAG | Total packets | Discarded packets |
| A | 0 | 11153 | 3 |
| B | 0 | 13587 | 2 |
| C | 0 | 12460 | 2 |
| D | 0 | 23175 | 2 |
| Quadrant | Total seconds | Saturated seconds | Saturation percentage |
|---|---|---|---|
| A | 5174 | 61 | 1.178972% |
| B | 5174 | 267 | 5.160417% |
| C | 5174 | 191 | 3.691535% |
| D | 5174 | 931 | 17.993815% |
Noise dominated data is calculated using 1-second bins in cleaned event files. If a bin has >2000 counts, and if more than 50% of those come from <1% of pixels, then it is considered to be noise-dominated and hence unusable.
| Quadrant | # 1 sec bins | Bins with >0 counts | Bins with >2000 counts | High rate bins dominated by noise | Noise dominated (total time) | Noise dominated (detector-on time) | Marked lightcurve |
|---|---|---|---|---|---|---|---|
| A | 7086 | 5174 | 51 | 51 | 0.72% | 0.99% | 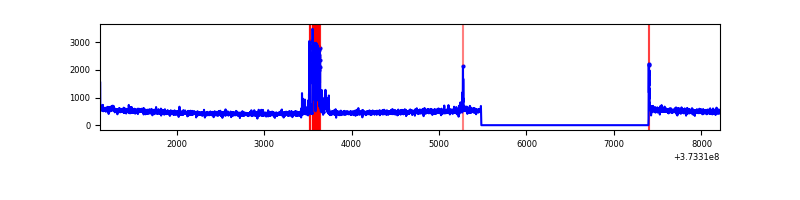 |
| B | 7086 | 5174 | 175 | 175 | 2.47% | 3.38% | 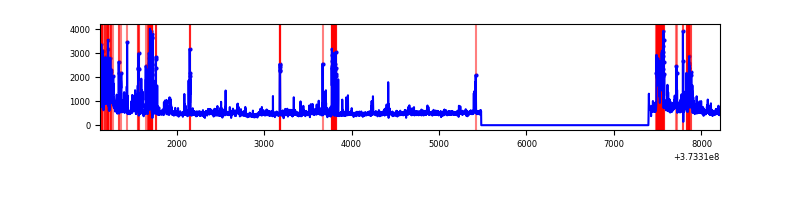 |
| C | 7086 | 5174 | 147 | 147 | 2.07% | 2.84% | 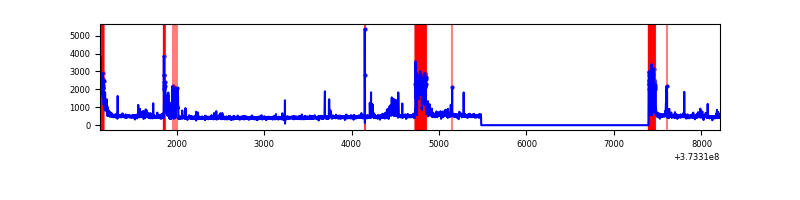 |
| D | 7086 | 5174 | 963 | 963 | 13.59% | 18.61% | 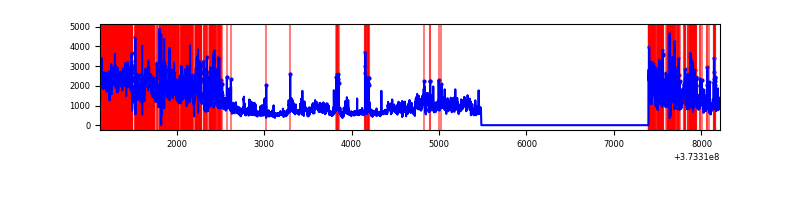 |
Top three noisy pixels from each quadrant. If the there are fewer than three noisy pixels in the level2.evt file, extra rows are filled as -1
| Pixel properties | Quadrant properties | ||||||
|---|---|---|---|---|---|---|---|
| Quadrant | DetID | PixID | Counts | Sigma | Mean | Median | Sigma |
| A | 0 | 143 | 187868 | 1501.82 | 616 | 605 | 124.7 |
| A | 7 | 16 | 25182 | 197.1 | 616 | 605 | 124.7 |
| A | 0 | 191 | 18039 | 139.82 | 616 | 605 | 124.7 |
| B | 5 | 172 | 409014 | 3549.33 | 615 | 601 | 115.1 |
| B | 5 | 32 | 224623 | 1946.87 | 615 | 601 | 115.1 |
| B | 0 | 197 | 140820 | 1218.58 | 615 | 601 | 115.1 |
| C | 0 | 10 | 389678 | 2883.73 | 591 | 595 | 134.9 |
| C | 14 | 128 | 232632 | 1719.76 | 591 | 595 | 134.9 |
| C | 1 | 241 | 70026 | 514.59 | 591 | 595 | 134.9 |
| D | 8 | 195 | 1790428 | 12571.23 | 549 | 538 | 142.4 |
| D | 12 | 227 | 1315549 | 9235.94 | 549 | 538 | 142.4 |
| D | 2 | 250 | 500115 | 3508.76 | 549 | 538 | 142.4 |
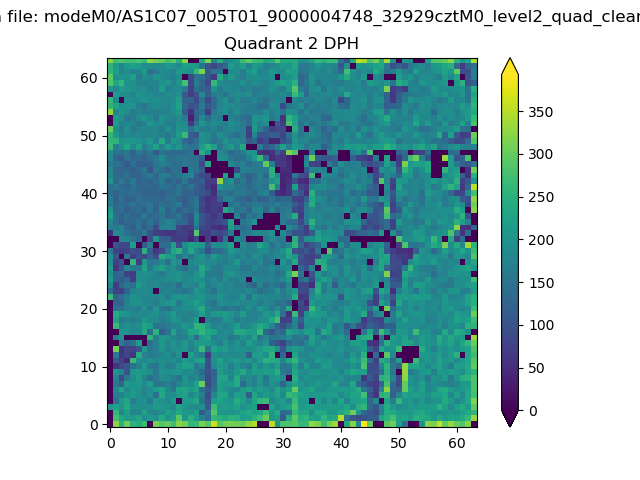
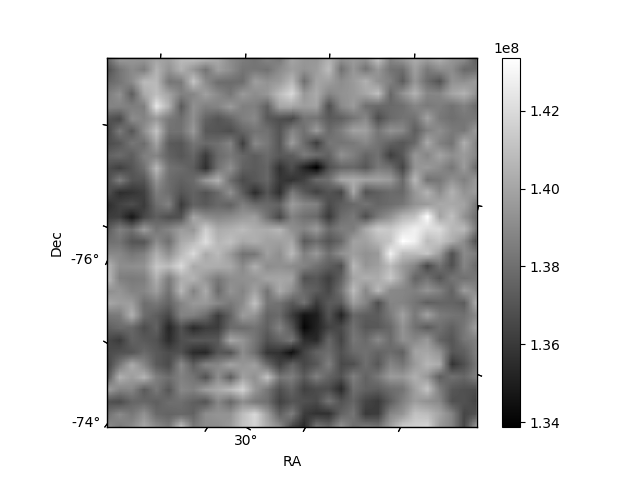
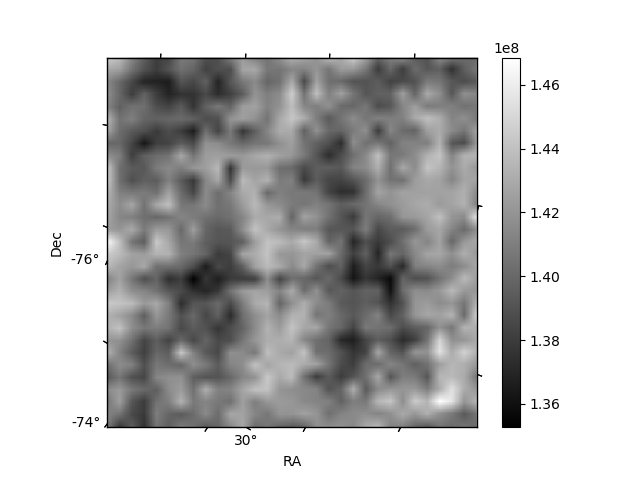
Histogram calculated using DETX and DETY for each event in the final _common_clean file
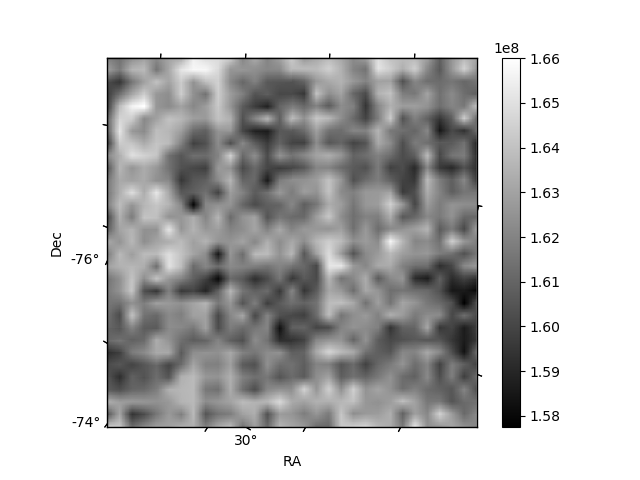
| Quadrant A | 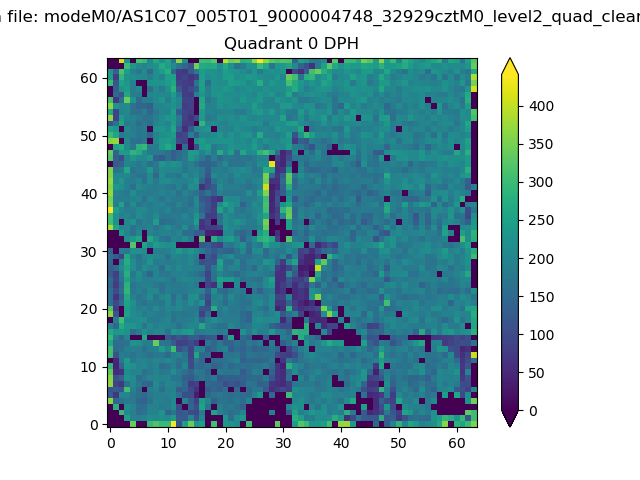 |
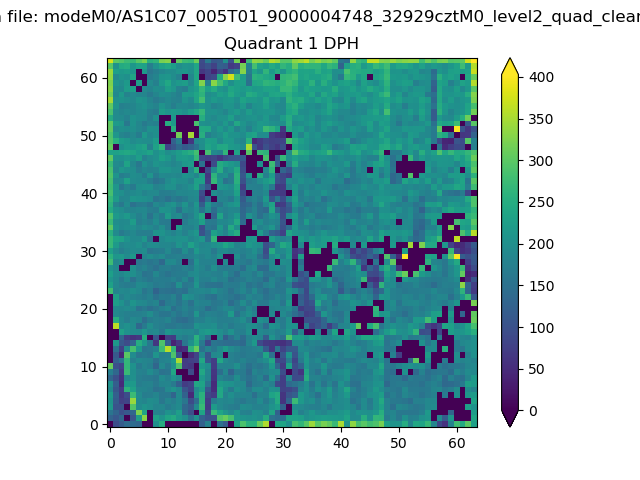 |
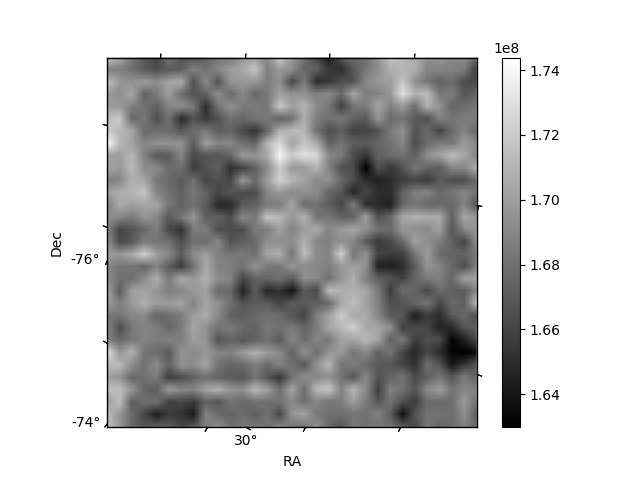
Quadrant B |
|---|---|---|---|
| Quadrant D | 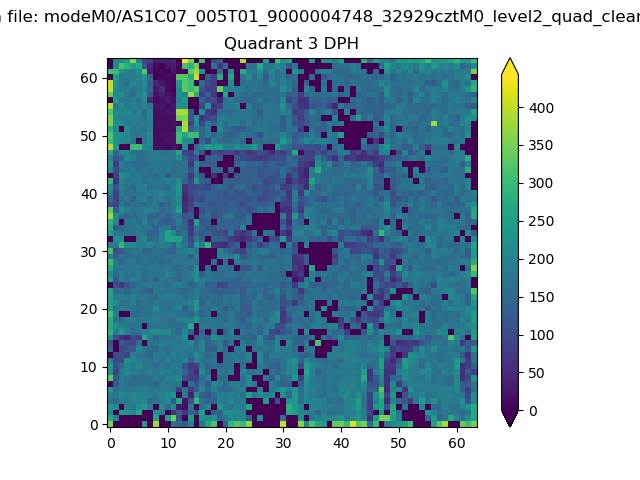 |
 |
Quadrant C |
| Plot type | Count rate plots | Images |
|---|---|---|
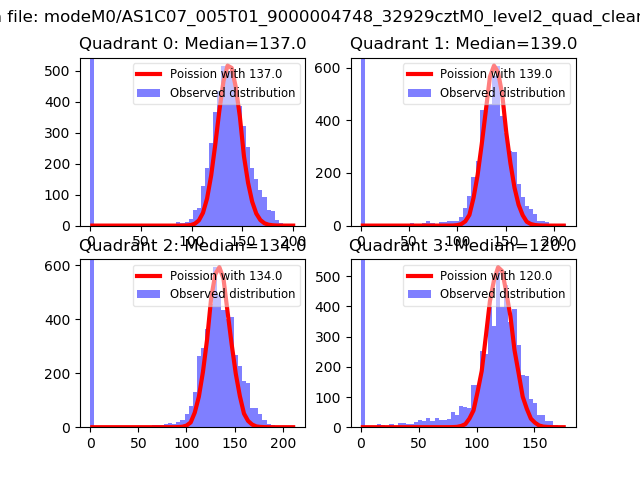
| Comparison with Poisson distribution Blue bars denote a histogram of data divided into 1 sec bins. Red curve is a Poisson curve with rate = median count rate of data. |
 |
 |
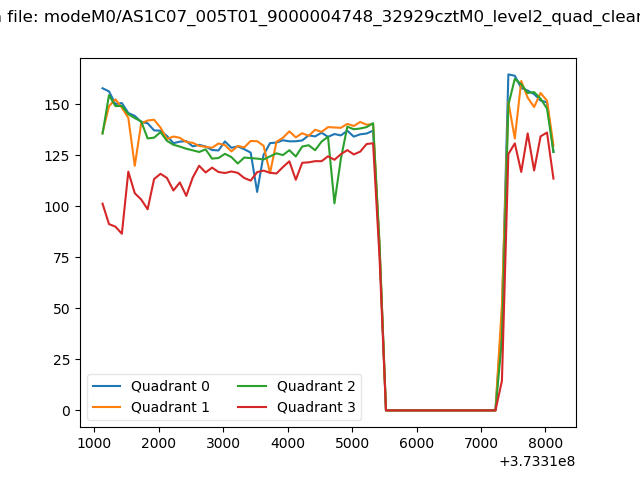
| Quadrant-wise count rates Data is divided into 100 sec bins |
 |
|
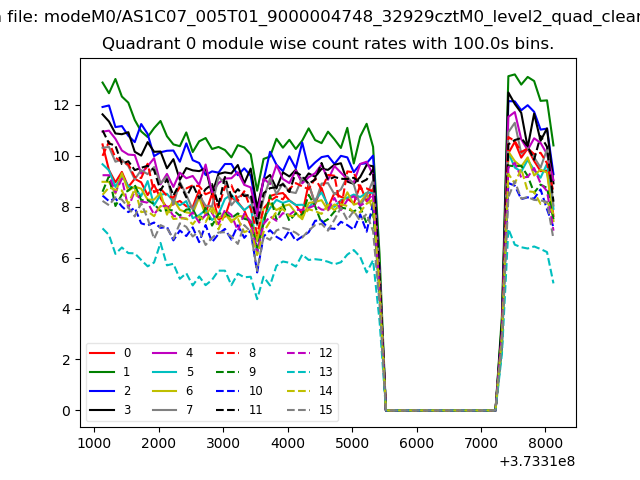
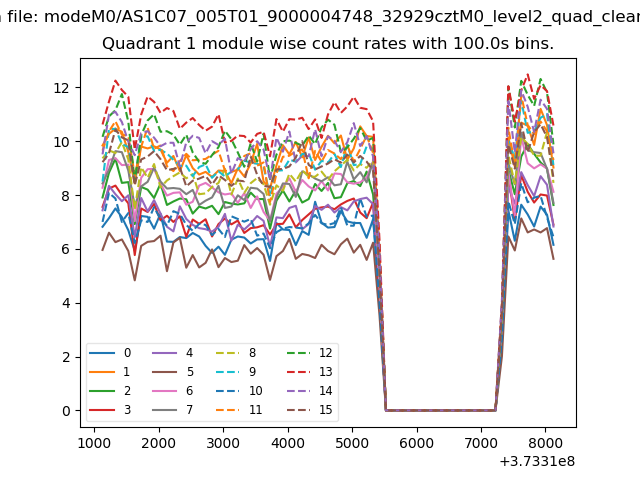
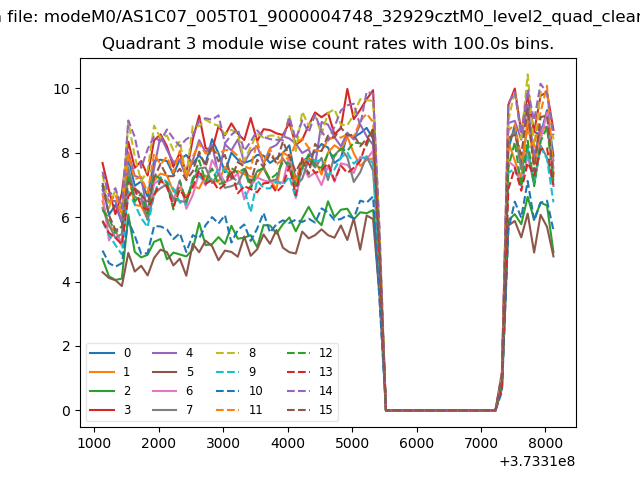
| Module-wise count rates for Quadrant A Data is divided into 100 sec bins |
 |
 |
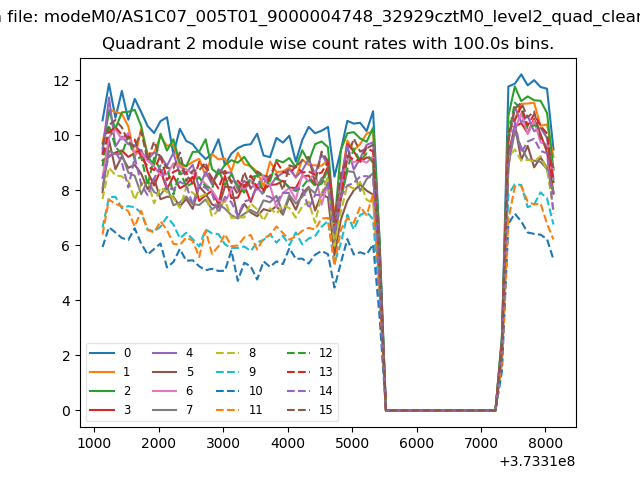
| Module-wise count rates for Quadrant B Data is divided into 100 sec bins |
 |
 |
| Module-wise count rates for Quadrant C Data is divided into 100 sec bins |
 |
 |
| Module-wise count rates for Quadrant D Data is divided into 100 sec bins |
 |
 |
| Parameter | Plot |
|---|---|
| CZT HV Monitor |  |
| D_VDD | 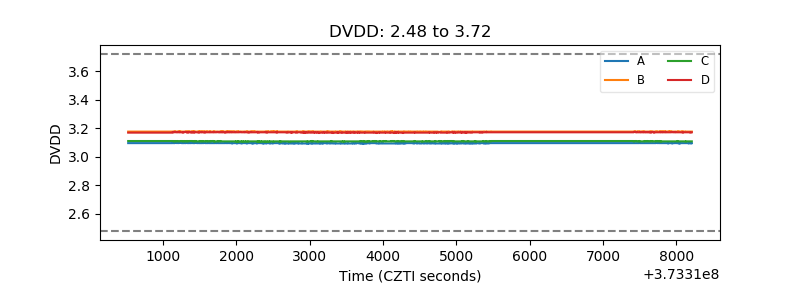 |
| Temperature 1 | 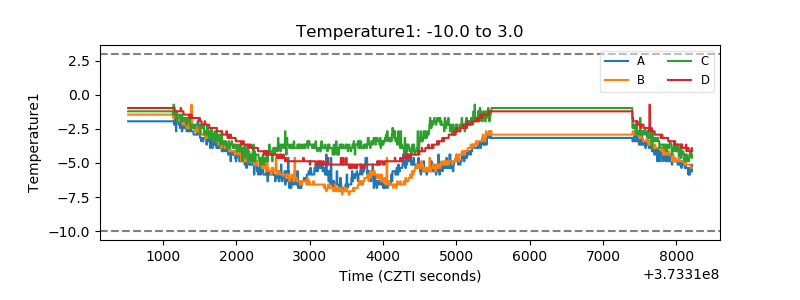 |
| Veto HV Monitor | 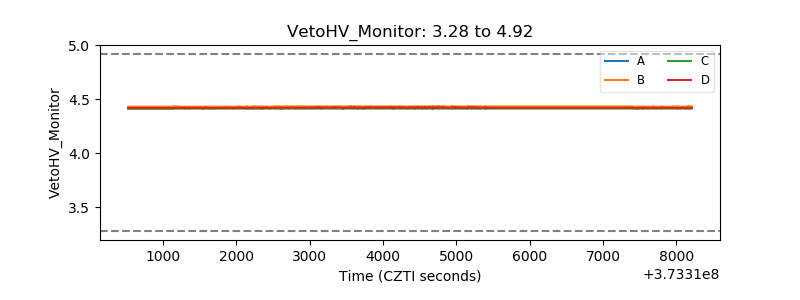 |
| Veto LLD | 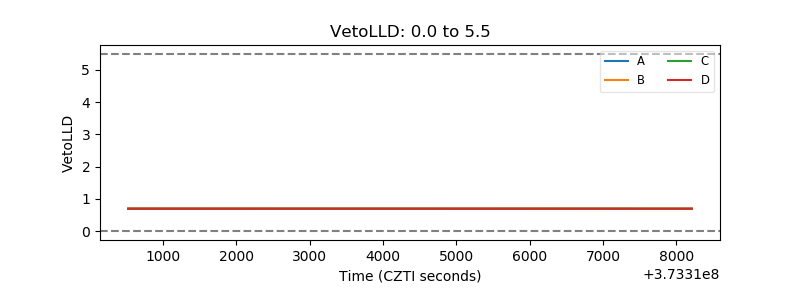 |
| Alpha Counter | 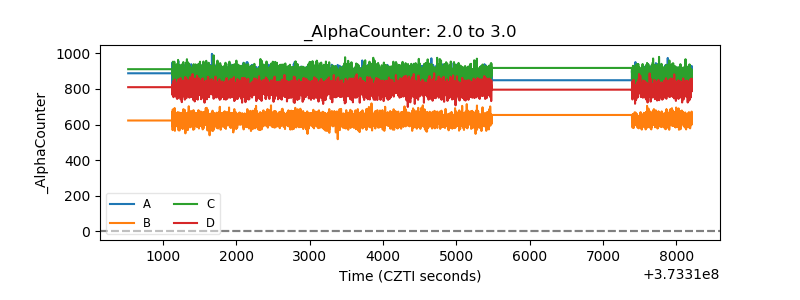 |
| _CPM_Rate | 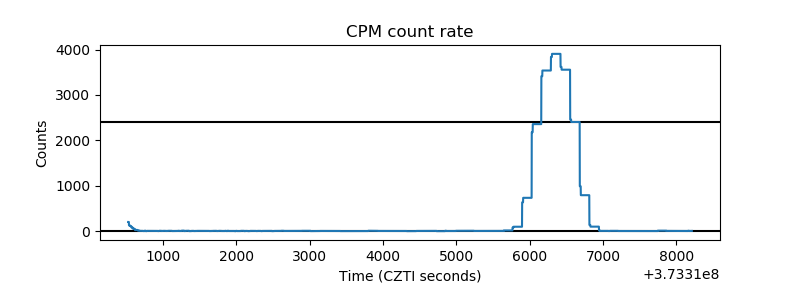 |
| CZT Counter | 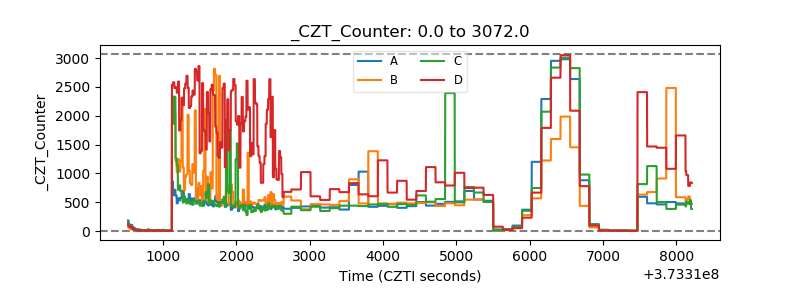 |
| +2.5 Volts monitor |  |
| +5 Volts monitor |  |
| _ROLL_ROT | 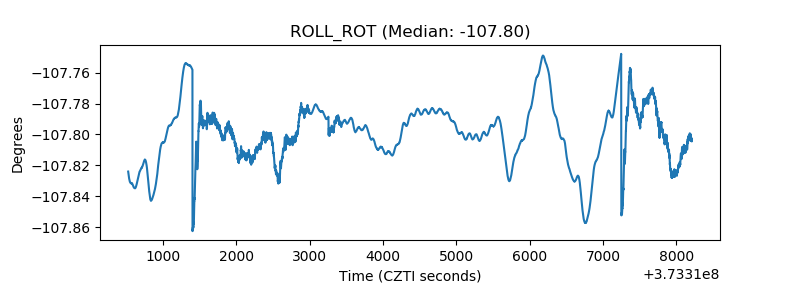 |
| _Roll_DEC | 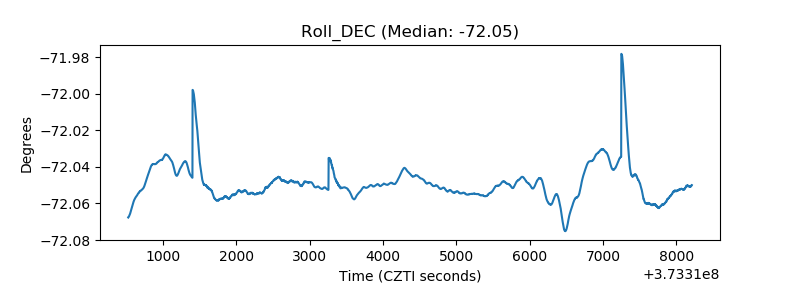 |
| _Roll_RA | 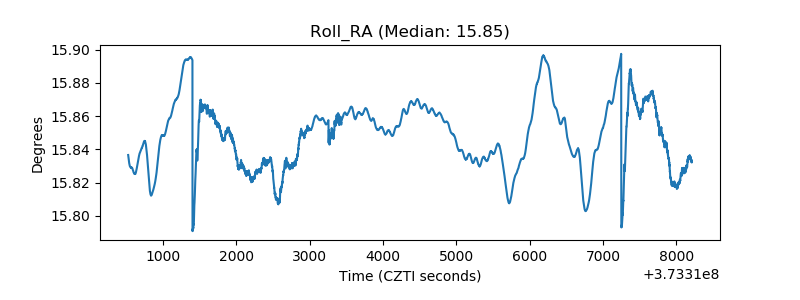 |
| Veto Counter | 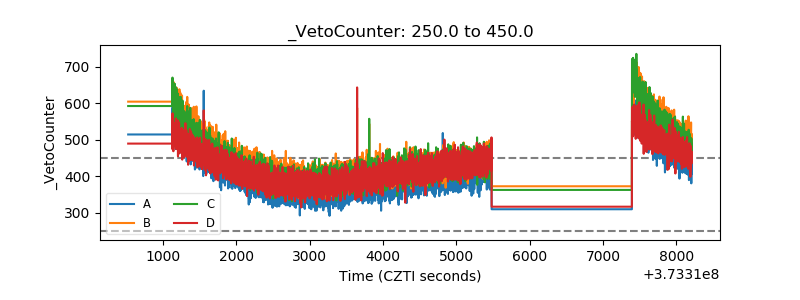 |