| Param | Original file | Final file |
|---|---|---|
| Filename | modeM0/AS1C07_005T01_9000004748_32930cztM0_level2.evt | modeM0/AS1C07_005T01_9000004748_32930cztM0_level2_quad_clean.evt |
| Size (bytes) | 497,073,600 | 106,073,280 |
| Size | 474.0 MB | 101.2 MB |
| Events in quadrant A | 2,687,058 | 735,155 |
| Events in quadrant B | 3,506,504 | 741,760 |
| Events in quadrant C | 2,642,356 | 730,260 |
| Events in quadrant D | 5,871,744 | 646,927 |
| Mode SS | |||
|---|---|---|---|
| Quadrant | BADHDUFLAG | Total packets | Discarded packets |
| A | 0 | 104 | 0 |
| B | 0 | 104 | 0 |
| C | 0 | 104 | 0 |
| D | 0 | 104 | 0 |
| Mode M9 | |||
|---|---|---|---|
| Quadrant | BADHDUFLAG | Total packets | Discarded packets |
| A | 0 | 29 | 0 |
| B | 0 | 29 | 0 |
| C | 0 | 29 | 0 |
| D | 0 | 30 | 0 |
| Mode M0 | |||
|---|---|---|---|
| Quadrant | BADHDUFLAG | Total packets | Discarded packets |
| A | 0 | 11059 | 3 |
| B | 0 | 13651 | 2 |
| C | 0 | 11011 | 2 |
| D | 0 | 21169 | 2 |
| Quadrant | Total seconds | Saturated seconds | Saturation percentage |
|---|---|---|---|
| A | 5114 | 22 | 0.430192% |
| B | 5114 | 208 | 4.067266% |
| C | 5114 | 53 | 1.036371% |
| D | 5114 | 485 | 9.483770% |
Noise dominated data is calculated using 1-second bins in cleaned event files. If a bin has >2000 counts, and if more than 50% of those come from <1% of pixels, then it is considered to be noise-dominated and hence unusable.
| Quadrant | # 1 sec bins | Bins with >0 counts | Bins with >2000 counts | High rate bins dominated by noise | Noise dominated (total time) | Noise dominated (detector-on time) | Marked lightcurve |
|---|---|---|---|---|---|---|---|
| A | 7117 | 5115 | 15 | 15 | 0.21% | 0.29% | 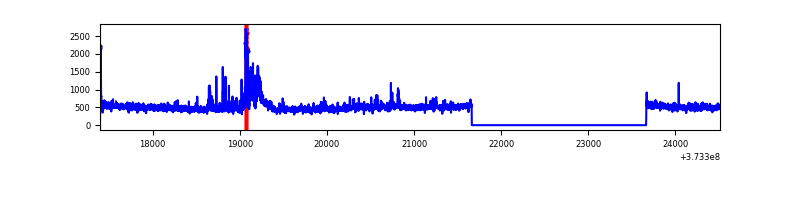 |
| B | 7117 | 5115 | 140 | 140 | 1.97% | 2.74% | 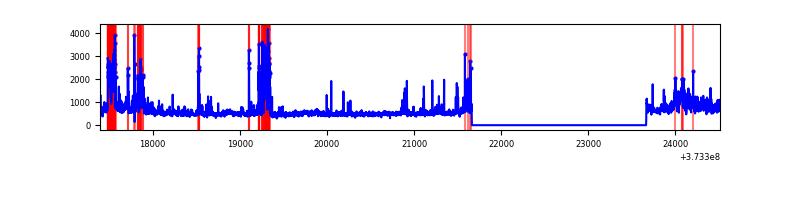 |
| C | 7117 | 5115 | 40 | 40 | 0.56% | 0.78% | 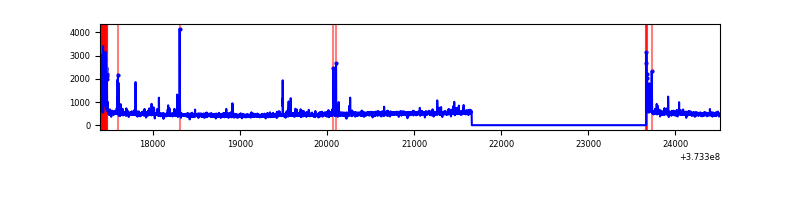 |
| D | 7117 | 5115 | 422 | 422 | 5.93% | 8.25% | 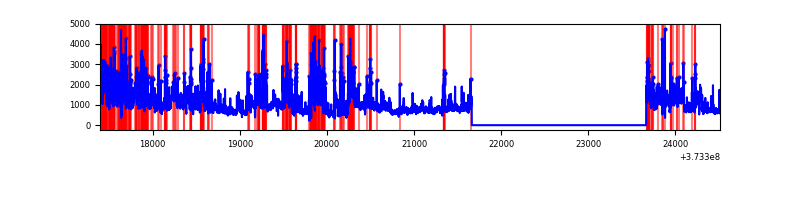 |
Top three noisy pixels from each quadrant. If the there are fewer than three noisy pixels in the level2.evt file, extra rows are filled as -1
| Pixel properties | Quadrant properties | ||||||
|---|---|---|---|---|---|---|---|
| Quadrant | DetID | PixID | Counts | Sigma | Mean | Median | Sigma |
| A | 0 | 143 | 152682 | 1198.16 | 622 | 610 | 126.9 |
| A | 12 | 16 | 35429 | 274.33 | 622 | 610 | 126.9 |
| A | 0 | 191 | 34581 | 267.65 | 622 | 610 | 126.9 |
| B | 0 | 219 | 274139 | 2346.86 | 625 | 611 | 116.6 |
| B | 5 | 172 | 251894 | 2156.0 | 625 | 611 | 116.6 |
| B | 5 | 32 | 222886 | 1907.11 | 625 | 611 | 116.6 |
| C | 0 | 10 | 160341 | 1140.33 | 608 | 613 | 140.1 |
| C | 1 | 241 | 56637 | 399.97 | 608 | 613 | 140.1 |
| C | 3 | 233 | 26184 | 182.56 | 608 | 613 | 140.1 |
| D | 8 | 195 | 1829537 | 12540.96 | 573 | 561 | 145.8 |
| D | 12 | 6 | 411314 | 2816.46 | 573 | 561 | 145.8 |
| D | 2 | 250 | 352953 | 2416.29 | 573 | 561 | 145.8 |
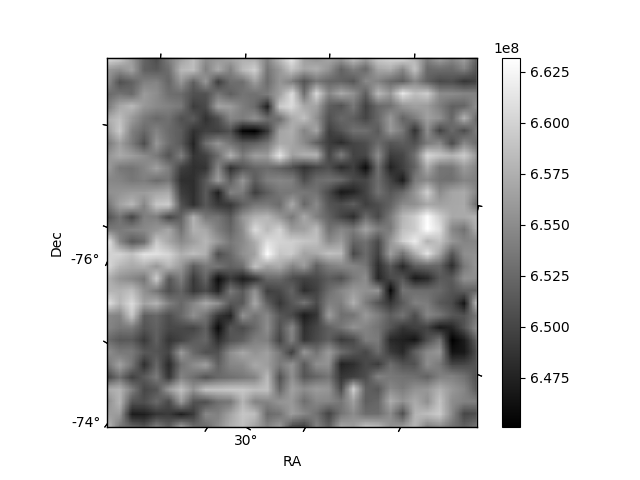
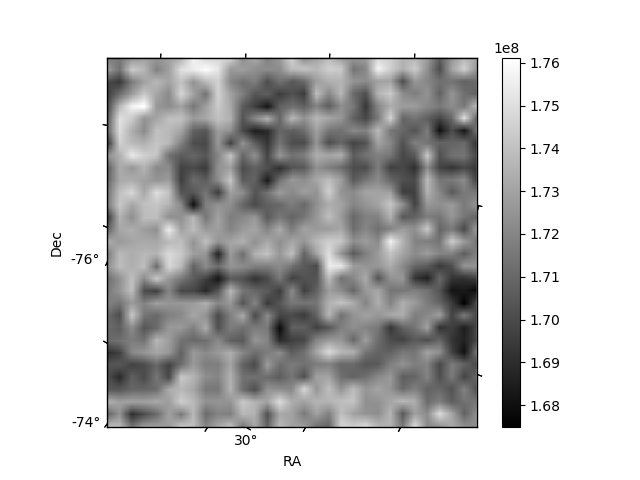
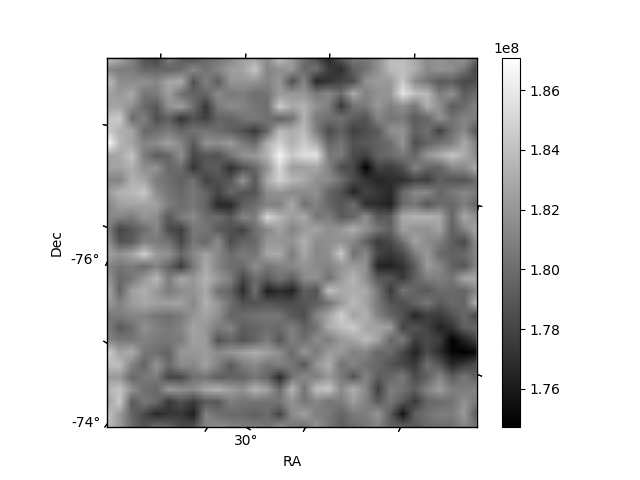
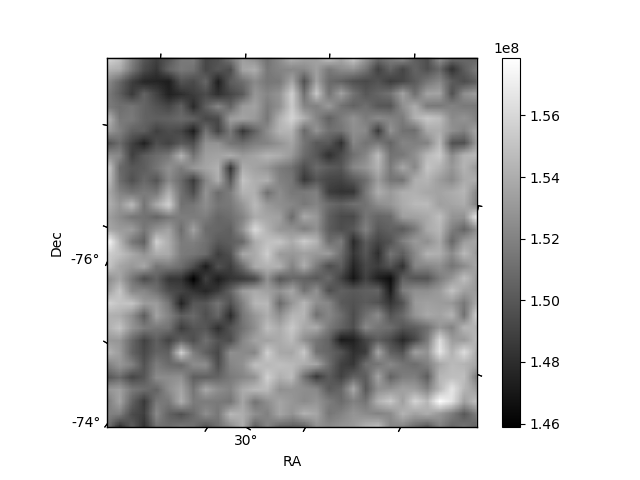
Histogram calculated using DETX and DETY for each event in the final _common_clean file
| Quadrant A | 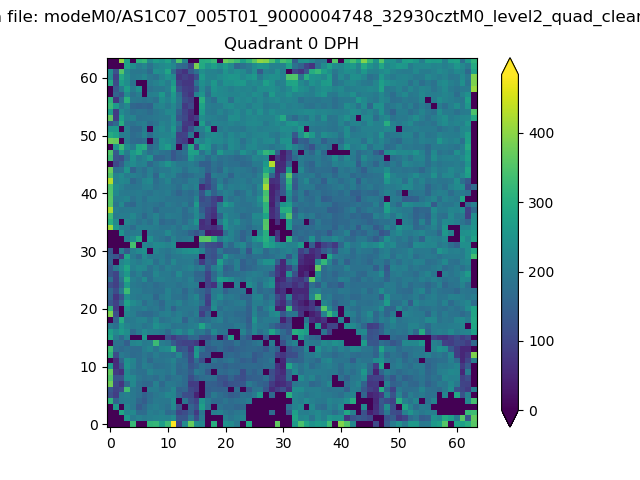 |
 |
Quadrant B |
|---|---|---|---|
| Quadrant D | 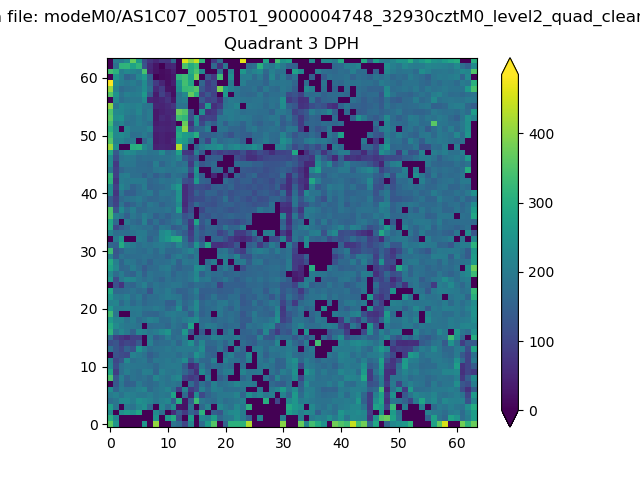 |
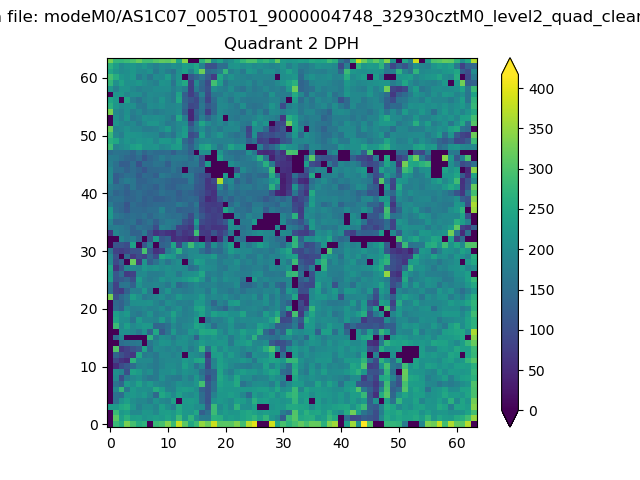 |
Quadrant C |
| Plot type | Count rate plots | Images |
|---|---|---|
| Comparison with Poisson distribution Blue bars denote a histogram of data divided into 1 sec bins. Red curve is a Poisson curve with rate = median count rate of data. |
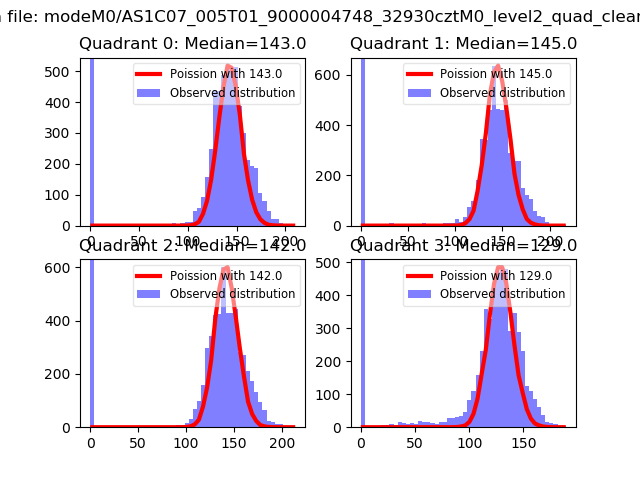 |
 |
| Quadrant-wise count rates Data is divided into 100 sec bins |
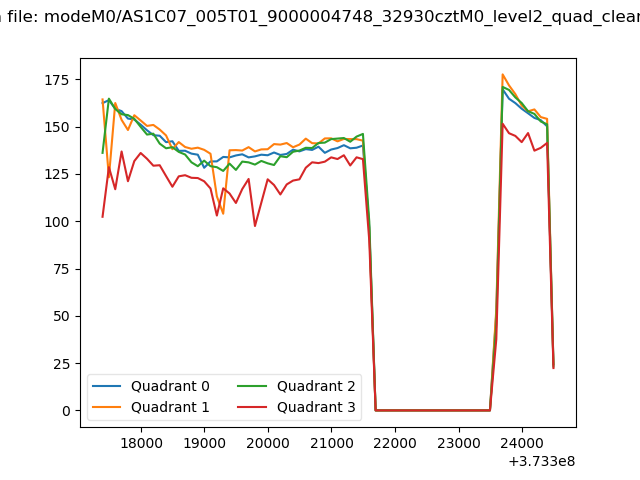 |
|
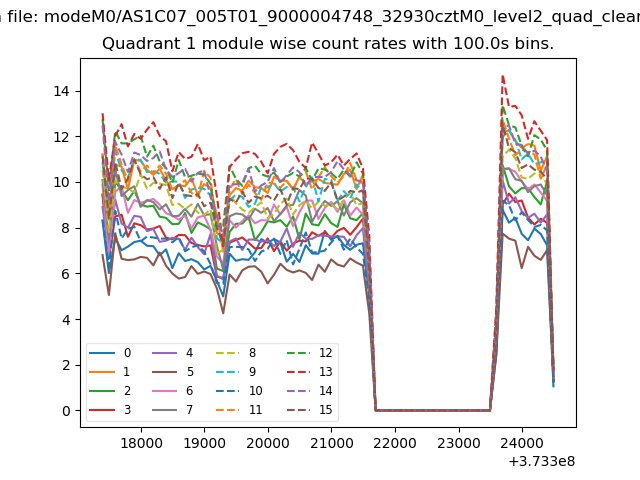
| Module-wise count rates for Quadrant A Data is divided into 100 sec bins |
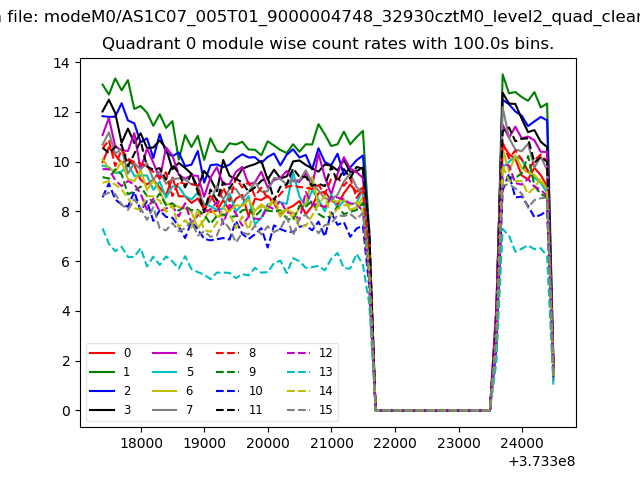 |
 |
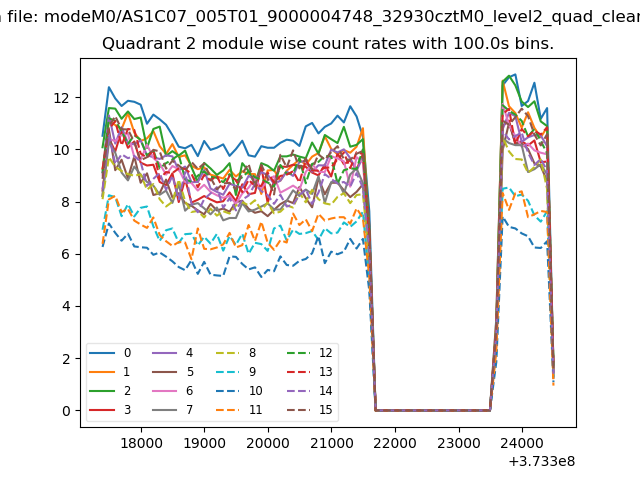
| Module-wise count rates for Quadrant B Data is divided into 100 sec bins |
 |
 |
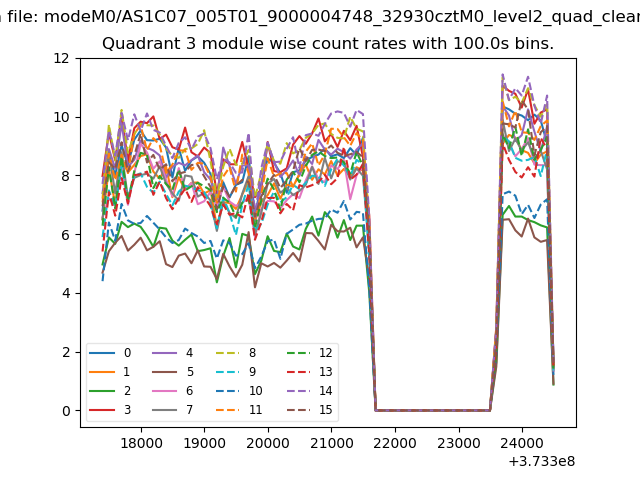
| Module-wise count rates for Quadrant C Data is divided into 100 sec bins |
 |
 |
| Module-wise count rates for Quadrant D Data is divided into 100 sec bins |
 |
 |
| Parameter | Plot |
|---|---|
| CZT HV Monitor | 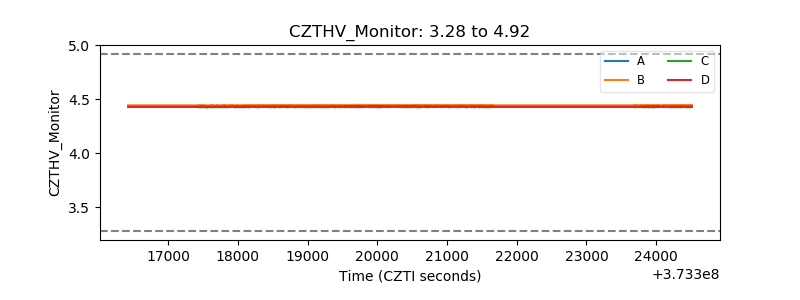 |
| D_VDD |  |
| Temperature 1 | 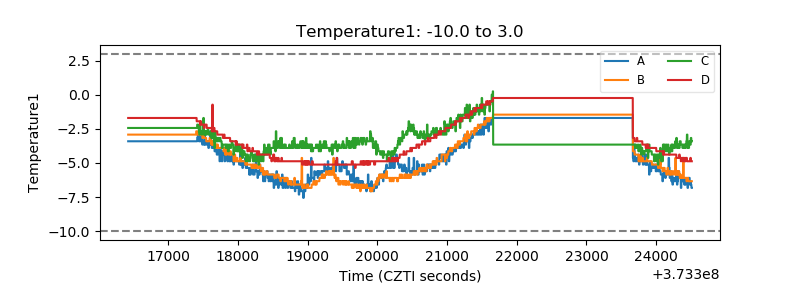 |
| Veto HV Monitor |  |
| Veto LLD | 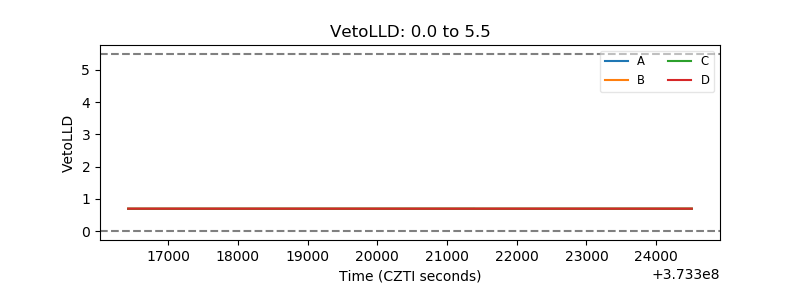 |
| Alpha Counter | 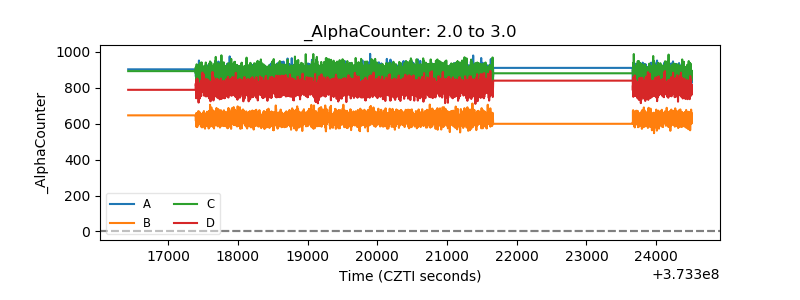 |
| _CPM_Rate | 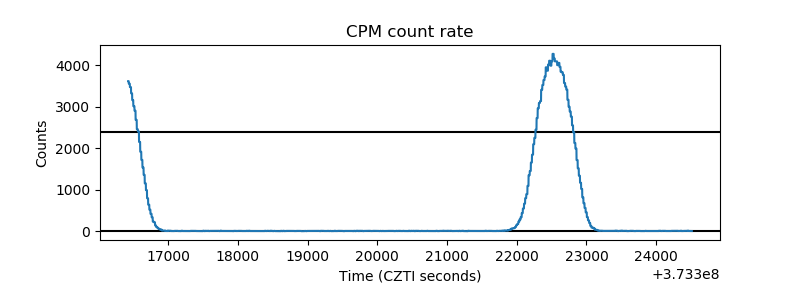 |
| CZT Counter | 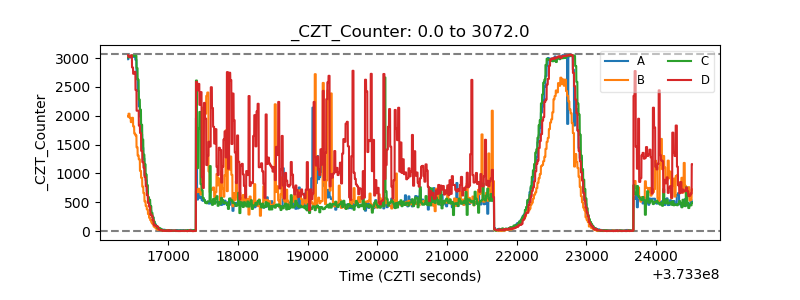 |
| +2.5 Volts monitor | 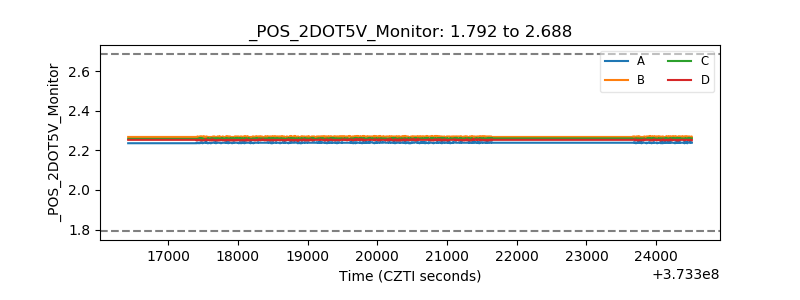 |
| +5 Volts monitor |  |
| _ROLL_ROT | 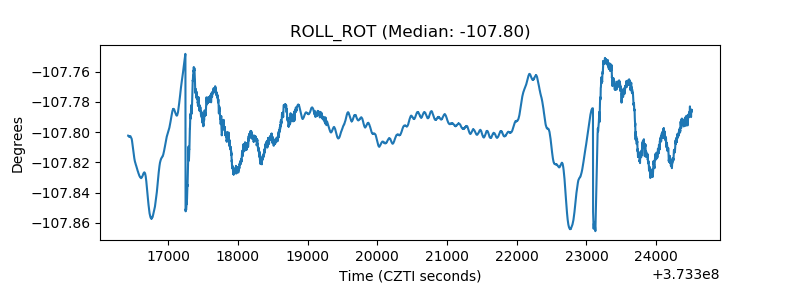 |
| _Roll_DEC | 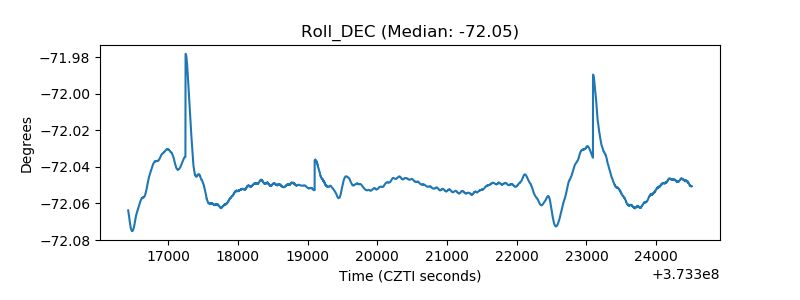 |
| _Roll_RA | 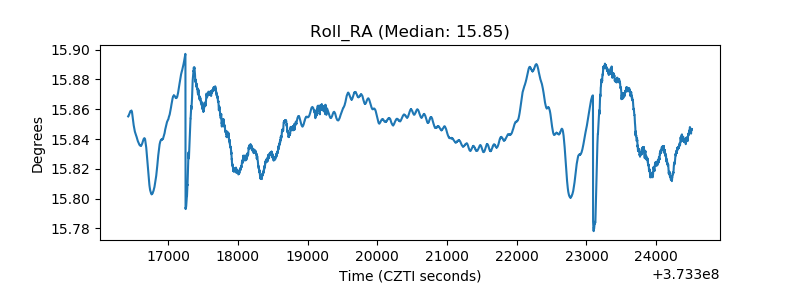 |
| Veto Counter | 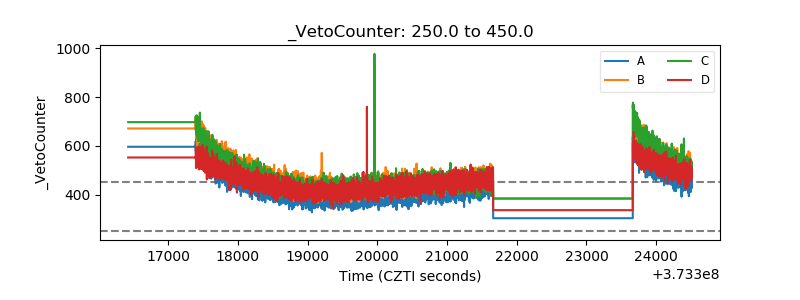 |