| Param | Original file | Final file |
|---|---|---|
| Filename | modeM0/AS1C07_005T01_9000004748_32931cztM0_level2.evt | modeM0/AS1C07_005T01_9000004748_32931cztM0_level2_quad_clean.evt |
| Size (bytes) | 445,368,960 | 103,916,160 |
| Size | 424.7 MB | 99.1 MB |
| Events in quadrant A | 2,401,350 | 714,273 |
| Events in quadrant B | 3,822,773 | 715,576 |
| Events in quadrant C | 2,493,060 | 718,265 |
| Events in quadrant D | 4,439,000 | 655,714 |
| Mode SS | |||
|---|---|---|---|
| Quadrant | BADHDUFLAG | Total packets | Discarded packets |
| A | 0 | 100 | 0 |
| B | 0 | 100 | 0 |
| C | 0 | 100 | 0 |
| D | 0 | 100 | 0 |
| Mode M9 | |||
|---|---|---|---|
| Quadrant | BADHDUFLAG | Total packets | Discarded packets |
| A | 0 | 33 | 0 |
| B | 0 | 33 | 0 |
| C | 0 | 33 | 0 |
| D | 0 | 34 | 0 |
| Mode M0 | |||
|---|---|---|---|
| Quadrant | BADHDUFLAG | Total packets | Discarded packets |
| A | 0 | 10023 | 3 |
| B | 0 | 14670 | 2 |
| C | 0 | 10322 | 2 |
| D | 0 | 16764 | 2 |
| Quadrant | Total seconds | Saturated seconds | Saturation percentage |
|---|---|---|---|
| A | 4893 | 10 | 0.204374% |
| B | 4893 | 295 | 6.029021% |
| C | 4893 | 21 | 0.429185% |
| D | 4893 | 143 | 2.922542% |
Noise dominated data is calculated using 1-second bins in cleaned event files. If a bin has >2000 counts, and if more than 50% of those come from <1% of pixels, then it is considered to be noise-dominated and hence unusable.
| Quadrant | # 1 sec bins | Bins with >0 counts | Bins with >2000 counts | High rate bins dominated by noise | Noise dominated (total time) | Noise dominated (detector-on time) | Marked lightcurve |
|---|---|---|---|---|---|---|---|
| A | 6986 | 4894 | 0 | 0 | 0.00% | 0.00% | 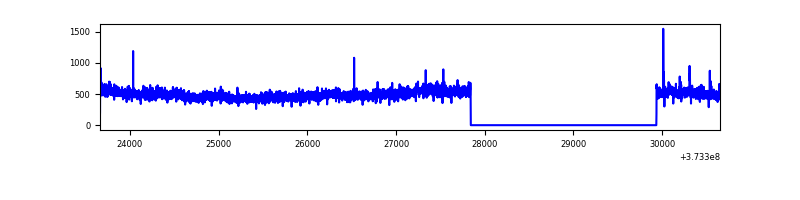 |
| B | 6986 | 4894 | 180 | 180 | 2.58% | 3.68% | 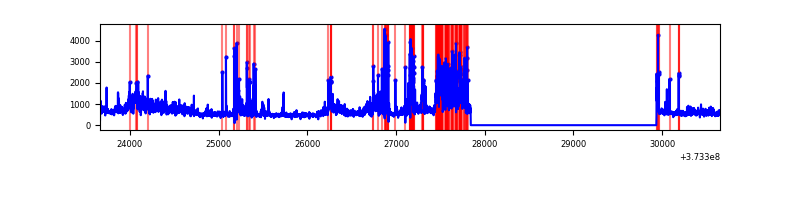 |
| C | 6986 | 4894 | 12 | 12 | 0.17% | 0.25% | 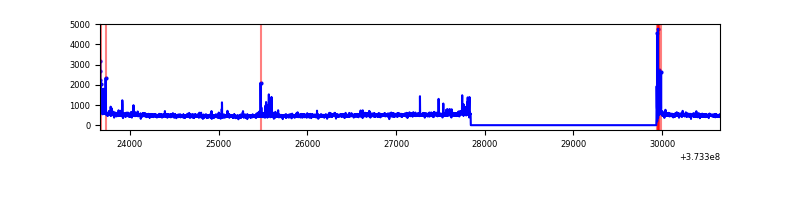 |
| D | 6986 | 4894 | 119 | 119 | 1.70% | 2.43% | 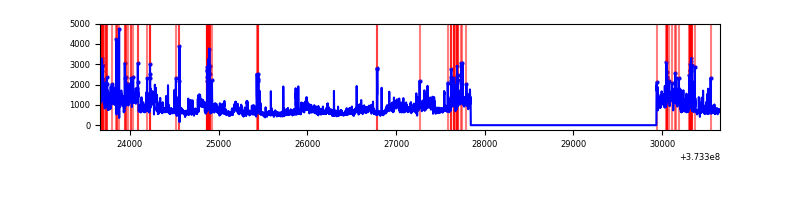 |
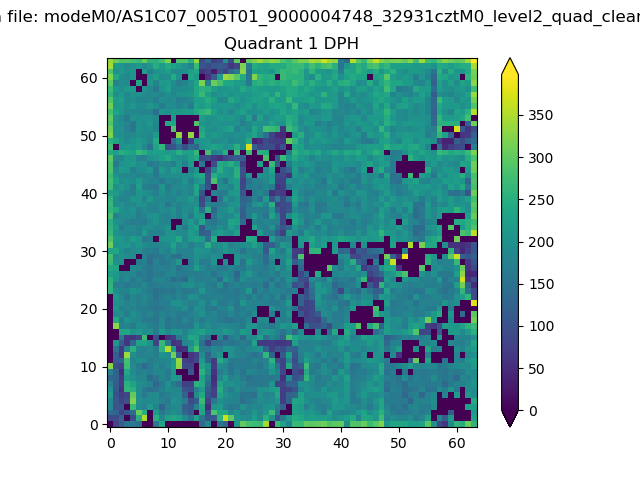
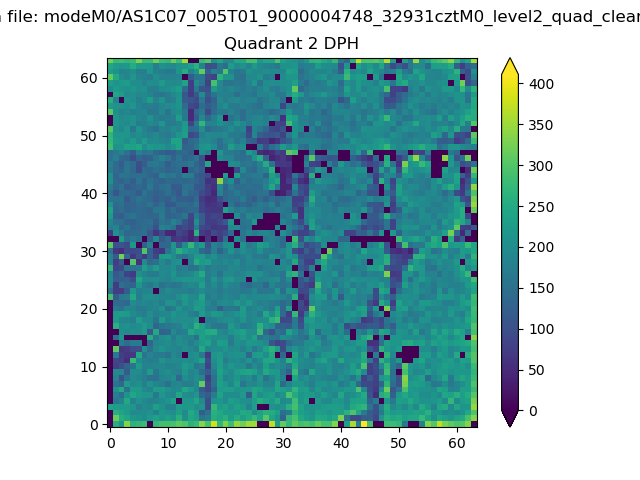
Top three noisy pixels from each quadrant. If the there are fewer than three noisy pixels in the level2.evt file, extra rows are filled as -1
| Pixel properties | Quadrant properties | ||||||
|---|---|---|---|---|---|---|---|
| Quadrant | DetID | PixID | Counts | Sigma | Mean | Median | Sigma |
| A | 0 | 159 | 51502 | 422.98 | 601 | 589 | 120.4 |
| A | 13 | 6 | 13773 | 109.53 | 601 | 589 | 120.4 |
| A | 0 | 191 | 12871 | 102.04 | 601 | 589 | 120.4 |
| B | 0 | 219 | 562779 | 5087.71 | 597 | 583 | 110.5 |
| B | 5 | 172 | 561841 | 5079.22 | 597 | 583 | 110.5 |
| B | 0 | 189 | 94380 | 848.83 | 597 | 583 | 110.5 |
| C | 0 | 10 | 76832 | 566.81 | 594 | 598 | 134.5 |
| C | 14 | 67 | 25085 | 182.06 | 594 | 598 | 134.5 |
| C | 14 | 128 | 23371 | 169.32 | 594 | 598 | 134.5 |
| D | 8 | 195 | 1527820 | 10461.02 | 574 | 559 | 146.0 |
| D | 2 | 250 | 241226 | 1648.45 | 574 | 559 | 146.0 |
| D | 2 | 120 | 116229 | 792.28 | 574 | 559 | 146.0 |
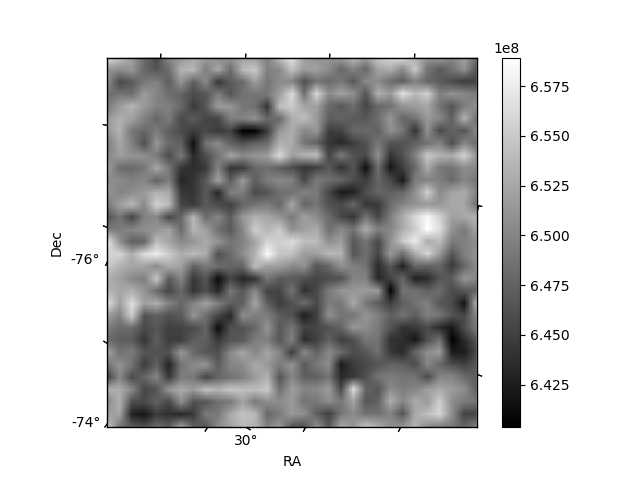
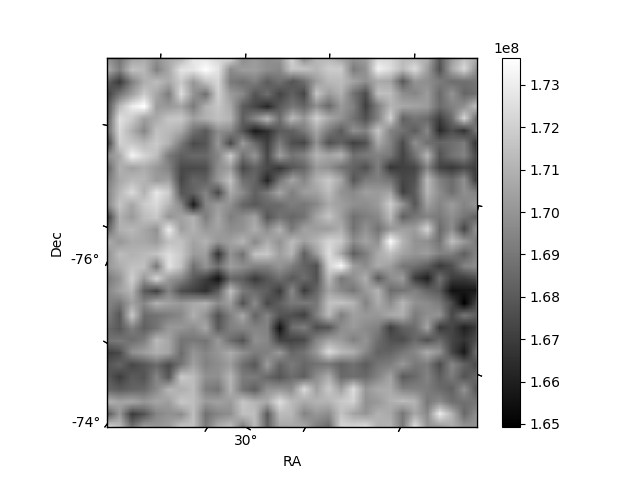
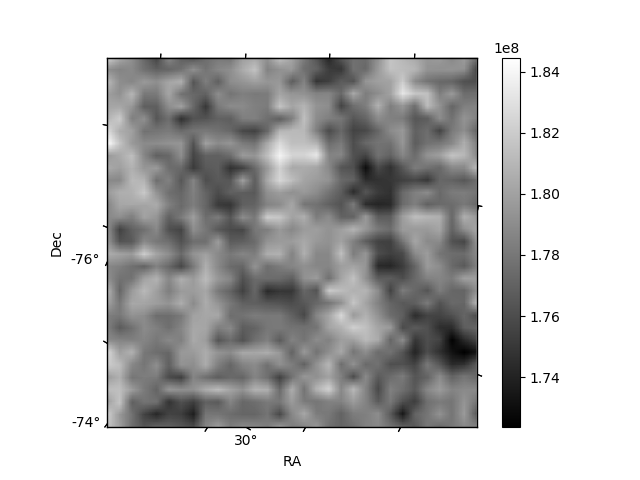
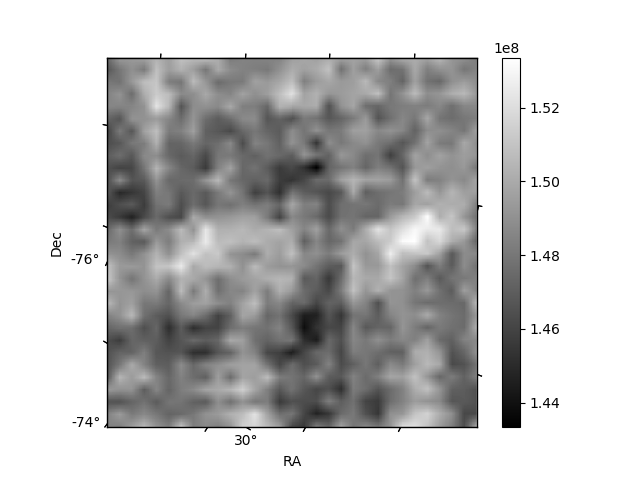
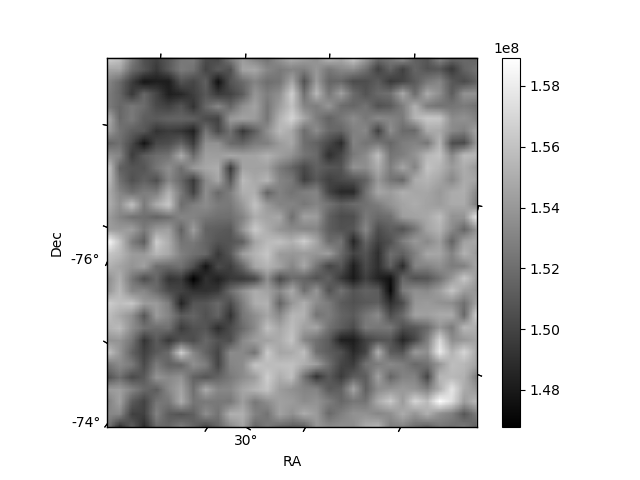
Histogram calculated using DETX and DETY for each event in the final _common_clean file
| Quadrant A | 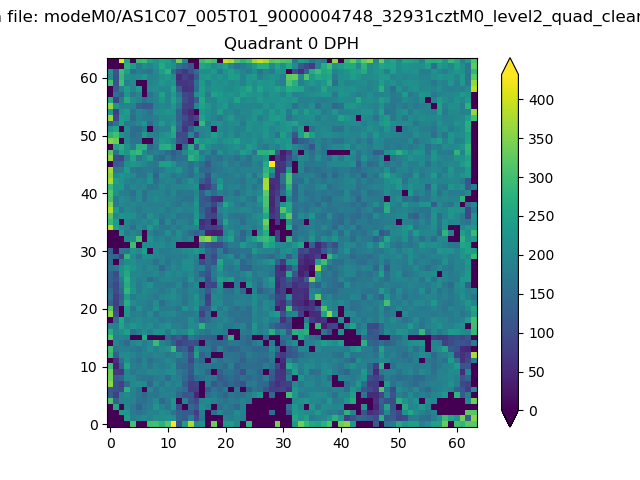 |
 |
Quadrant B |
|---|---|---|---|
| Quadrant D | 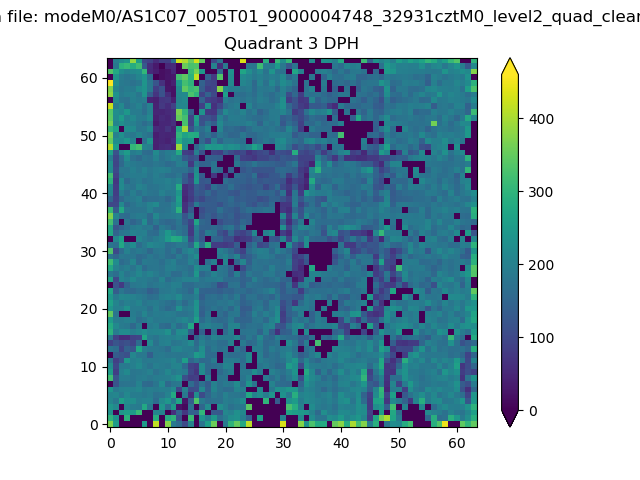 |
 |
Quadrant C |
| Plot type | Count rate plots | Images |
|---|---|---|
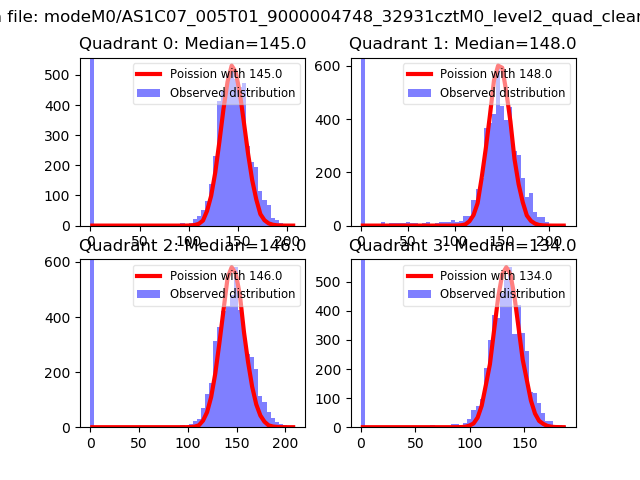
| Comparison with Poisson distribution Blue bars denote a histogram of data divided into 1 sec bins. Red curve is a Poisson curve with rate = median count rate of data. |
 |
 |
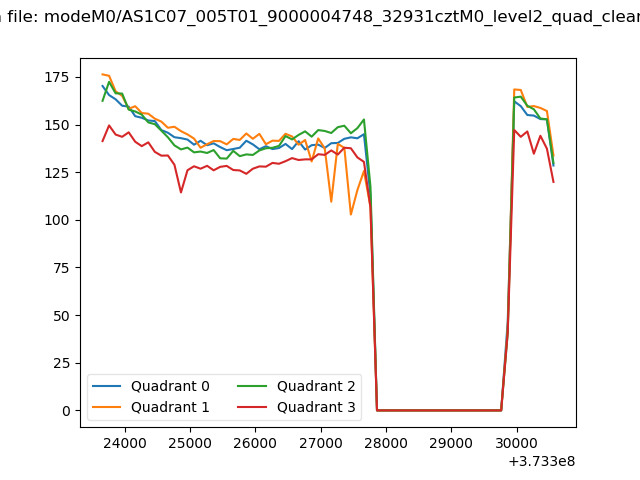
| Quadrant-wise count rates Data is divided into 100 sec bins |
 |
|
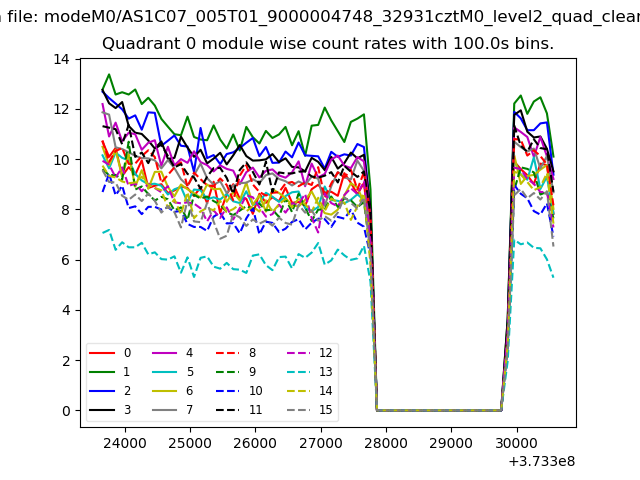
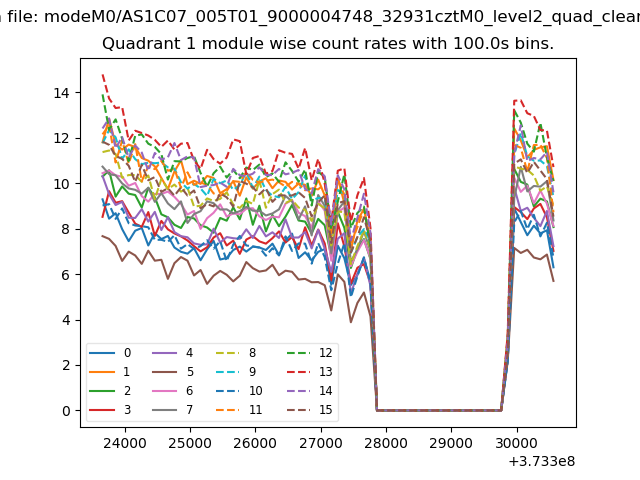
| Module-wise count rates for Quadrant A Data is divided into 100 sec bins |
 |
 |
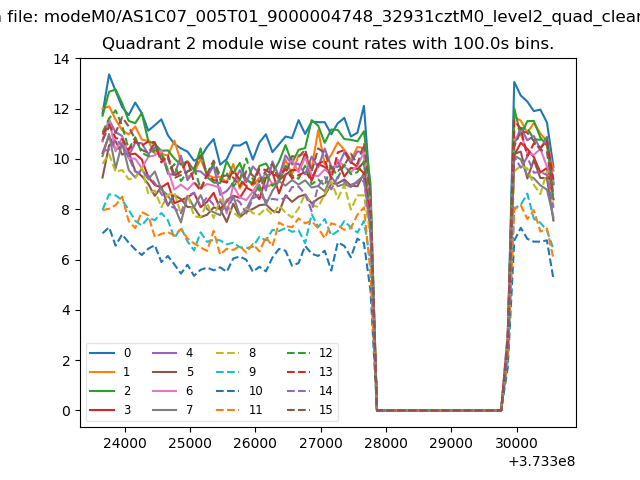
| Module-wise count rates for Quadrant B Data is divided into 100 sec bins |
 |
 |
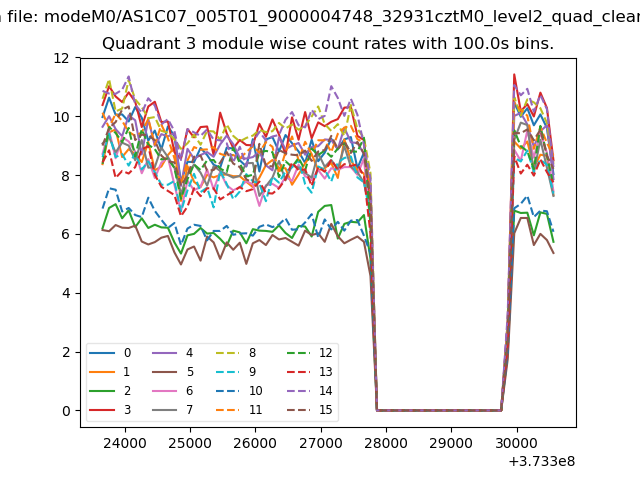
| Module-wise count rates for Quadrant C Data is divided into 100 sec bins |
 |
 |
| Module-wise count rates for Quadrant D Data is divided into 100 sec bins |
 |
 |
| Parameter | Plot |
|---|---|
| CZT HV Monitor | 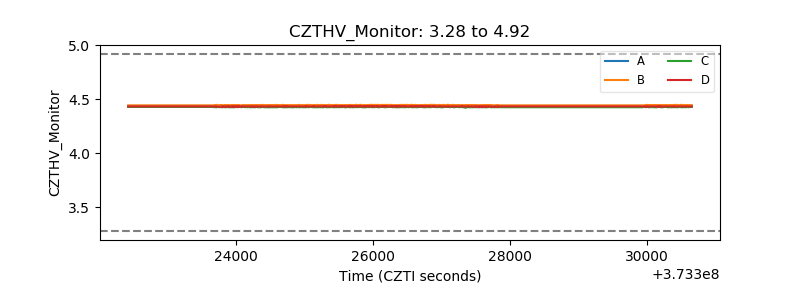 |
| D_VDD |  |
| Temperature 1 | 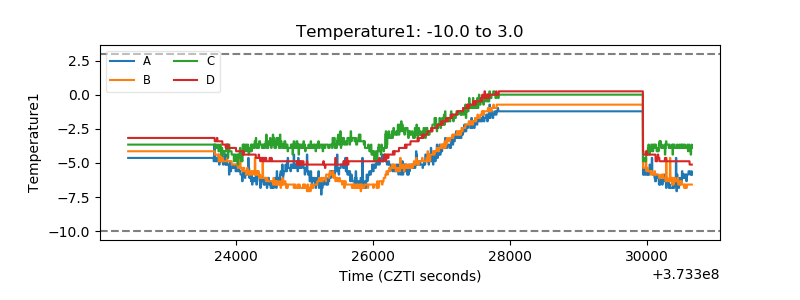 |
| Veto HV Monitor | 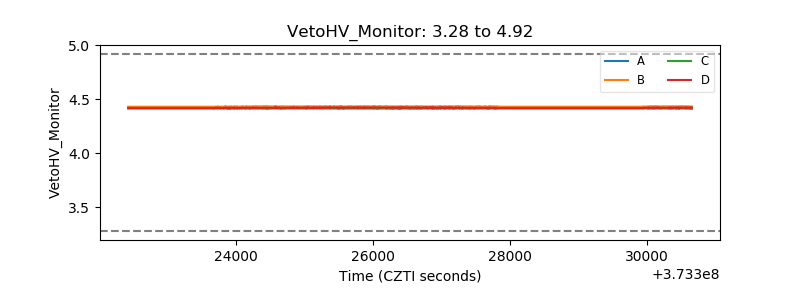 |
| Veto LLD | 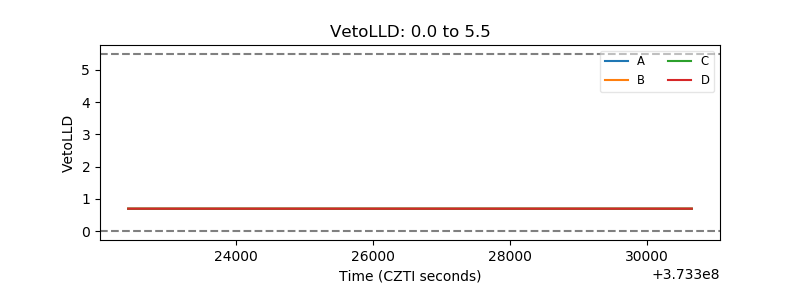 |
| Alpha Counter | 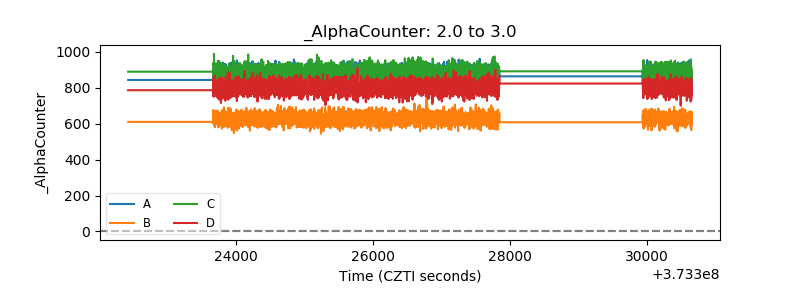 |
| _CPM_Rate | 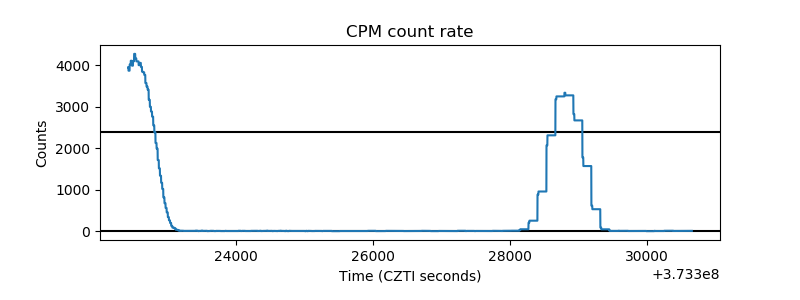 |
| CZT Counter | 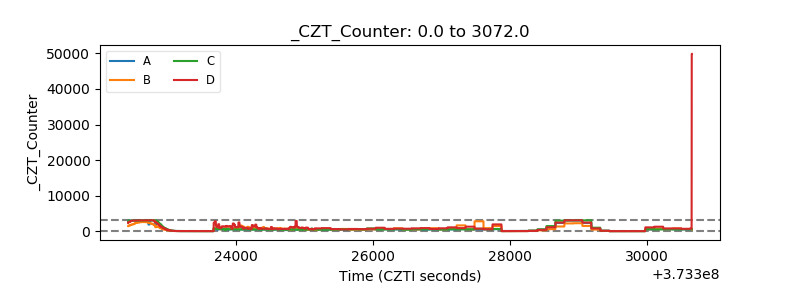 |
| +2.5 Volts monitor | 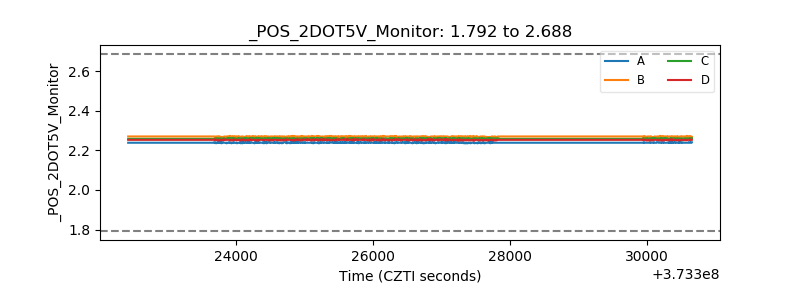 |
| +5 Volts monitor |  |
| _ROLL_ROT | 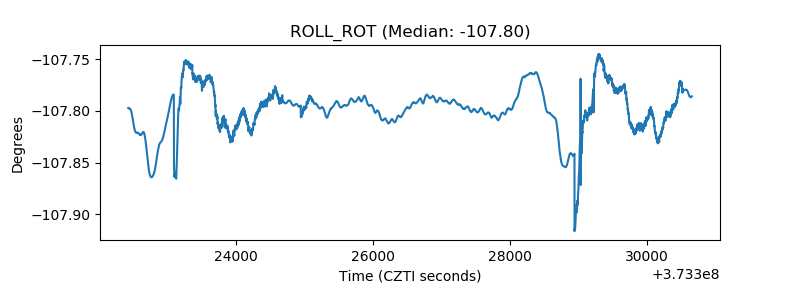 |
| _Roll_DEC | 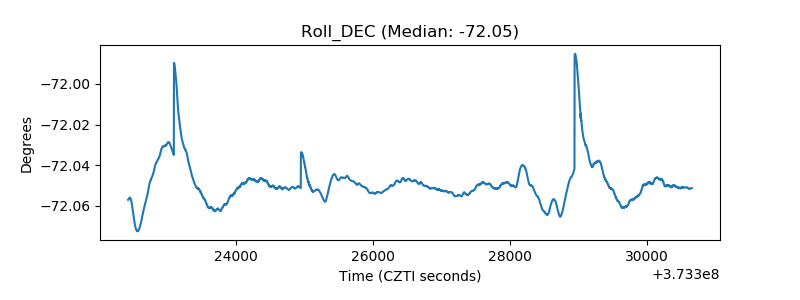 |
| _Roll_RA | 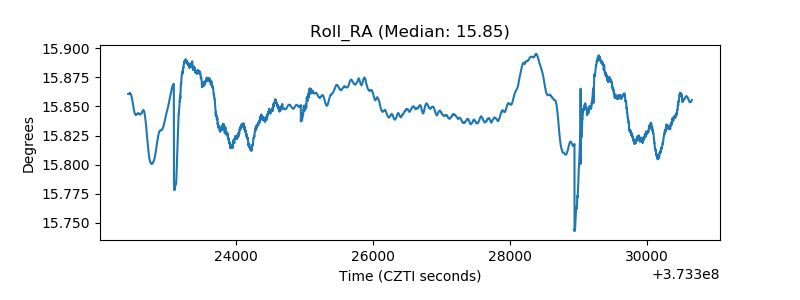 |
| Veto Counter | 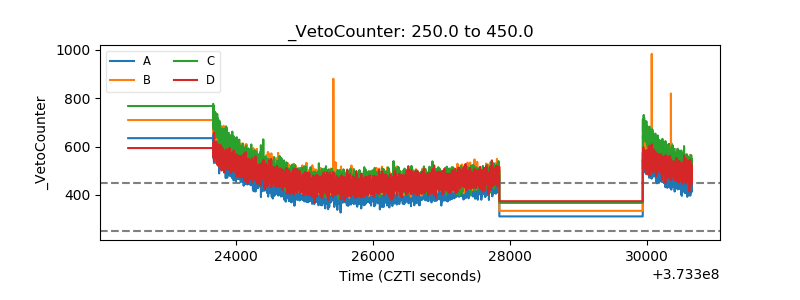 |