| Param | Original file | Final file |
|---|---|---|
| Filename | modeM0/AS1C07_005T01_9000004748_32935cztM0_level2.evt | modeM0/AS1C07_005T01_9000004748_32935cztM0_level2_quad_clean.evt |
| Size (bytes) | 476,953,920 | 104,641,920 |
| Size | 454.9 MB | 99.8 MB |
| Events in quadrant A | 2,625,946 | 710,457 |
| Events in quadrant B | 3,751,363 | 699,197 |
| Events in quadrant C | 2,841,595 | 712,606 |
| Events in quadrant D | 4,842,246 | 651,732 |
| Mode SS | |||
|---|---|---|---|
| Quadrant | BADHDUFLAG | Total packets | Discarded packets |
| A | 0 | 114 | 0 |
| B | 0 | 114 | 0 |
| C | 0 | 114 | 0 |
| D | 0 | 114 | 0 |
| Mode M9 | |||
|---|---|---|---|
| Quadrant | BADHDUFLAG | Total packets | Discarded packets |
| A | 0 | 18 | 0 |
| B | 0 | 18 | 0 |
| C | 0 | 18 | 0 |
| D | 0 | 19 | 0 |
| Mode M0 | |||
|---|---|---|---|
| Quadrant | BADHDUFLAG | Total packets | Discarded packets |
| A | 0 | 11490 | 3 |
| B | 0 | 14734 | 2 |
| C | 0 | 12240 | 2 |
| D | 0 | 18200 | 2 |
| Quadrant | Total seconds | Saturated seconds | Saturation percentage |
|---|---|---|---|
| A | 5651 | 10 | 0.176960% |
| B | 5651 | 377 | 6.671386% |
| C | 5651 | 116 | 2.052734% |
| D | 5651 | 474 | 8.387896% |
Noise dominated data is calculated using 1-second bins in cleaned event files. If a bin has >2000 counts, and if more than 50% of those come from <1% of pixels, then it is considered to be noise-dominated and hence unusable.
| Quadrant | # 1 sec bins | Bins with >0 counts | Bins with >2000 counts | High rate bins dominated by noise | Noise dominated (total time) | Noise dominated (detector-on time) | Marked lightcurve |
|---|---|---|---|---|---|---|---|
| A | 7143 | 5652 | 4 | 4 | 0.06% | 0.07% | 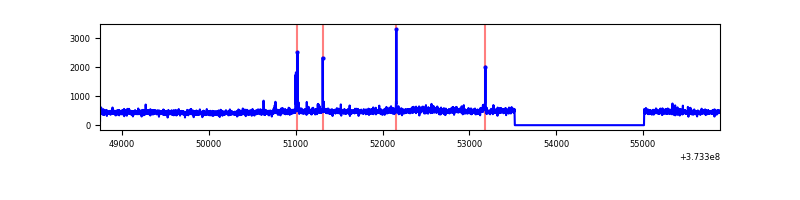 |
| B | 7143 | 5652 | 241 | 241 | 3.37% | 4.26% | 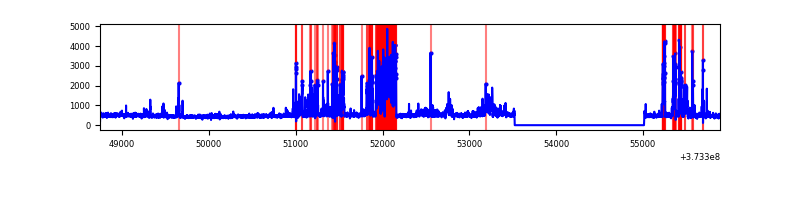 |
| C | 7143 | 5652 | 88 | 88 | 1.23% | 1.56% | 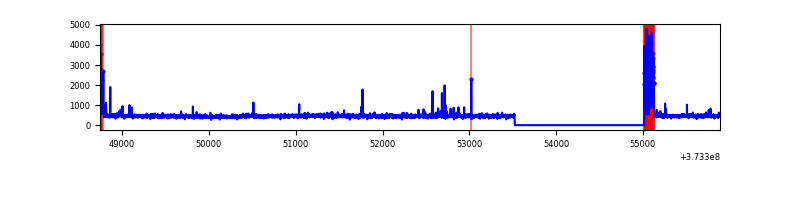 |
| D | 7143 | 5652 | 382 | 382 | 5.35% | 6.76% | 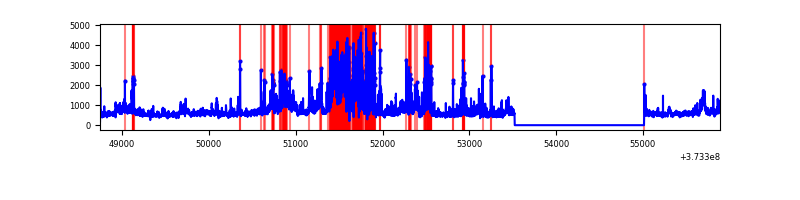 |
Top three noisy pixels from each quadrant. If the there are fewer than three noisy pixels in the level2.evt file, extra rows are filled as -1
| Pixel properties | Quadrant properties | ||||||
|---|---|---|---|---|---|---|---|
| Quadrant | DetID | PixID | Counts | Sigma | Mean | Median | Sigma |
| A | 11 | 29 | 55067 | 415.62 | 649 | 635 | 131.0 |
| A | 0 | 191 | 25309 | 188.4 | 649 | 635 | 131.0 |
| A | 13 | 6 | 13708 | 99.82 | 649 | 635 | 131.0 |
| B | 5 | 172 | 905199 | 7590.38 | 632 | 616 | 119.2 |
| B | 0 | 199 | 91041 | 758.76 | 632 | 616 | 119.2 |
| B | 0 | 189 | 69392 | 577.1 | 632 | 616 | 119.2 |
| C | 0 | 10 | 310244 | 2139.6 | 630 | 634 | 144.7 |
| C | 1 | 241 | 26986 | 182.11 | 630 | 634 | 144.7 |
| C | 3 | 233 | 12887 | 84.68 | 630 | 634 | 144.7 |
| D | 12 | 233 | 939430 | 6154.05 | 608 | 593 | 152.6 |
| D | 8 | 195 | 810000 | 5305.64 | 608 | 593 | 152.6 |
| D | 2 | 250 | 210497 | 1375.91 | 608 | 593 | 152.6 |
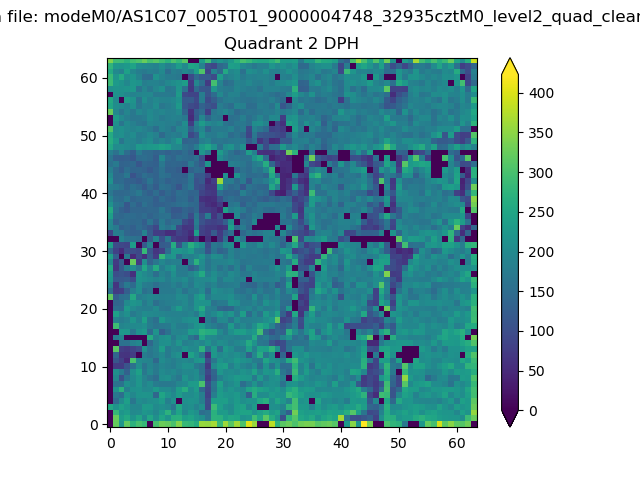
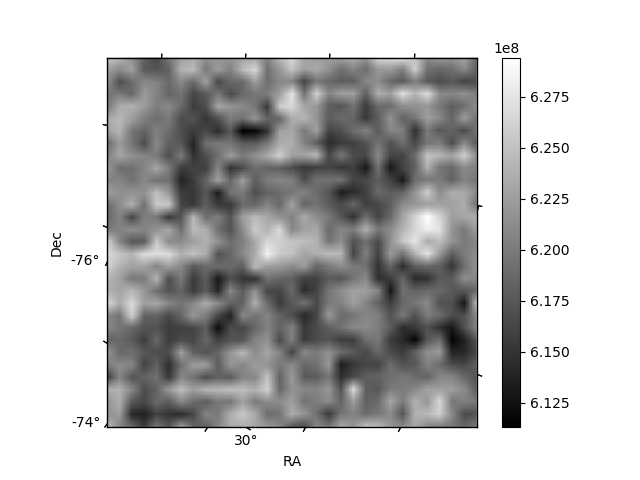
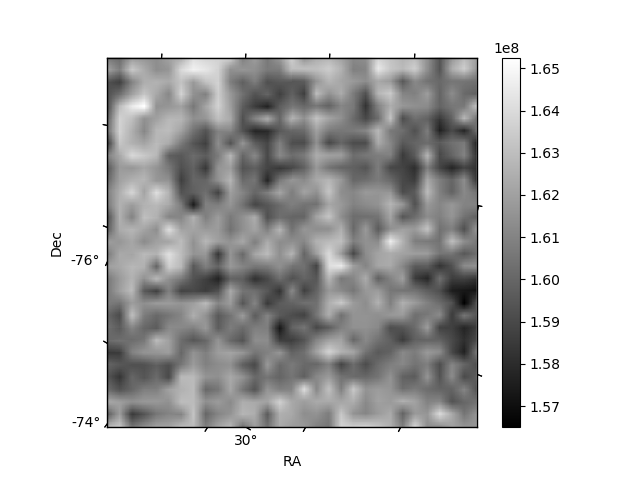
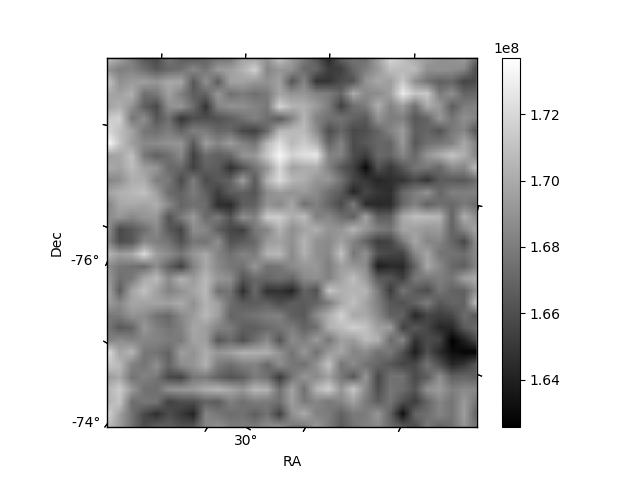
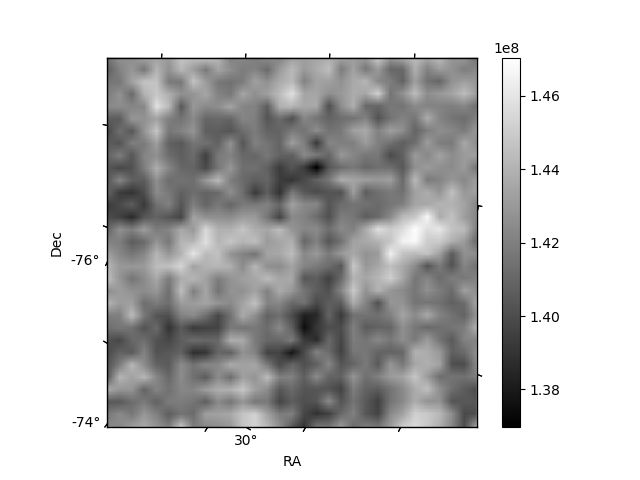
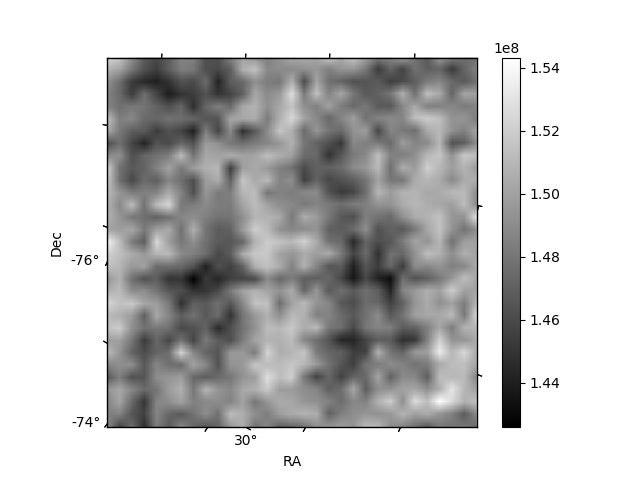
Histogram calculated using DETX and DETY for each event in the final _common_clean file
| Quadrant A | 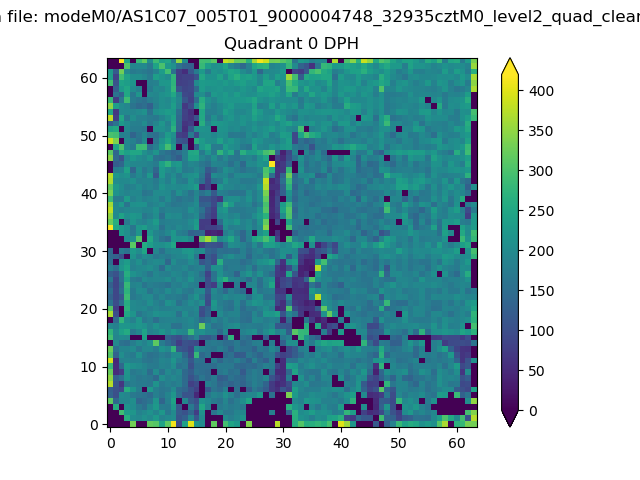 |
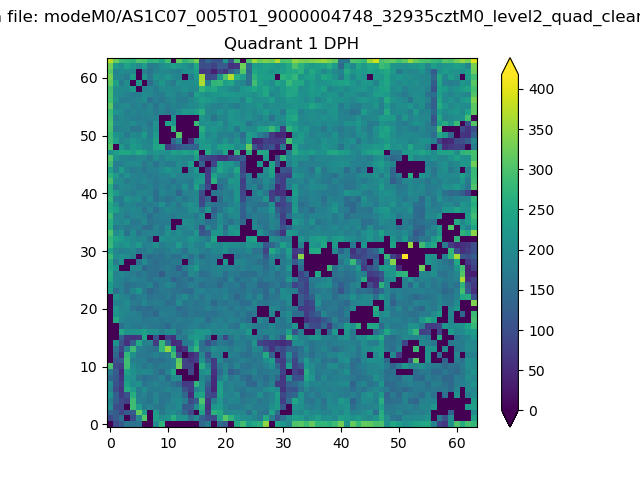 |
Quadrant B |
|---|---|---|---|
| Quadrant D | 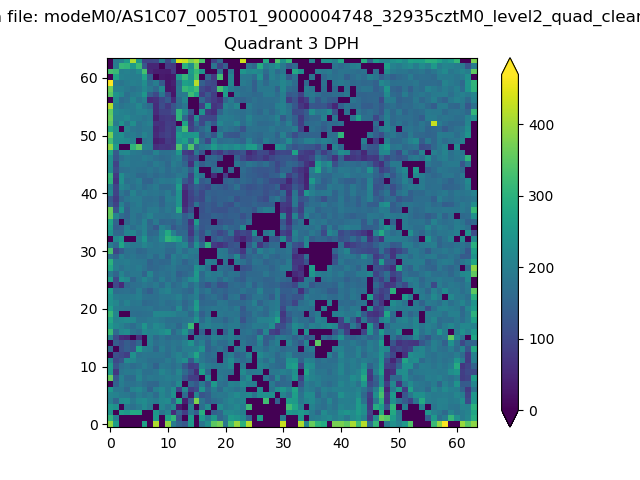 |
 |
Quadrant C |
| Plot type | Count rate plots | Images |
|---|---|---|
| Comparison with Poisson distribution Blue bars denote a histogram of data divided into 1 sec bins. Red curve is a Poisson curve with rate = median count rate of data. |
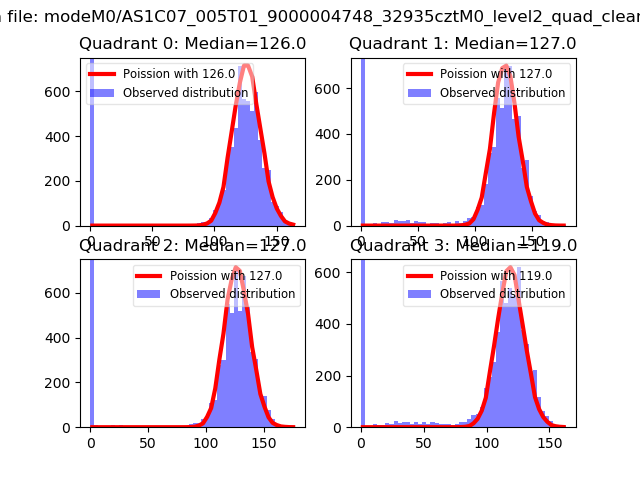 |
 |
| Quadrant-wise count rates Data is divided into 100 sec bins |
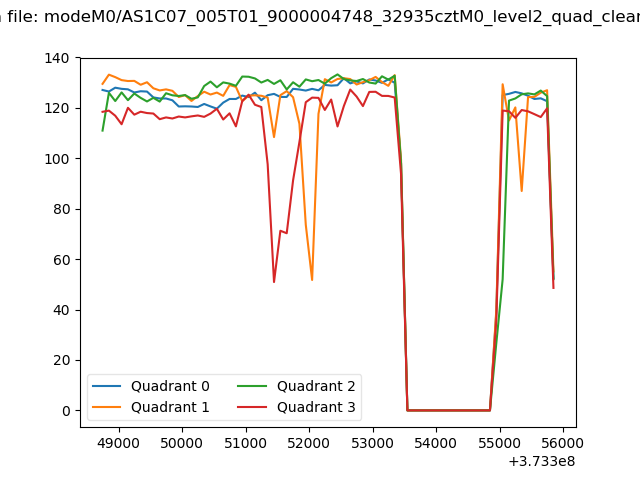 |
|
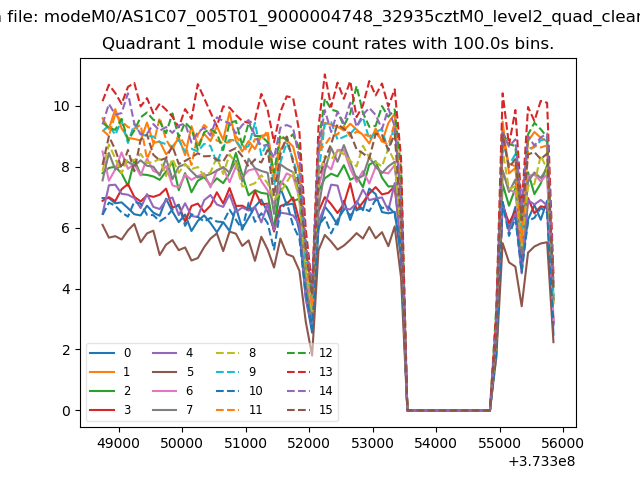
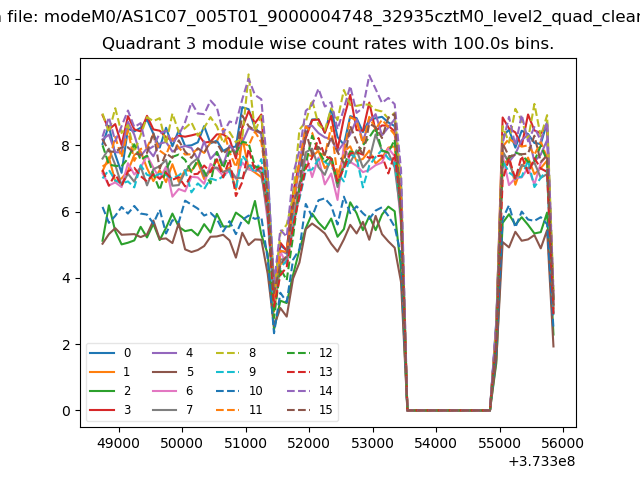
| Module-wise count rates for Quadrant A Data is divided into 100 sec bins |
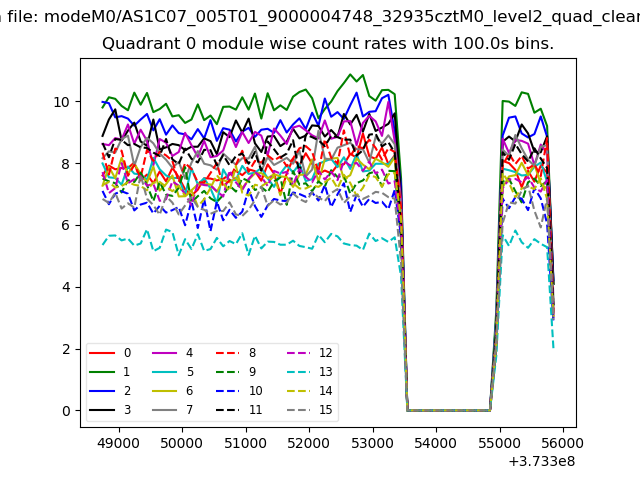 |
 |
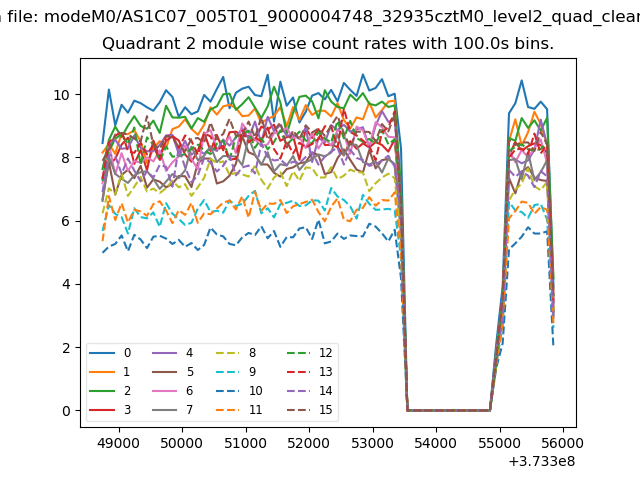
| Module-wise count rates for Quadrant B Data is divided into 100 sec bins |
 |
 |
| Module-wise count rates for Quadrant C Data is divided into 100 sec bins |
 |
 |
| Module-wise count rates for Quadrant D Data is divided into 100 sec bins |
 |
 |
| Parameter | Plot |
|---|---|
| CZT HV Monitor | 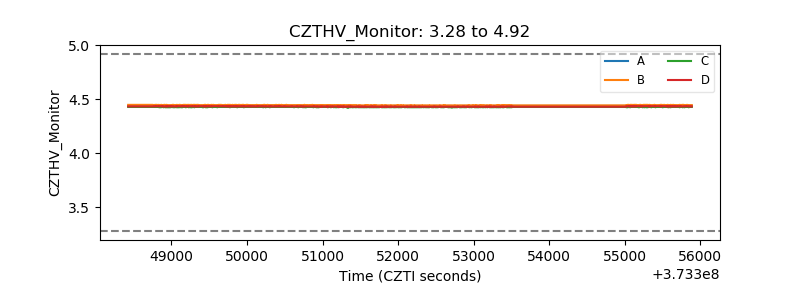 |
| D_VDD | 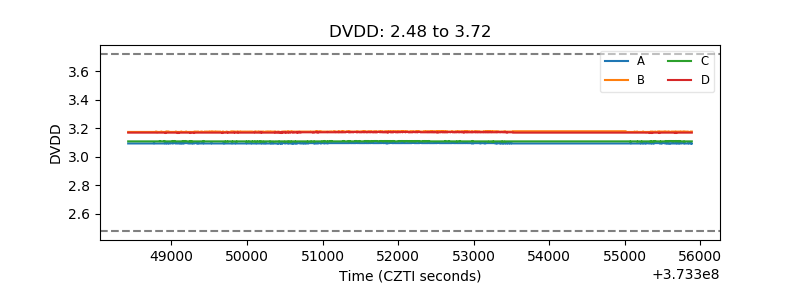 |
| Temperature 1 | 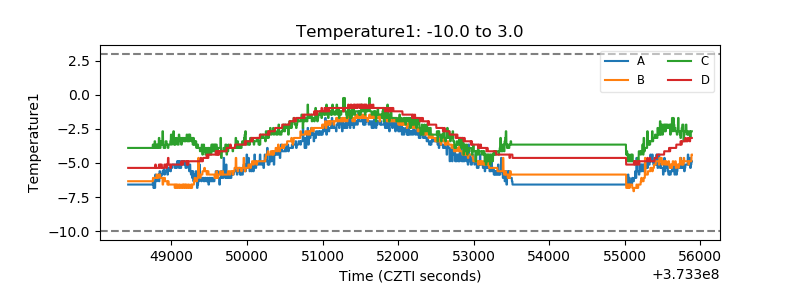 |
| Veto HV Monitor |  |
| Veto LLD | 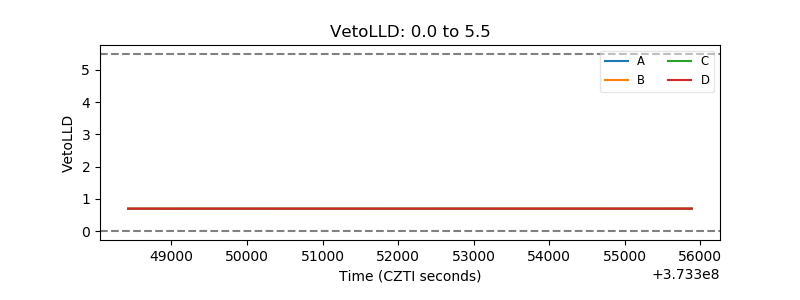 |
| Alpha Counter | 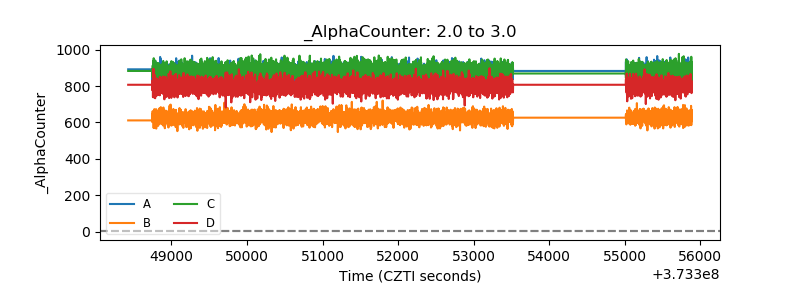 |
| _CPM_Rate | 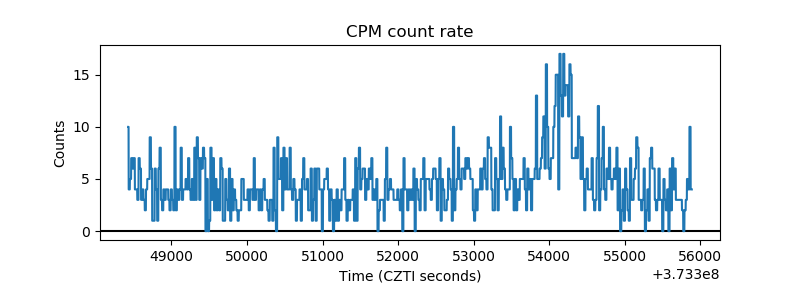 |
| CZT Counter | 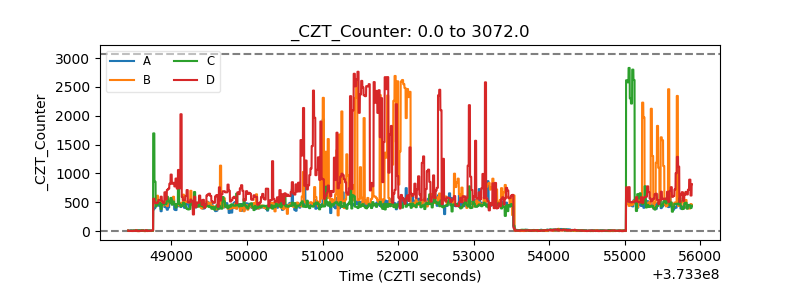 |
| +2.5 Volts monitor |  |
| +5 Volts monitor |  |
| _ROLL_ROT | 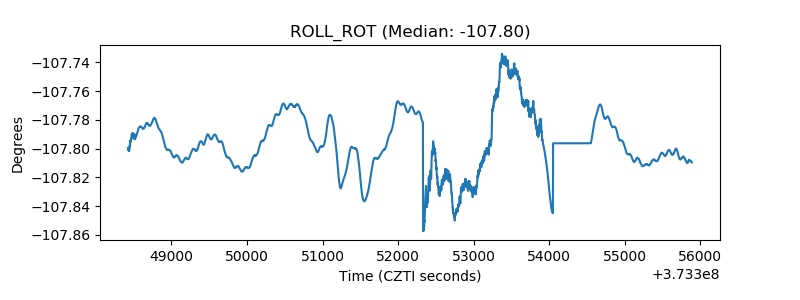 |
| _Roll_DEC | 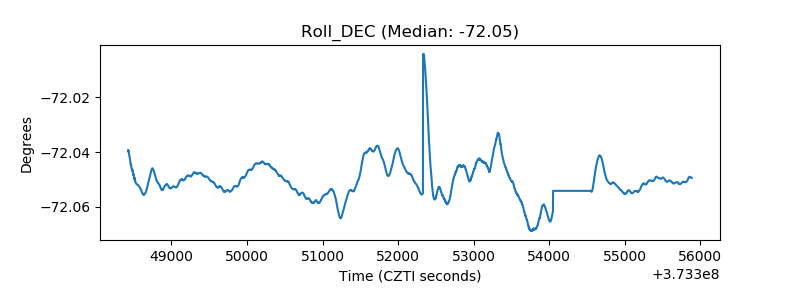 |
| _Roll_RA | 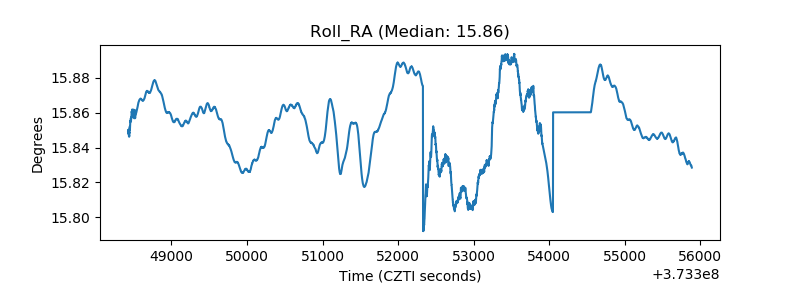 |
| Veto Counter | 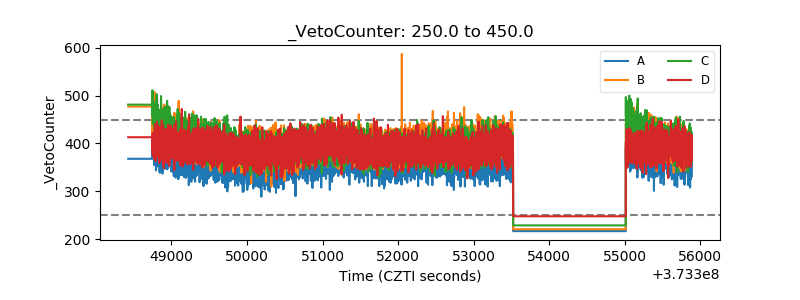 |