| Param | Original file | Final file |
|---|---|---|
| Filename | modeM0/AS1C07_005T01_9000004748_32940cztM0_level2.evt | modeM0/AS1C07_005T01_9000004748_32940cztM0_level2_quad_clean.evt |
| Size (bytes) | 2,048,492,160 | 367,338,240 |
| Size | 1.9 GB | 350.3 MB |
| Events in quadrant A | 9,266,852 | 2,534,428 |
| Events in quadrant B | 15,782,322 | 2,436,235 |
| Events in quadrant C | 9,738,358 | 2,548,477 |
| Events in quadrant D | 25,876,451 | 2,197,943 |
| Mode SS | |||
|---|---|---|---|
| Quadrant | BADHDUFLAG | Total packets | Discarded packets |
| A | 0 | 418 | 0 |
| B | 0 | 418 | 0 |
| C | 0 | 418 | 0 |
| D | 0 | 418 | 0 |
| Mode M9 | |||
|---|---|---|---|
| Quadrant | BADHDUFLAG | Total packets | Discarded packets |
| A | 0 | 56 | 0 |
| B | 0 | 56 | 0 |
| C | 0 | 56 | 0 |
| D | 0 | 56 | 0 |
| Mode M0 | |||
|---|---|---|---|
| Quadrant | BADHDUFLAG | Total packets | Discarded packets |
| A | 0 | 41232 | 6 |
| B | 0 | 60216 | 5 |
| C | 0 | 42941 | 5 |
| D | 0 | 91419 | 5 |
| Quadrant | Total seconds | Saturated seconds | Saturation percentage |
|---|---|---|---|
| A | 20437 | 19 | 0.092969% |
| B | 20437 | 1988 | 9.727455% |
| C | 20437 | 140 | 0.685032% |
| D | 20437 | 3682 | 18.016343% |
Noise dominated data is calculated using 1-second bins in cleaned event files. If a bin has >2000 counts, and if more than 50% of those come from <1% of pixels, then it is considered to be noise-dominated and hence unusable.
| Quadrant | # 1 sec bins | Bins with >0 counts | Bins with >2000 counts | High rate bins dominated by noise | Noise dominated (total time) | Noise dominated (detector-on time) | Marked lightcurve |
|---|---|---|---|---|---|---|---|
| A | 26109 | 20440 | 5 | 5 | 0.02% | 0.02% | 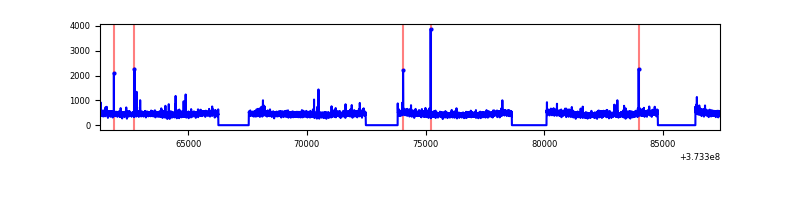 |
| B | 26109 | 20440 | 1336 | 1336 | 5.12% | 6.54% | 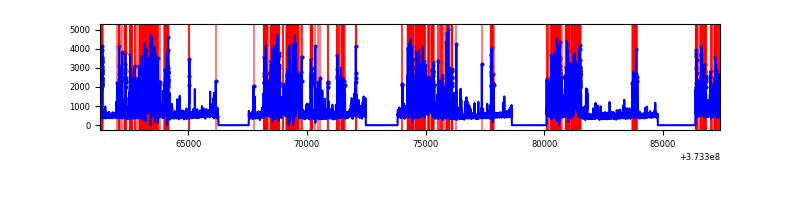 |
| C | 26109 | 20440 | 114 | 114 | 0.44% | 0.56% | 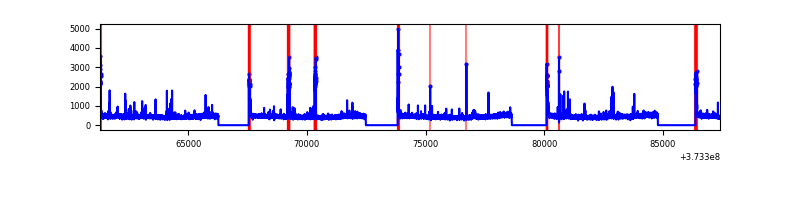 |
| D | 26109 | 20440 | 3372 | 3372 | 12.92% | 16.50% | 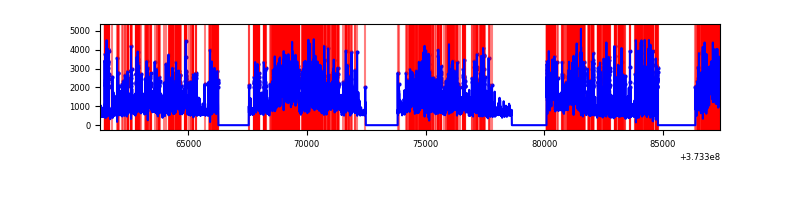 |
Top three noisy pixels from each quadrant. If the there are fewer than three noisy pixels in the level2.evt file, extra rows are filled as -1
| Pixel properties | Quadrant properties | ||||||
|---|---|---|---|---|---|---|---|
| Quadrant | DetID | PixID | Counts | Sigma | Mean | Median | Sigma |
| A | 0 | 159 | 84787 | 175.72 | 2344 | 2297 | 469.4 |
| A | 0 | 191 | 47194 | 95.64 | 2344 | 2297 | 469.4 |
| A | 13 | 254 | 39139 | 78.48 | 2344 | 2297 | 469.4 |
| B | 5 | 172 | 4640642 | 10983.83 | 2252 | 2196 | 422.3 |
| B | 5 | 200 | 489370 | 1153.63 | 2252 | 2196 | 422.3 |
| B | 0 | 199 | 370638 | 872.47 | 2252 | 2196 | 422.3 |
| C | 0 | 10 | 589613 | 1123.74 | 2274 | 2289 | 522.7 |
| C | 1 | 241 | 98663 | 184.39 | 2274 | 2289 | 522.7 |
| C | 3 | 233 | 95267 | 177.9 | 2274 | 2289 | 522.7 |
| D | 8 | 195 | 6376444 | 11822.27 | 2107 | 2058 | 539.2 |
| D | 12 | 227 | 3036306 | 5627.47 | 2107 | 2058 | 539.2 |
| D | 7 | 80 | 2491131 | 4616.36 | 2107 | 2058 | 539.2 |
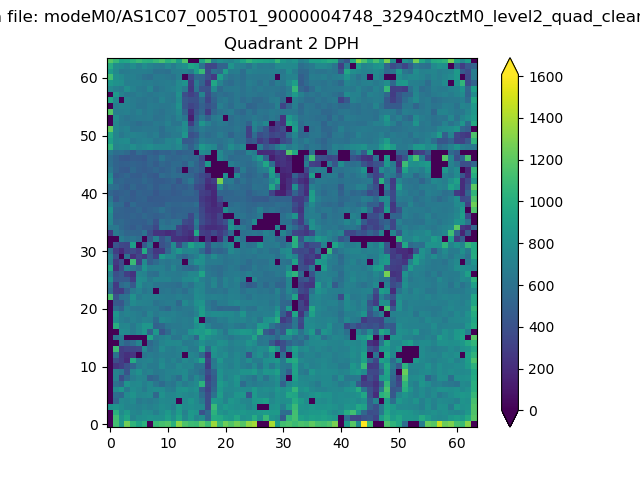
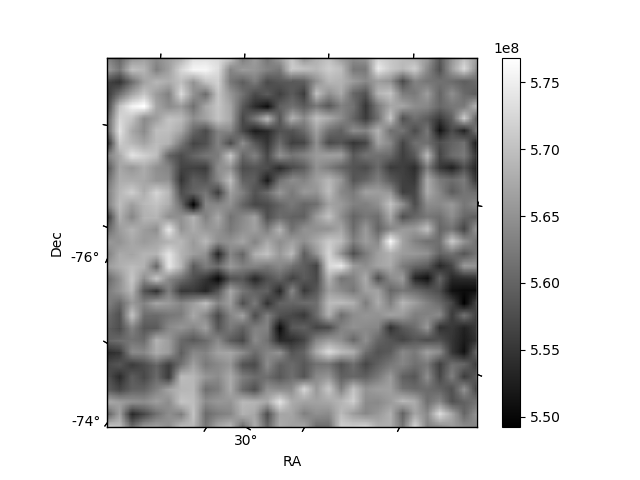
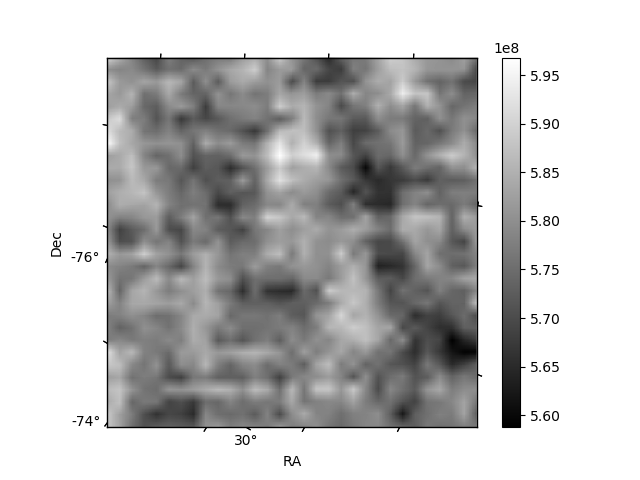
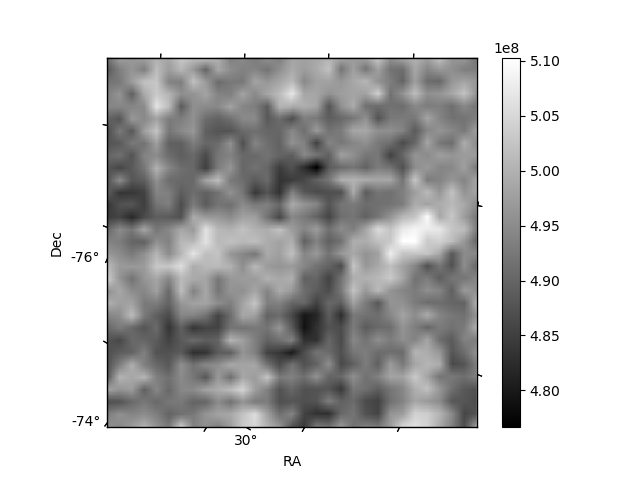
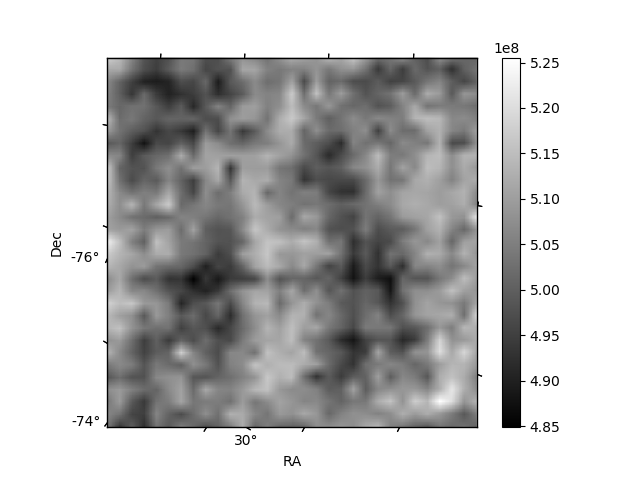
Histogram calculated using DETX and DETY for each event in the final _common_clean file
| Quadrant A | 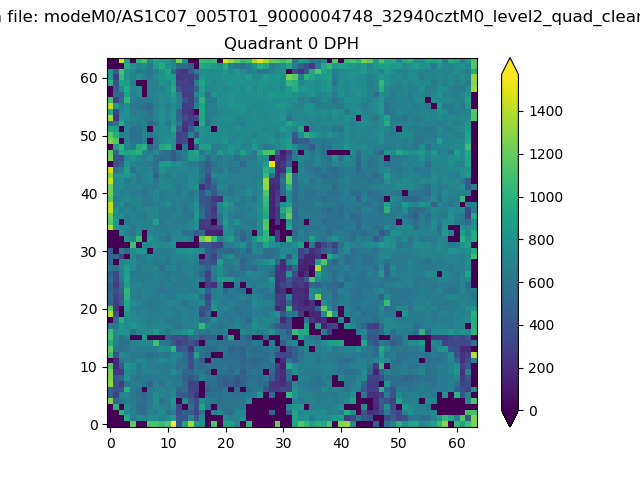 |
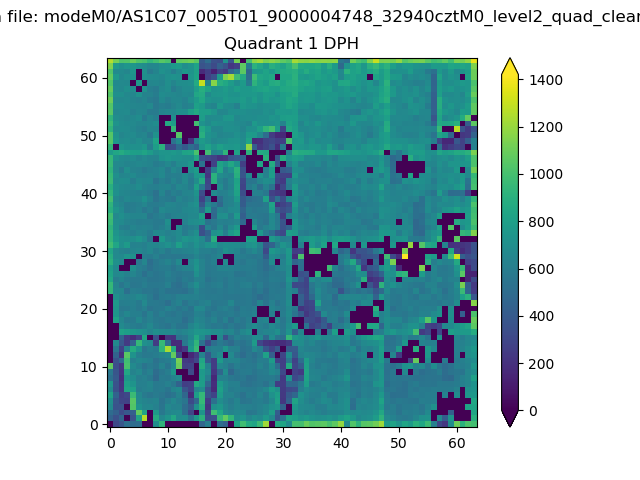 |
Quadrant B |
|---|---|---|---|
| Quadrant D | 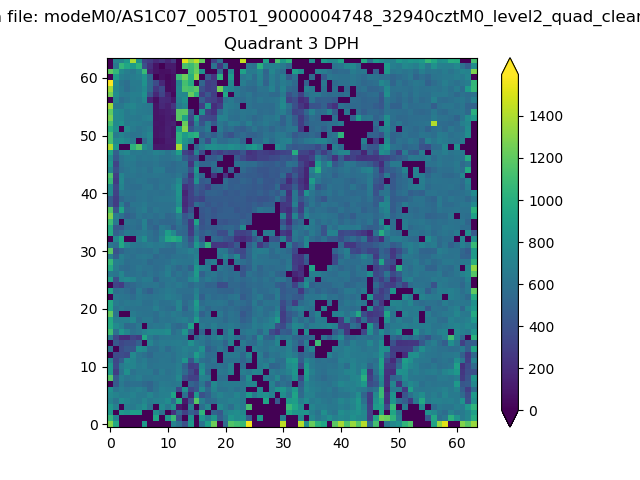 |
 |
Quadrant C |
| Plot type | Count rate plots | Images |
|---|---|---|
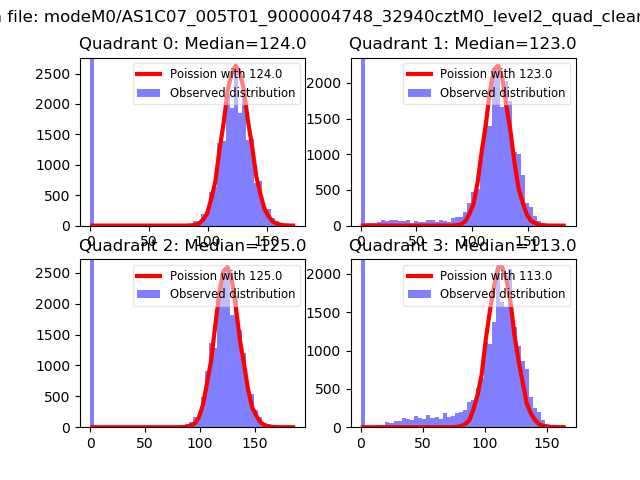
| Comparison with Poisson distribution Blue bars denote a histogram of data divided into 1 sec bins. Red curve is a Poisson curve with rate = median count rate of data. |
 |
 |
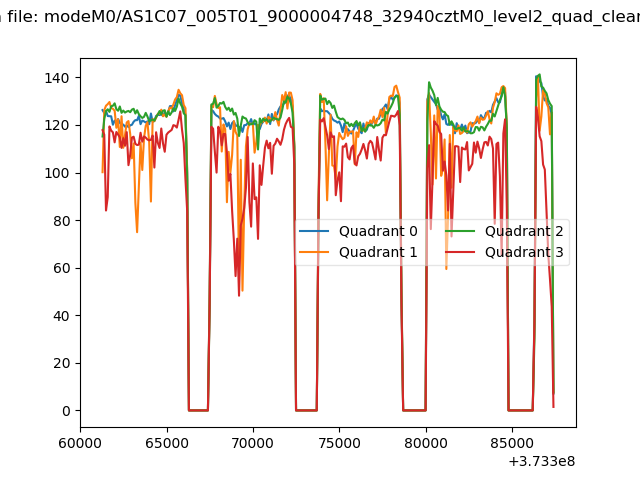
| Quadrant-wise count rates Data is divided into 100 sec bins |
 |
|
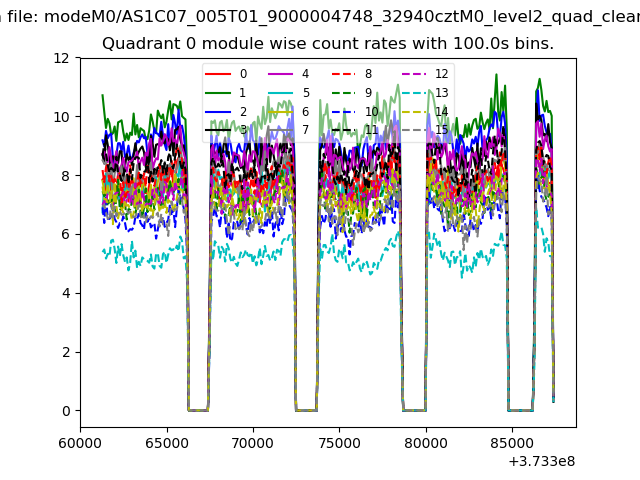
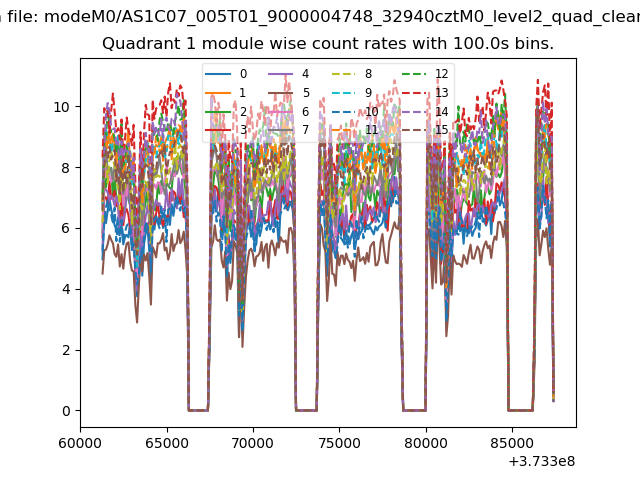
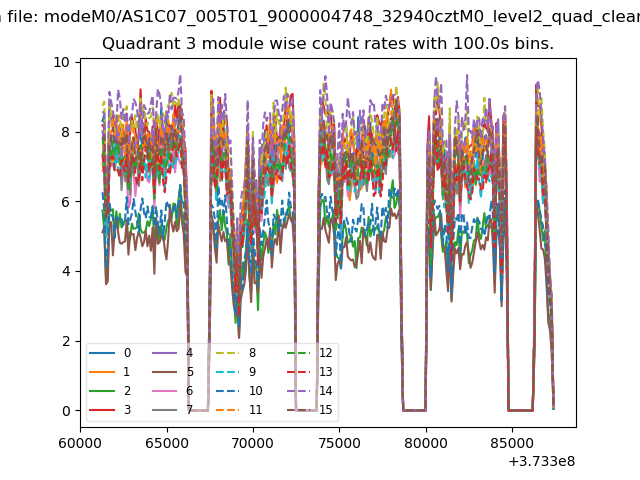
| Module-wise count rates for Quadrant A Data is divided into 100 sec bins |
 |
 |
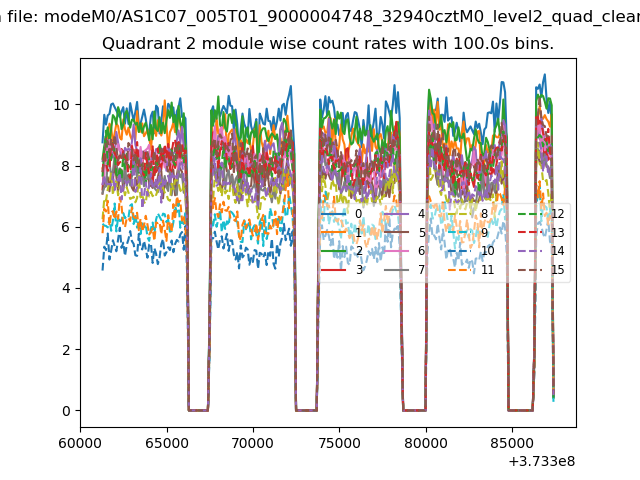
| Module-wise count rates for Quadrant B Data is divided into 100 sec bins |
 |
 |
| Module-wise count rates for Quadrant C Data is divided into 100 sec bins |
 |
 |
| Module-wise count rates for Quadrant D Data is divided into 100 sec bins |
 |
 |
| Parameter | Plot |
|---|---|
| CZT HV Monitor | 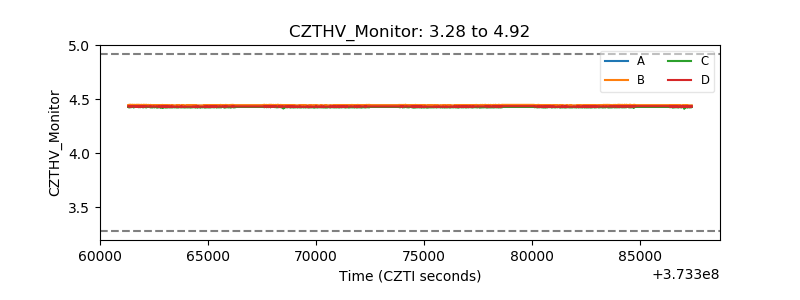 |
| D_VDD | 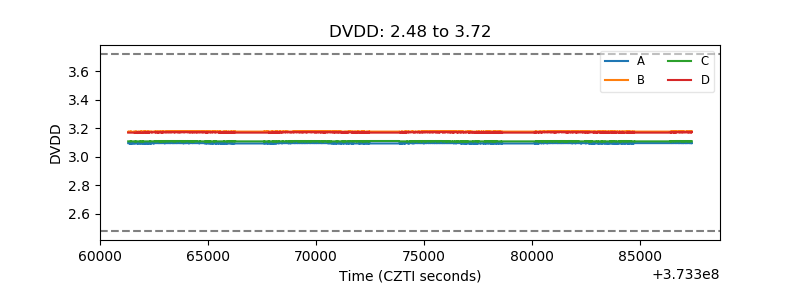 |
| Temperature 1 | 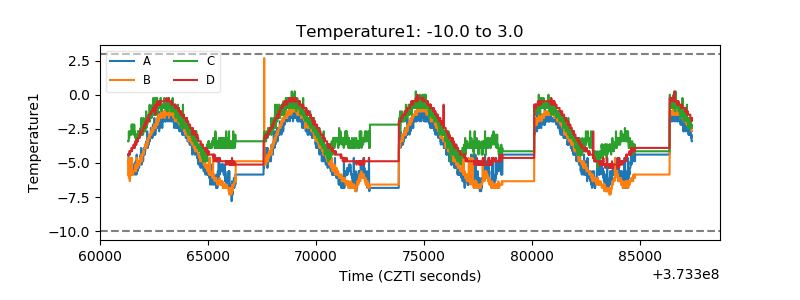 |
| Veto HV Monitor |  |
| Veto LLD | 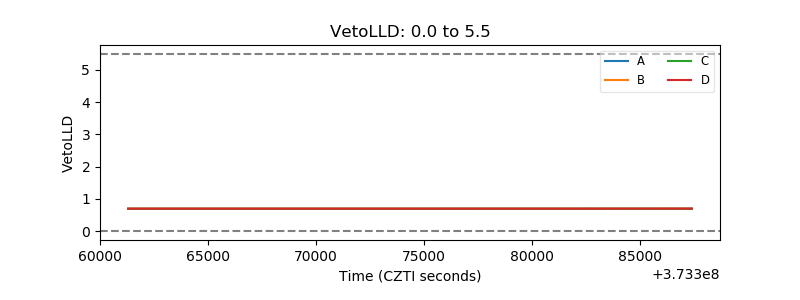 |
| Alpha Counter | 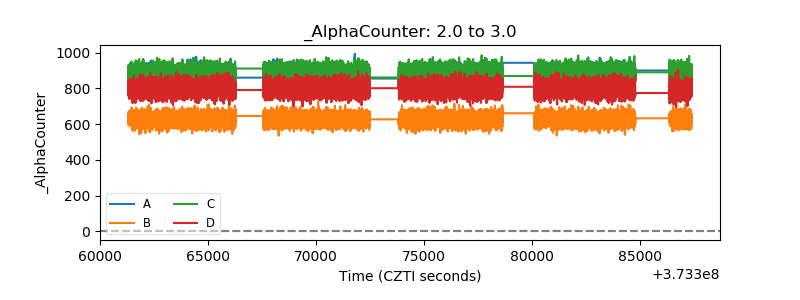 |
| _CPM_Rate | 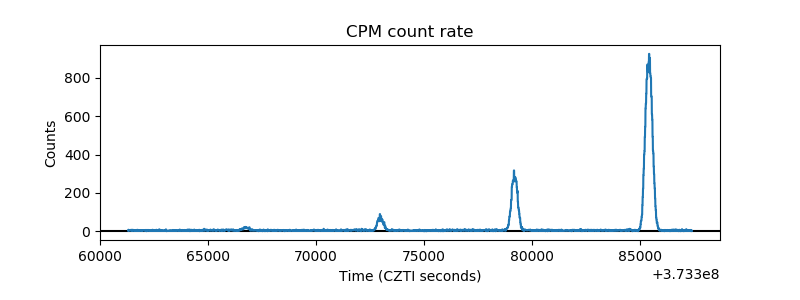 |
| CZT Counter | 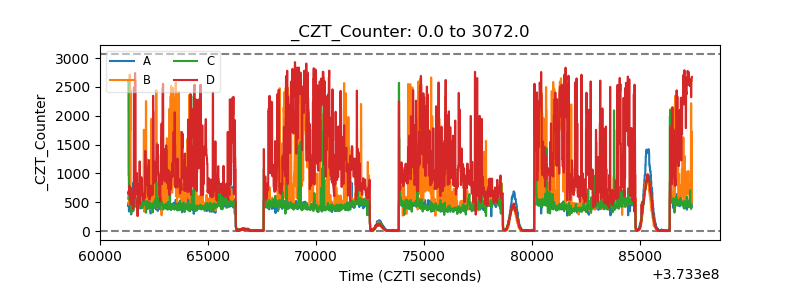 |
| +2.5 Volts monitor |  |
| +5 Volts monitor |  |
| _ROLL_ROT | 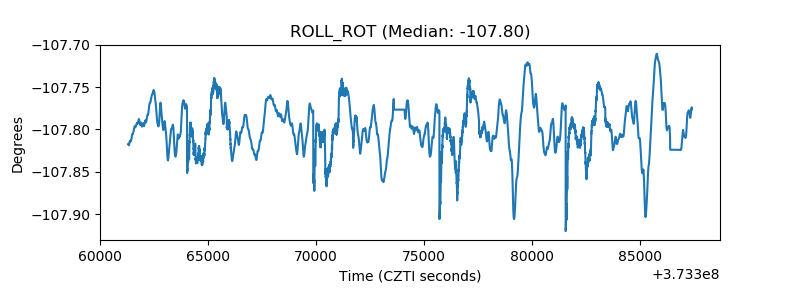 |
| _Roll_DEC | 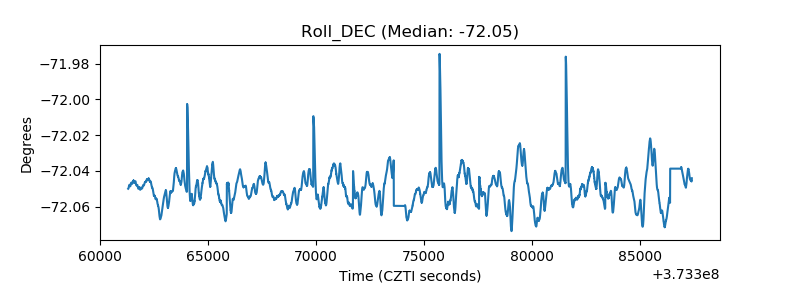 |
| _Roll_RA | 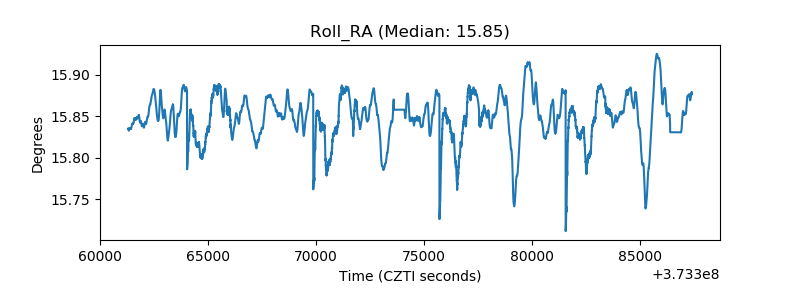 |
| Veto Counter | 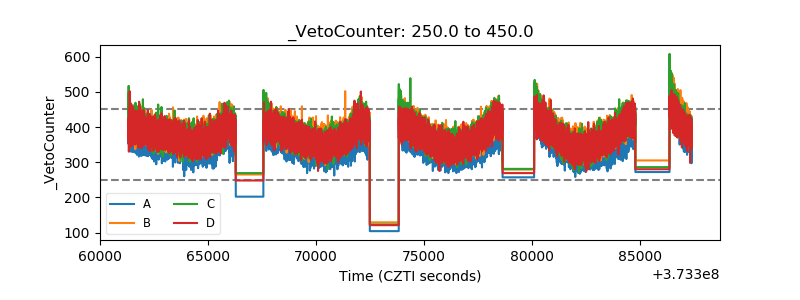 |