| Param | Original file | Final file |
|---|---|---|
| Filename | modeM0/AS1C07_005T01_9000004748_32941cztM0_level2.evt | modeM0/AS1C07_005T01_9000004748_32941cztM0_level2_quad_clean.evt |
| Size (bytes) | 623,635,200 | 100,509,120 |
| Size | 594.7 MB | 95.9 MB |
| Events in quadrant A | 2,556,213 | 719,223 |
| Events in quadrant B | 4,435,490 | 682,230 |
| Events in quadrant C | 2,687,137 | 709,301 |
| Events in quadrant D | 8,832,799 | 544,251 |
| Mode SS | |||
|---|---|---|---|
| Quadrant | BADHDUFLAG | Total packets | Discarded packets |
| A | 0 | 112 | 0 |
| B | 0 | 112 | 0 |
| C | 0 | 112 | 0 |
| D | 0 | 112 | 0 |
| Mode M9 | |||
|---|---|---|---|
| Quadrant | BADHDUFLAG | Total packets | Discarded packets |
| A | 0 | 18 | 0 |
| B | 0 | 18 | 0 |
| C | 0 | 18 | 0 |
| D | 0 | 19 | 0 |
| Mode M0 | |||
|---|---|---|---|
| Quadrant | BADHDUFLAG | Total packets | Discarded packets |
| A | 0 | 11216 | 3 |
| B | 0 | 16886 | 2 |
| C | 0 | 11808 | 2 |
| D | 0 | 30150 | 2 |
| Quadrant | Total seconds | Saturated seconds | Saturation percentage |
|---|---|---|---|
| A | 5544 | 4 | 0.072150% |
| B | 5544 | 615 | 11.093074% |
| C | 5544 | 73 | 1.316739% |
| D | 5544 | 1957 | 35.299423% |
Noise dominated data is calculated using 1-second bins in cleaned event files. If a bin has >2000 counts, and if more than 50% of those come from <1% of pixels, then it is considered to be noise-dominated and hence unusable.
| Quadrant | # 1 sec bins | Bins with >0 counts | Bins with >2000 counts | High rate bins dominated by noise | Noise dominated (total time) | Noise dominated (detector-on time) | Marked lightcurve |
|---|---|---|---|---|---|---|---|
| A | 7247 | 5545 | 0 | 0 | 0.00% | 0.00% | 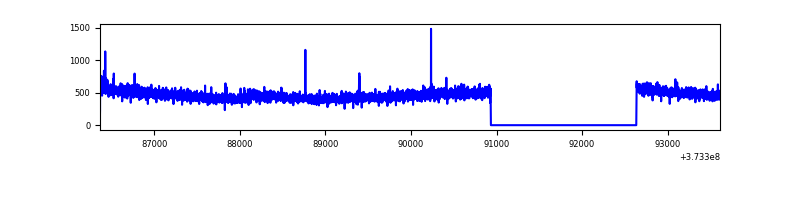 |
| B | 7247 | 5545 | 438 | 438 | 6.04% | 7.90% | 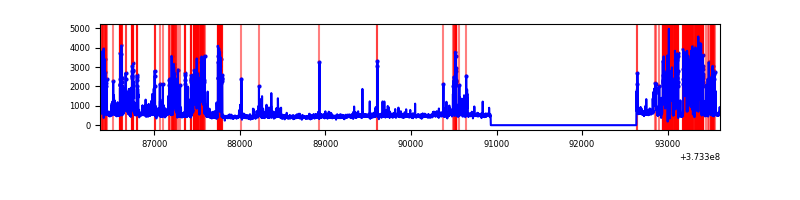 |
| C | 7247 | 5545 | 57 | 57 | 0.79% | 1.03% | 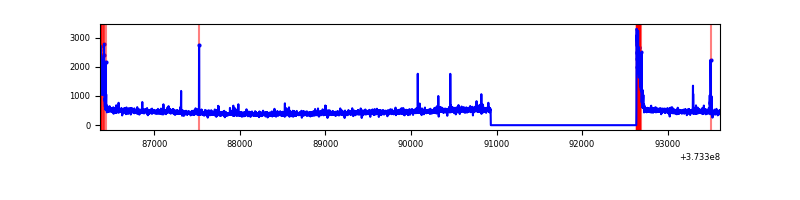 |
| D | 7247 | 5544 | 1736 | 1736 | 23.95% | 31.31% | 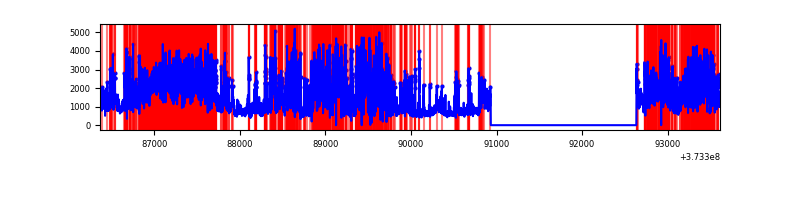 |
Top three noisy pixels from each quadrant. If the there are fewer than three noisy pixels in the level2.evt file, extra rows are filled as -1
| Pixel properties | Quadrant properties | ||||||
|---|---|---|---|---|---|---|---|
| Quadrant | DetID | PixID | Counts | Sigma | Mean | Median | Sigma |
| A | 0 | 159 | 33544 | 249.81 | 647 | 634 | 131.7 |
| A | 13 | 254 | 10991 | 78.62 | 647 | 634 | 131.7 |
| A | 13 | 6 | 10887 | 77.83 | 647 | 634 | 131.7 |
| B | 5 | 200 | 998743 | 8440.02 | 619 | 603 | 118.3 |
| B | 5 | 172 | 671193 | 5670.34 | 619 | 603 | 118.3 |
| B | 0 | 189 | 105137 | 883.91 | 619 | 603 | 118.3 |
| C | 0 | 10 | 197427 | 1375.41 | 620 | 625 | 143.1 |
| C | 1 | 241 | 33040 | 226.54 | 620 | 625 | 143.1 |
| C | 14 | 67 | 28709 | 196.27 | 620 | 625 | 143.1 |
| D | 7 | 80 | 1726696 | 12812.43 | 520 | 506 | 134.7 |
| D | 2 | 250 | 1334465 | 9901.14 | 520 | 506 | 134.7 |
| D | 8 | 195 | 1277527 | 9478.53 | 520 | 506 | 134.7 |
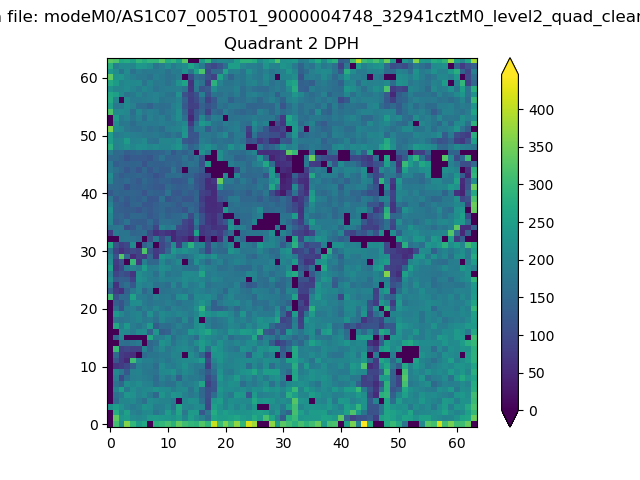
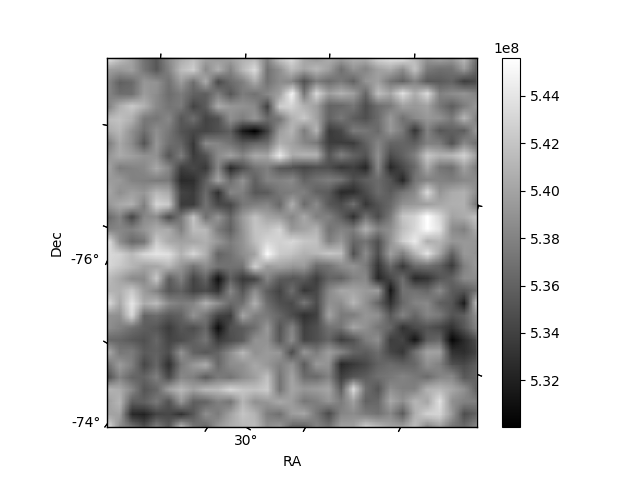
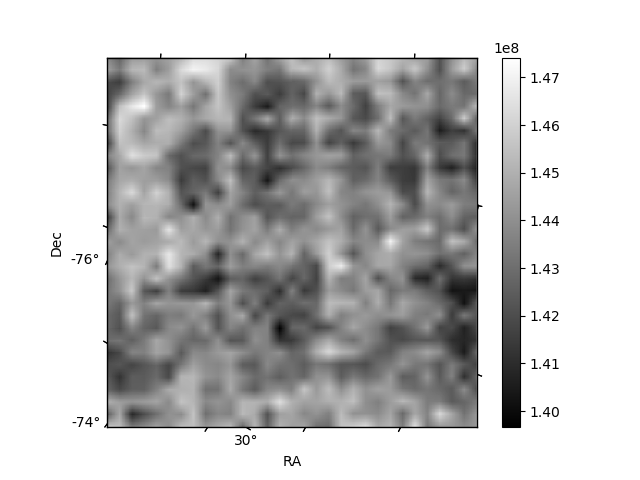
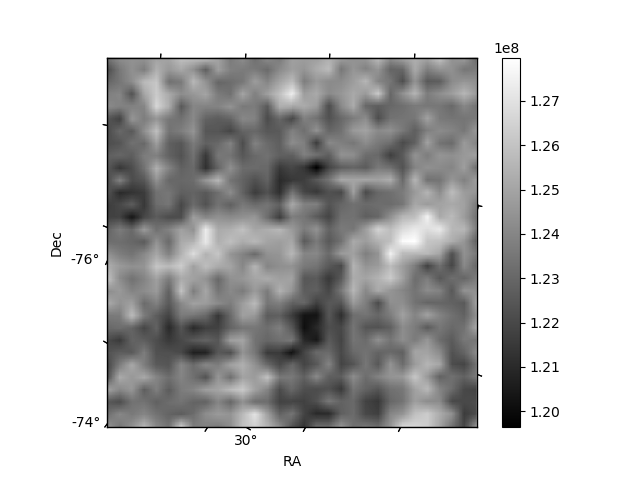
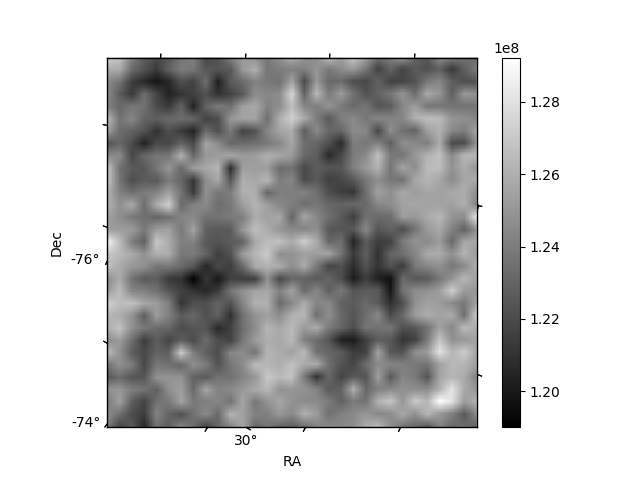
Histogram calculated using DETX and DETY for each event in the final _common_clean file
| Quadrant A | 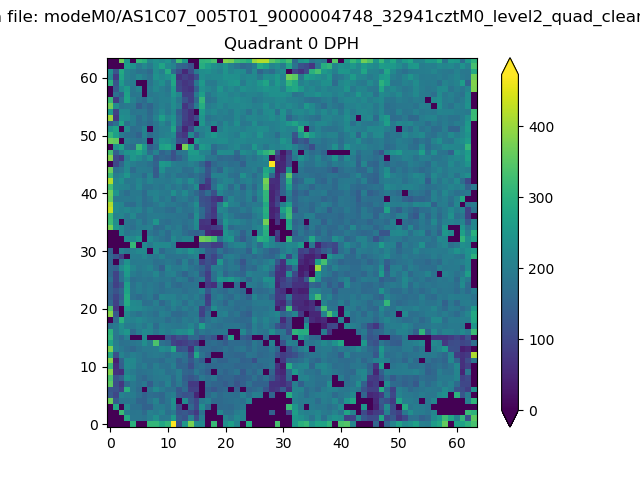 |
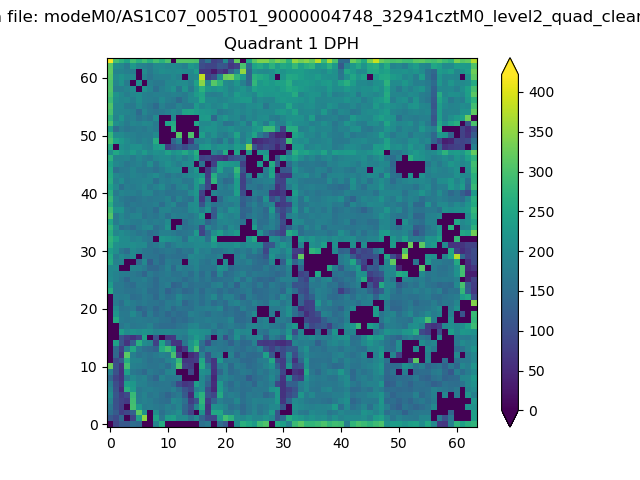 |
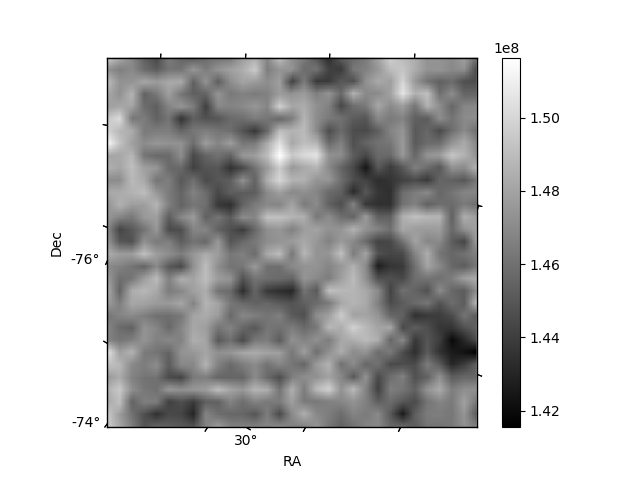
Quadrant B |
|---|---|---|---|
| Quadrant D | 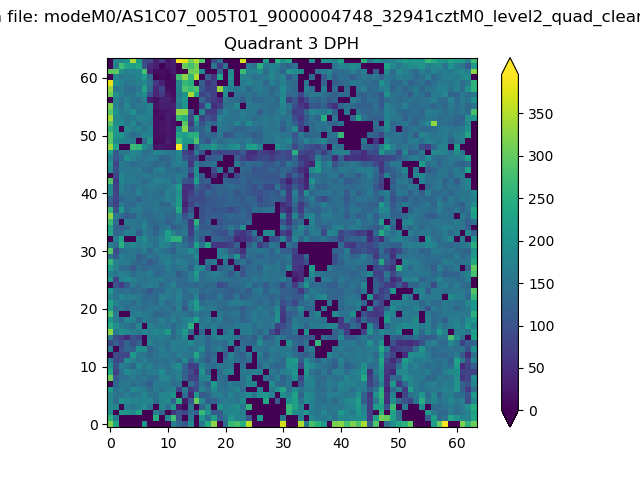 |
 |
Quadrant C |
| Plot type | Count rate plots | Images |
|---|---|---|
| Comparison with Poisson distribution Blue bars denote a histogram of data divided into 1 sec bins. Red curve is a Poisson curve with rate = median count rate of data. |
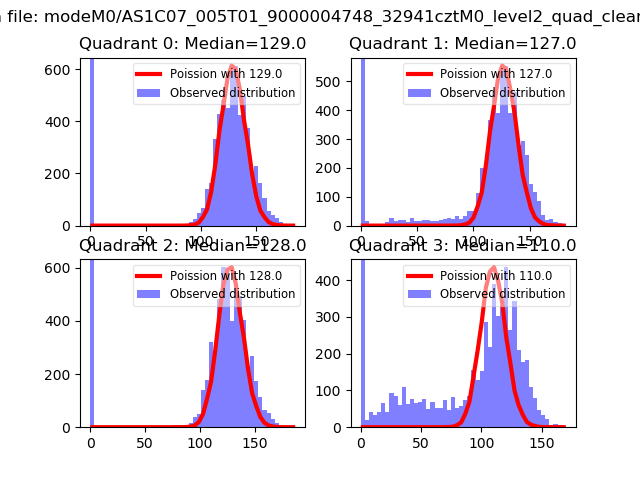 |
 |
| Quadrant-wise count rates Data is divided into 100 sec bins |
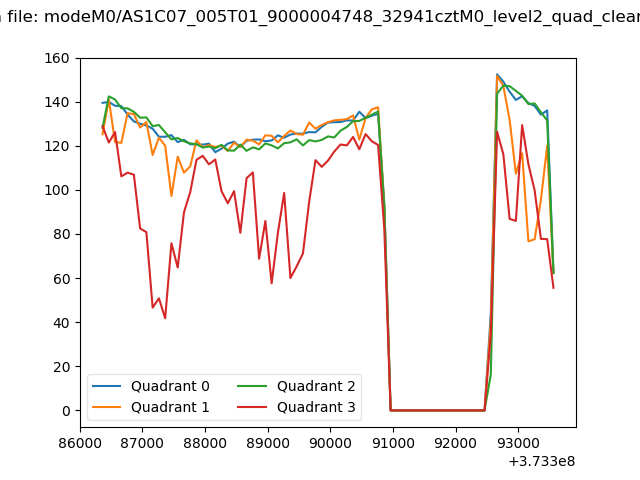 |
|
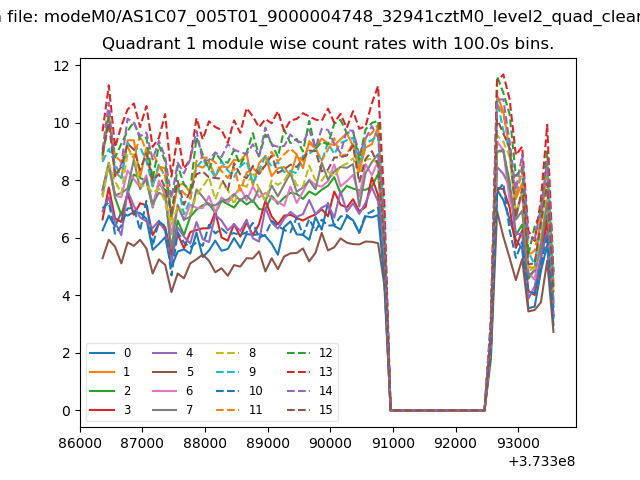
| Module-wise count rates for Quadrant A Data is divided into 100 sec bins |
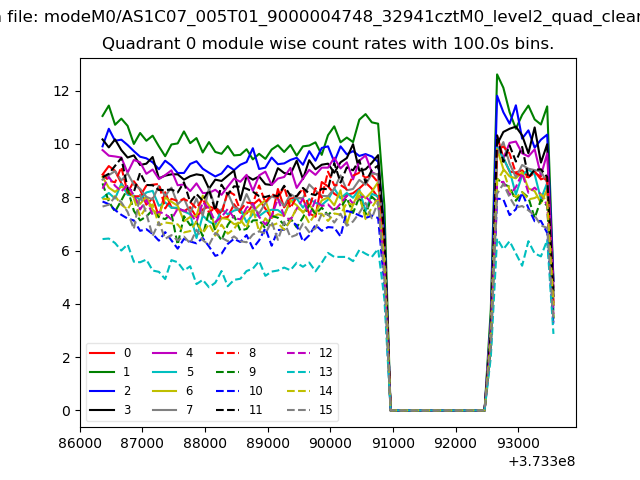 |
 |
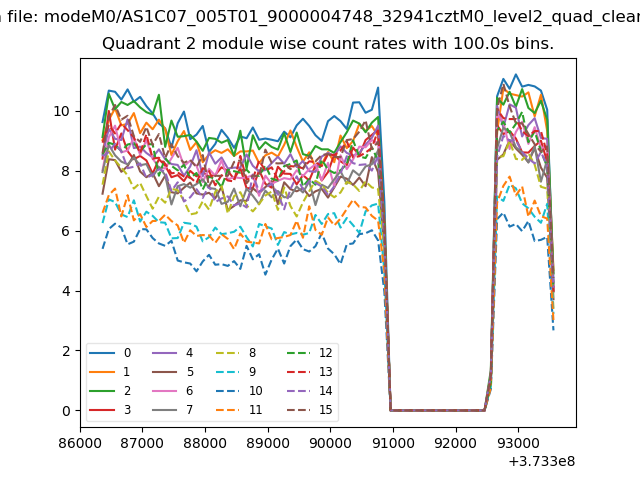
| Module-wise count rates for Quadrant B Data is divided into 100 sec bins |
 |
 |
| Module-wise count rates for Quadrant C Data is divided into 100 sec bins |
 |
 |
| Module-wise count rates for Quadrant D Data is divided into 100 sec bins |
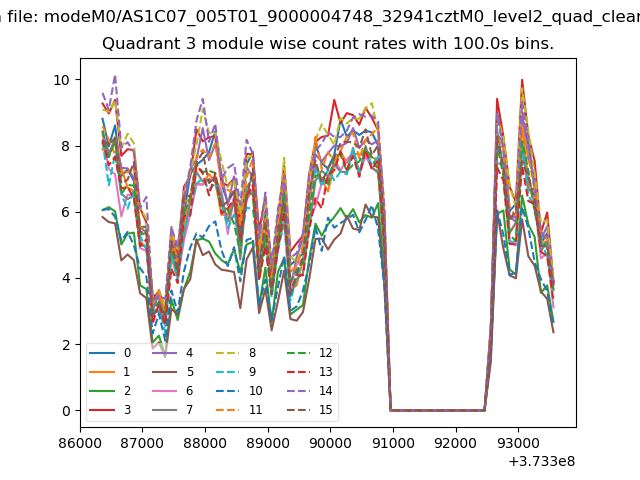 |
 |
| Parameter | Plot |
|---|---|
| CZT HV Monitor | 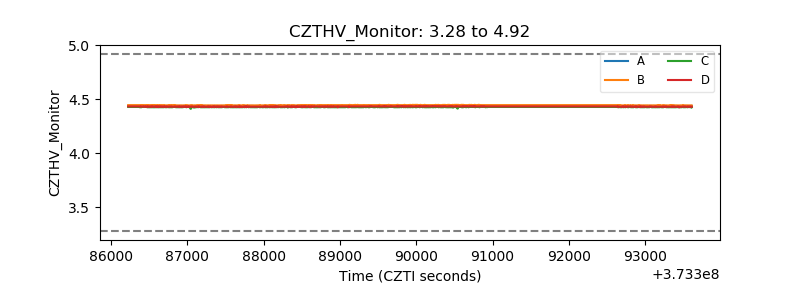 |
| D_VDD | 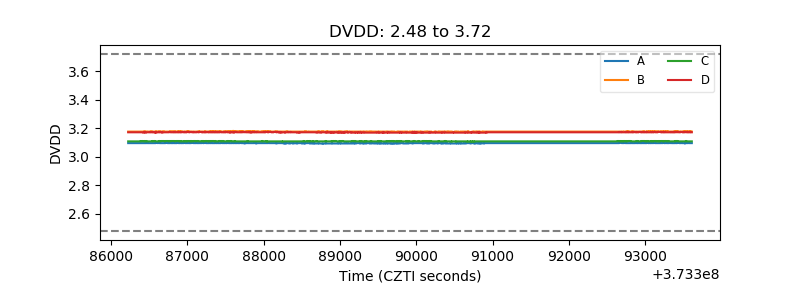 |
| Temperature 1 | 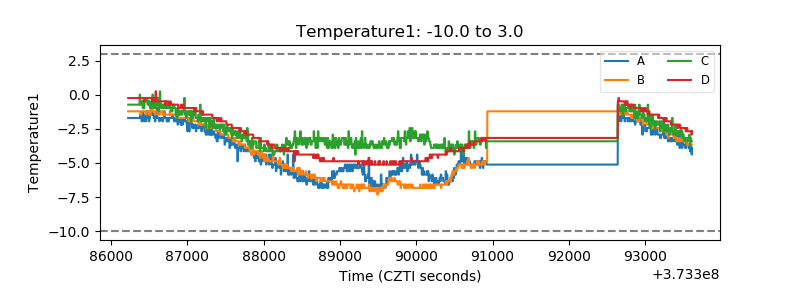 |
| Veto HV Monitor | 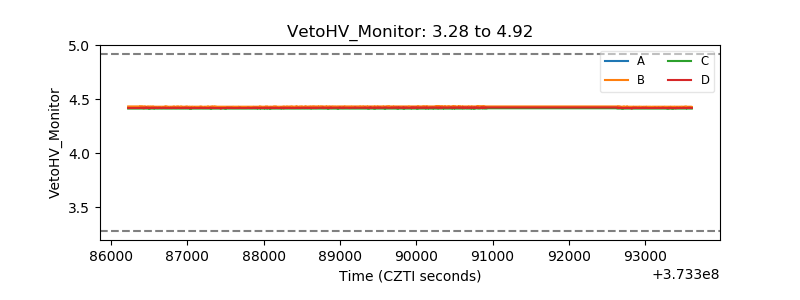 |
| Veto LLD | 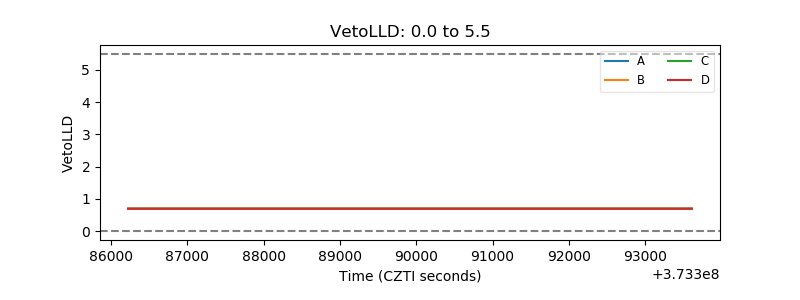 |
| Alpha Counter | 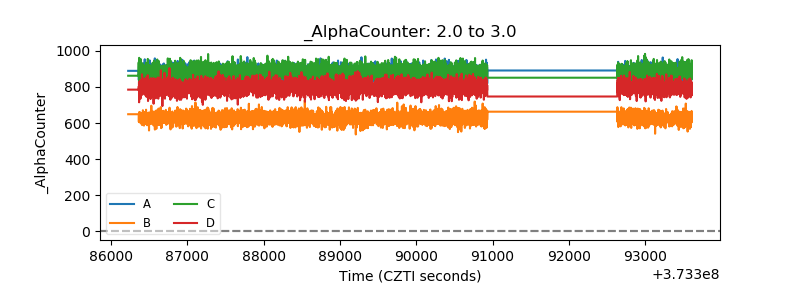 |
| _CPM_Rate | 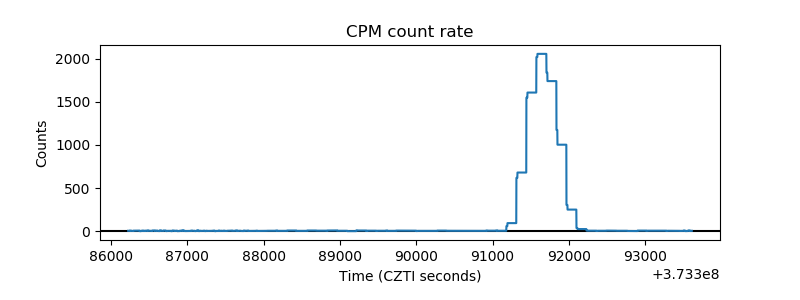 |
| CZT Counter | 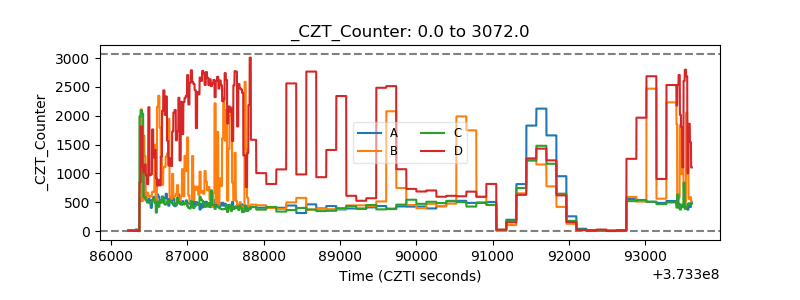 |
| +2.5 Volts monitor |  |
| +5 Volts monitor | 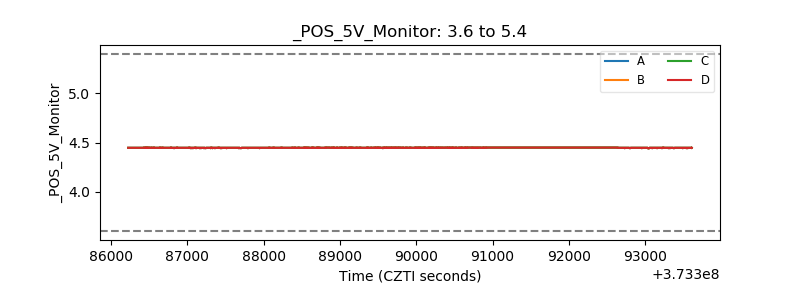 |
| _ROLL_ROT | 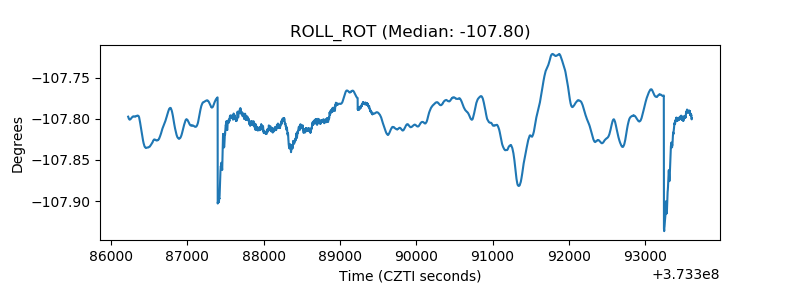 |
| _Roll_DEC | 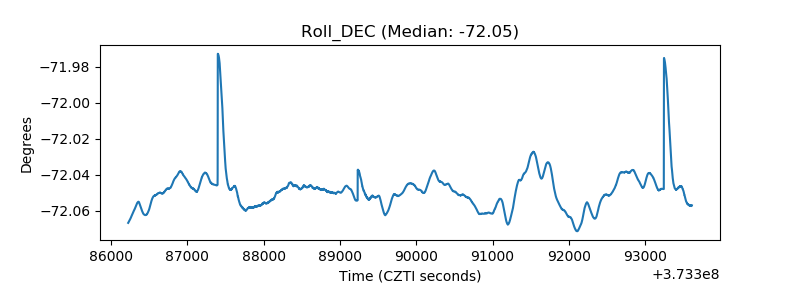 |
| _Roll_RA | 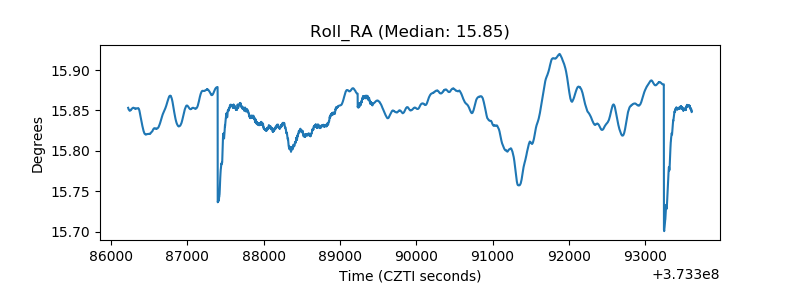 |
| Veto Counter | 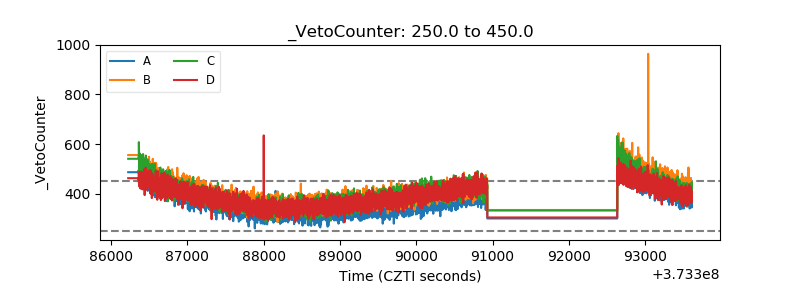 |