| Param | Original file | Final file |
|---|---|---|
| Filename | modeM0/AS1C07_005T01_9000004748_32944cztM0_level2.evt | modeM0/AS1C07_005T01_9000004748_32944cztM0_level2_quad_clean.evt |
| Size (bytes) | 457,983,360 | 102,565,440 |
| Size | 436.8 MB | 97.8 MB |
| Events in quadrant A | 2,389,431 | 708,319 |
| Events in quadrant B | 3,492,371 | 707,799 |
| Events in quadrant C | 2,618,429 | 698,423 |
| Events in quadrant D | 5,026,192 | 636,353 |
| Mode SS | |||
|---|---|---|---|
| Quadrant | BADHDUFLAG | Total packets | Discarded packets |
| A | 0 | 104 | 0 |
| B | 0 | 104 | 0 |
| C | 0 | 104 | 0 |
| D | 0 | 104 | 0 |
| Mode M9 | |||
|---|---|---|---|
| Quadrant | BADHDUFLAG | Total packets | Discarded packets |
| A | 0 | 30 | 0 |
| B | 0 | 30 | 0 |
| C | 0 | 30 | 0 |
| D | 0 | 31 | 0 |
| Mode M0 | |||
|---|---|---|---|
| Quadrant | BADHDUFLAG | Total packets | Discarded packets |
| A | 0 | 10284 | 3 |
| B | 0 | 13583 | 2 |
| C | 0 | 11074 | 2 |
| D | 0 | 18589 | 2 |
| Quadrant | Total seconds | Saturated seconds | Saturation percentage |
|---|---|---|---|
| A | 5067 | 6 | 0.118413% |
| B | 5067 | 300 | 5.920663% |
| C | 5067 | 76 | 1.499901% |
| D | 5067 | 294 | 5.802250% |
Noise dominated data is calculated using 1-second bins in cleaned event files. If a bin has >2000 counts, and if more than 50% of those come from <1% of pixels, then it is considered to be noise-dominated and hence unusable.
| Quadrant | # 1 sec bins | Bins with >0 counts | Bins with >2000 counts | High rate bins dominated by noise | Noise dominated (total time) | Noise dominated (detector-on time) | Marked lightcurve |
|---|---|---|---|---|---|---|---|
| A | 7039 | 5068 | 0 | 0 | 0.00% | 0.00% |  |
| B | 7039 | 5068 | 194 | 194 | 2.76% | 3.83% | 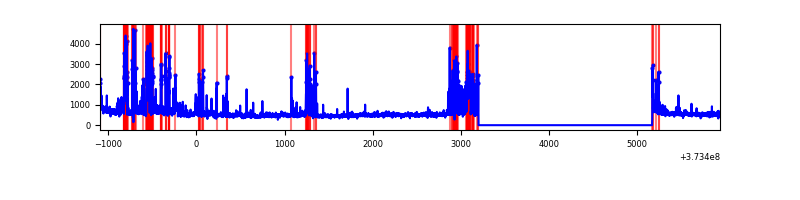 |
| C | 7039 | 5068 | 62 | 62 | 0.88% | 1.22% | 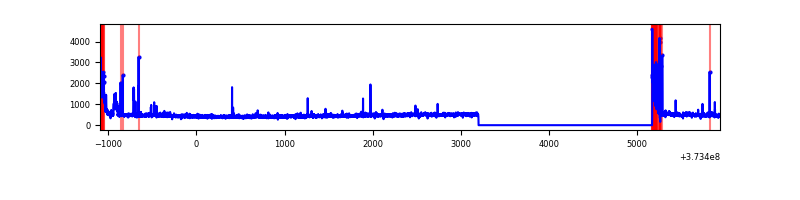 |
| D | 7039 | 5068 | 269 | 269 | 3.82% | 5.31% | 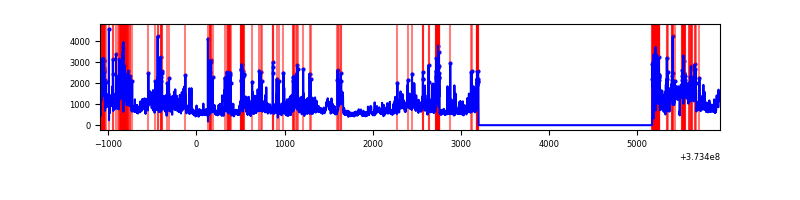 |
Top three noisy pixels from each quadrant. If the there are fewer than three noisy pixels in the level2.evt file, extra rows are filled as -1
| Pixel properties | Quadrant properties | ||||||
|---|---|---|---|---|---|---|---|
| Quadrant | DetID | PixID | Counts | Sigma | Mean | Median | Sigma |
| A | 0 | 159 | 15414 | 122.5 | 607 | 596 | 121.0 |
| A | 13 | 254 | 9702 | 75.28 | 607 | 596 | 121.0 |
| A | 13 | 6 | 8185 | 62.74 | 607 | 596 | 121.0 |
| B | 5 | 172 | 613958 | 5427.17 | 601 | 586 | 113.0 |
| B | 5 | 200 | 178887 | 1577.62 | 601 | 586 | 113.0 |
| B | 0 | 219 | 142897 | 1259.18 | 601 | 586 | 113.0 |
| C | 0 | 10 | 284623 | 2132.3 | 585 | 590 | 133.2 |
| C | 1 | 241 | 20202 | 147.23 | 585 | 590 | 133.2 |
| C | 14 | 67 | 14964 | 107.91 | 585 | 590 | 133.2 |
| D | 8 | 195 | 1445960 | 10011.61 | 564 | 553 | 144.4 |
| D | 2 | 250 | 479085 | 3314.55 | 564 | 553 | 144.4 |
| D | 7 | 80 | 273378 | 1889.72 | 564 | 553 | 144.4 |
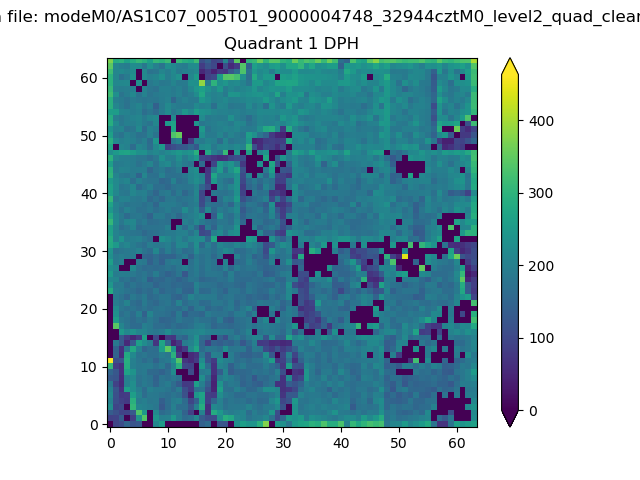
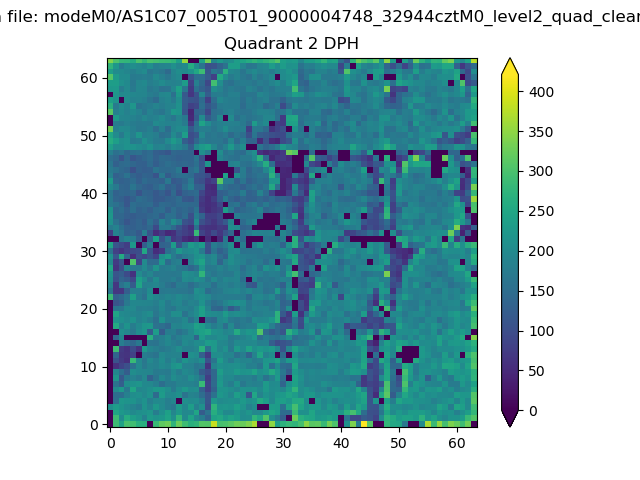
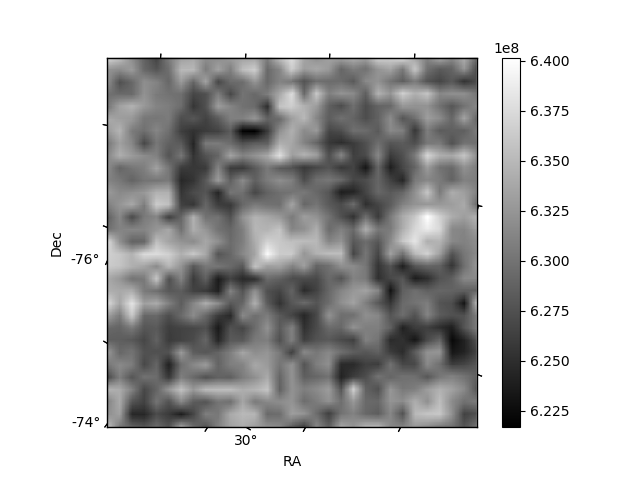
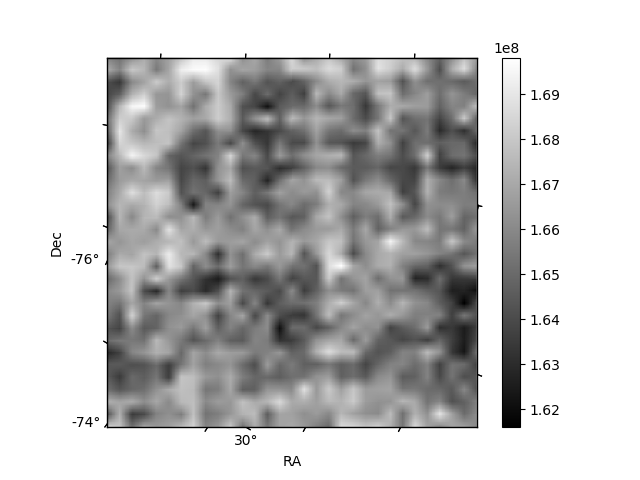
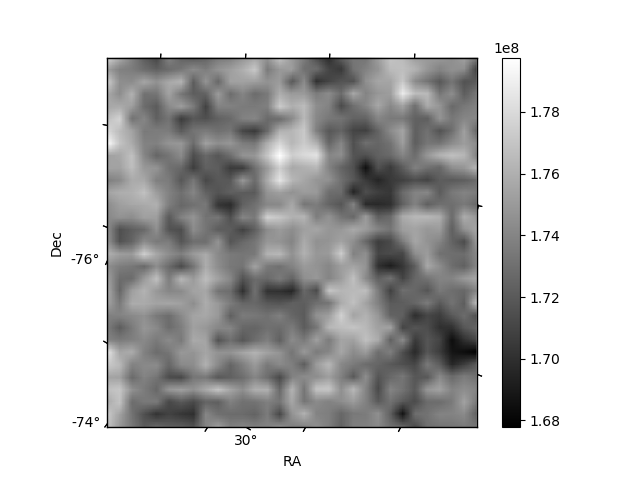
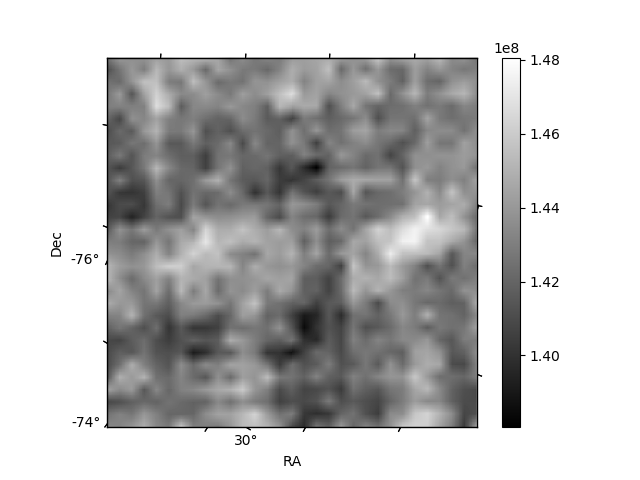
Histogram calculated using DETX and DETY for each event in the final _common_clean file
| Quadrant A | 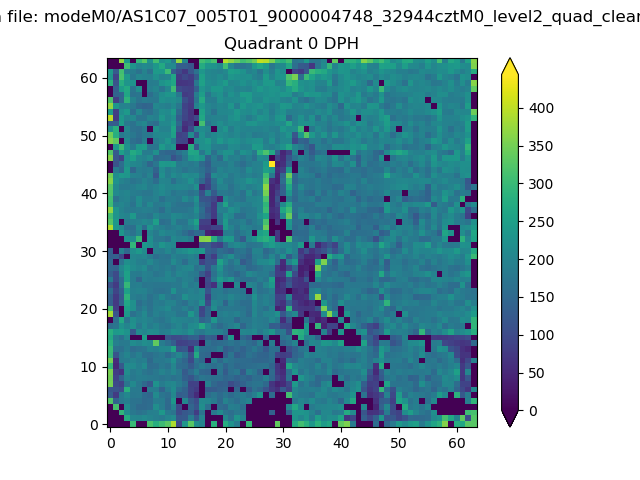 |
 |
Quadrant B |
|---|---|---|---|
| Quadrant D | 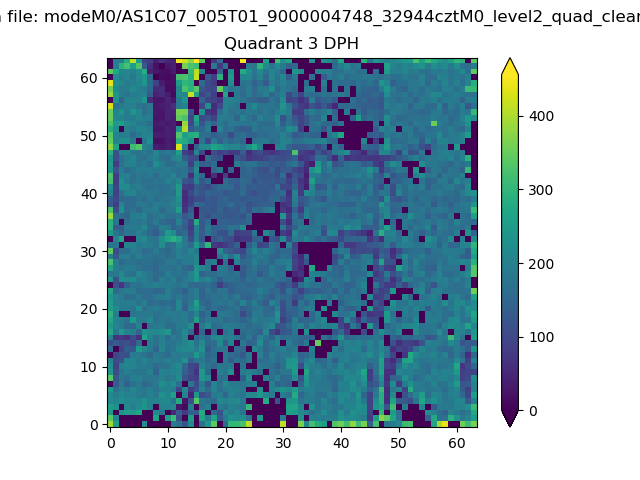 |
 |
Quadrant C |
| Plot type | Count rate plots | Images |
|---|---|---|
| Comparison with Poisson distribution Blue bars denote a histogram of data divided into 1 sec bins. Red curve is a Poisson curve with rate = median count rate of data. |
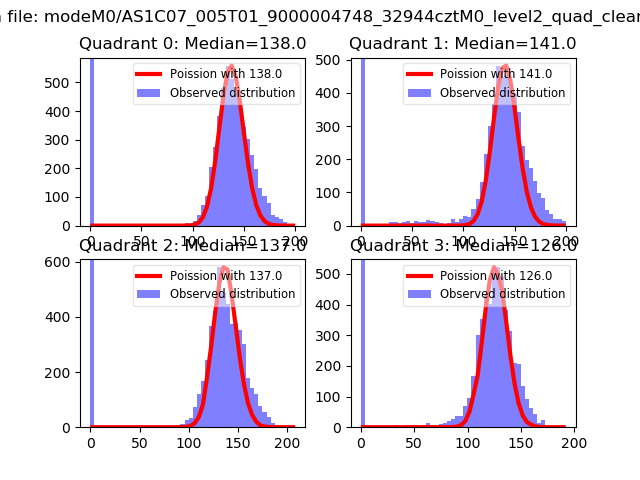 |
 |
| Quadrant-wise count rates Data is divided into 100 sec bins |
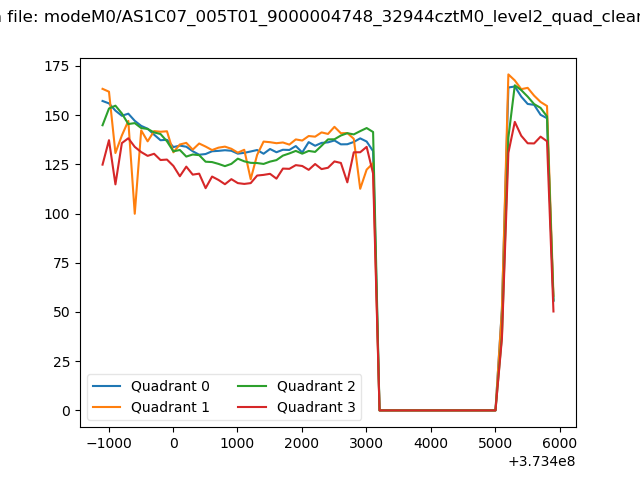 |
|
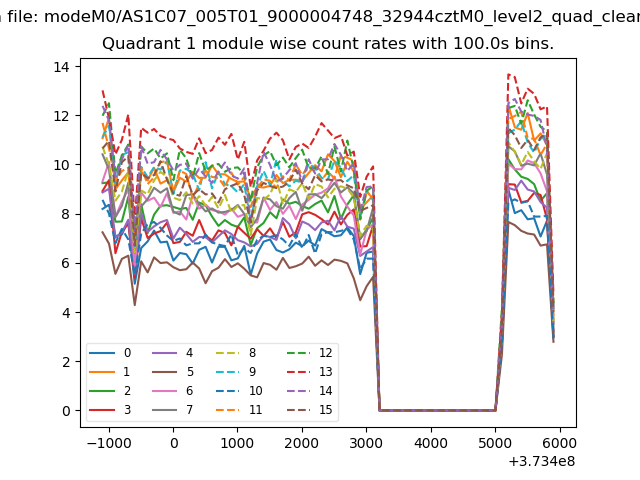
| Module-wise count rates for Quadrant A Data is divided into 100 sec bins |
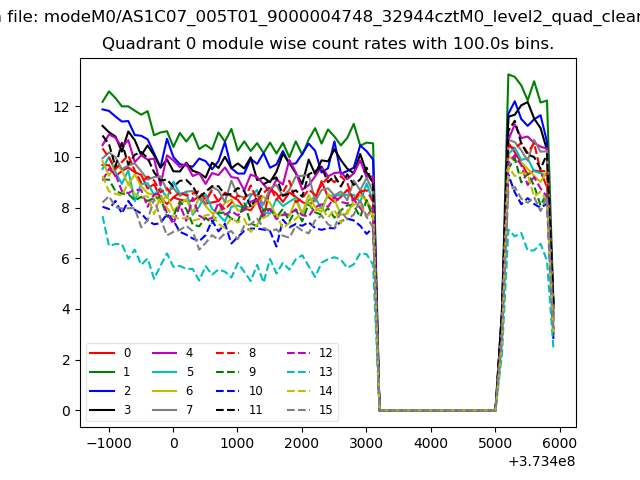 |
 |
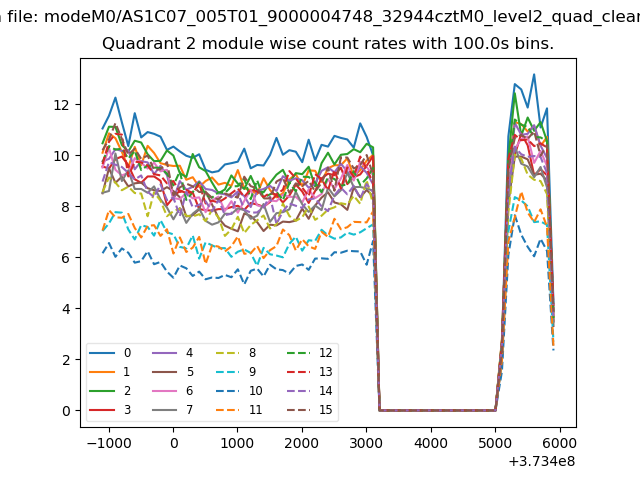
| Module-wise count rates for Quadrant B Data is divided into 100 sec bins |
 |
 |
| Module-wise count rates for Quadrant C Data is divided into 100 sec bins |
 |
 |
| Module-wise count rates for Quadrant D Data is divided into 100 sec bins |
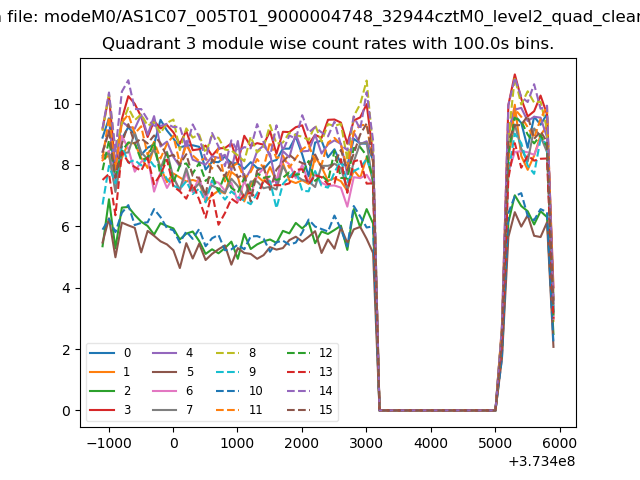 |
 |
| Parameter | Plot |
|---|---|
| CZT HV Monitor | 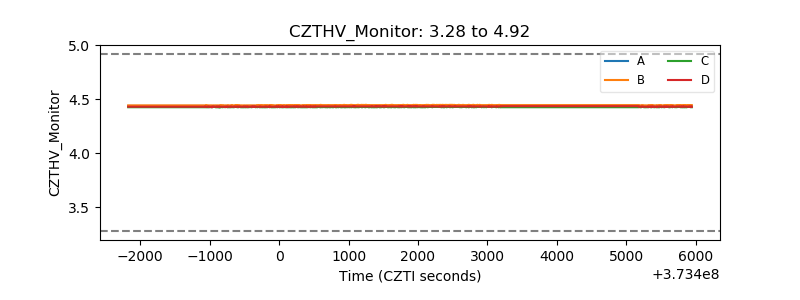 |
| D_VDD |  |
| Temperature 1 | 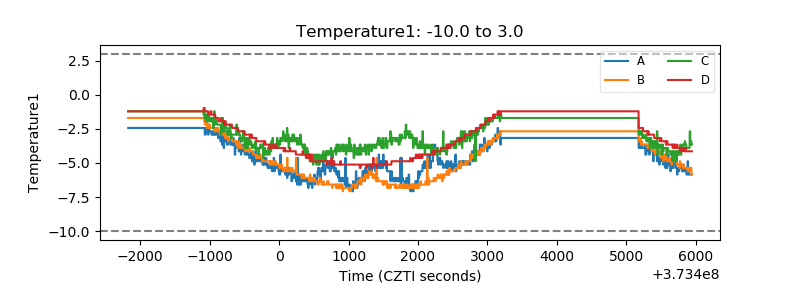 |
| Veto HV Monitor |  |
| Veto LLD | 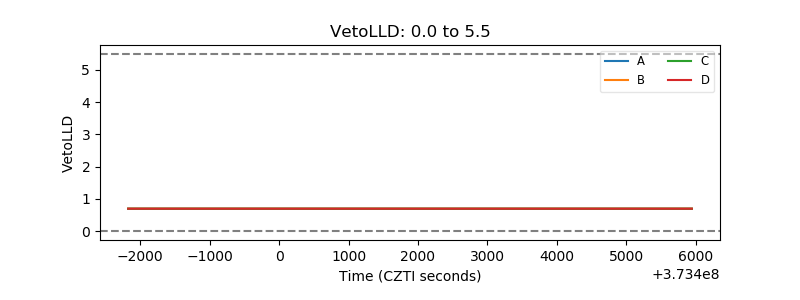 |
| Alpha Counter | 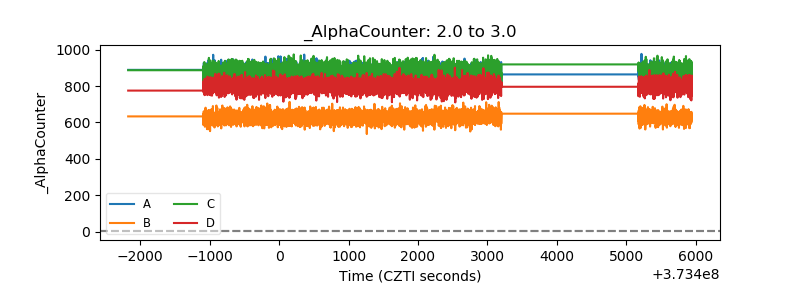 |
| _CPM_Rate | 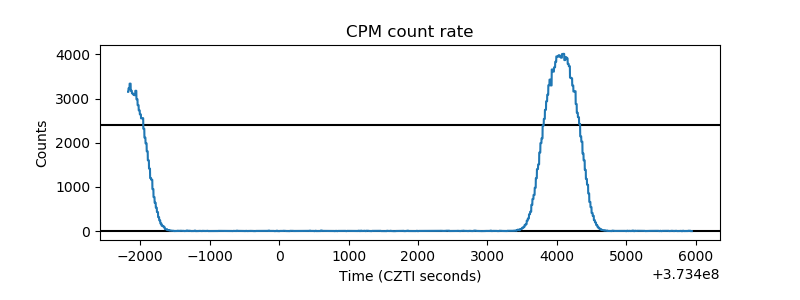 |
| CZT Counter | 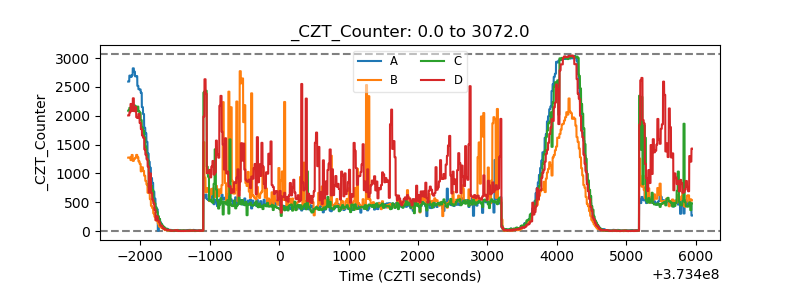 |
| +2.5 Volts monitor |  |
| +5 Volts monitor |  |
| _ROLL_ROT | 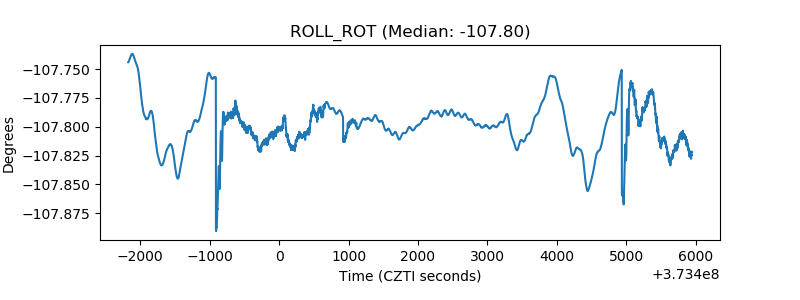 |
| _Roll_DEC | 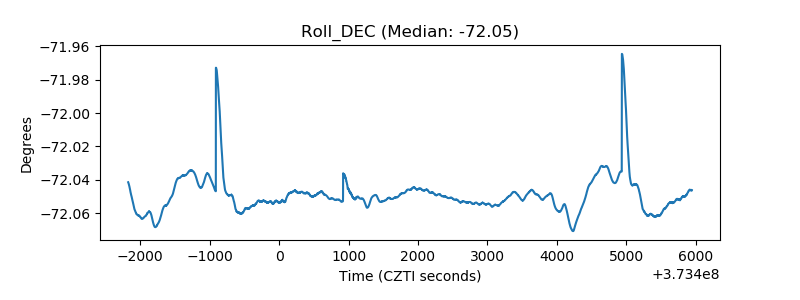 |
| _Roll_RA | 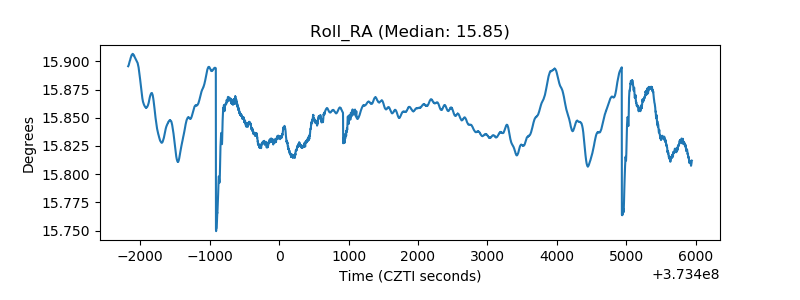 |
| Veto Counter | 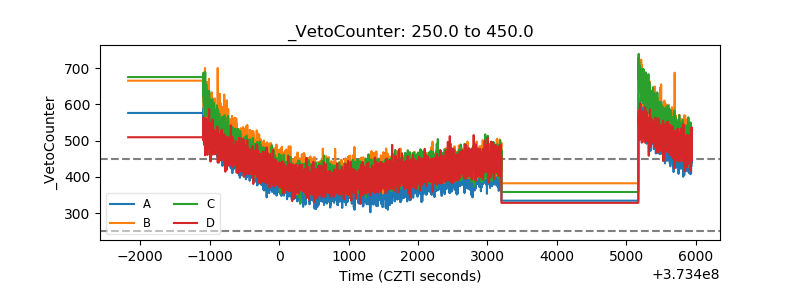 |