| Param | Original file | Final file |
|---|---|---|
| Filename | modeM0/AS1C07_005T01_9000004748_32945cztM0_level2.evt | modeM0/AS1C07_005T01_9000004748_32945cztM0_level2_quad_clean.evt |
| Size (bytes) | 436,325,760 | 102,574,080 |
| Size | 416.1 MB | 97.8 MB |
| Events in quadrant A | 2,338,614 | 710,356 |
| Events in quadrant B | 3,149,168 | 710,503 |
| Events in quadrant C | 2,554,608 | 702,486 |
| Events in quadrant D | 4,837,464 | 637,629 |
| Mode SS | |||
|---|---|---|---|
| Quadrant | BADHDUFLAG | Total packets | Discarded packets |
| A | 0 | 100 | 0 |
| B | 0 | 100 | 0 |
| C | 0 | 100 | 0 |
| D | 0 | 100 | 0 |
| Mode M9 | |||
|---|---|---|---|
| Quadrant | BADHDUFLAG | Total packets | Discarded packets |
| A | 0 | 33 | 0 |
| B | 0 | 33 | 0 |
| C | 0 | 33 | 0 |
| D | 0 | 34 | 0 |
| Mode M0 | |||
|---|---|---|---|
| Quadrant | BADHDUFLAG | Total packets | Discarded packets |
| A | 0 | 9973 | 3 |
| B | 0 | 12381 | 2 |
| C | 0 | 10673 | 2 |
| D | 0 | 17980 | 2 |
| Quadrant | Total seconds | Saturated seconds | Saturation percentage |
|---|---|---|---|
| A | 4926 | 2 | 0.040601% |
| B | 4926 | 253 | 5.136013% |
| C | 4926 | 72 | 1.461632% |
| D | 4926 | 247 | 5.014210% |
Noise dominated data is calculated using 1-second bins in cleaned event files. If a bin has >2000 counts, and if more than 50% of those come from <1% of pixels, then it is considered to be noise-dominated and hence unusable.
| Quadrant | # 1 sec bins | Bins with >0 counts | Bins with >2000 counts | High rate bins dominated by noise | Noise dominated (total time) | Noise dominated (detector-on time) | Marked lightcurve |
|---|---|---|---|---|---|---|---|
| A | 6989 | 4927 | 0 | 0 | 0.00% | 0.00% | 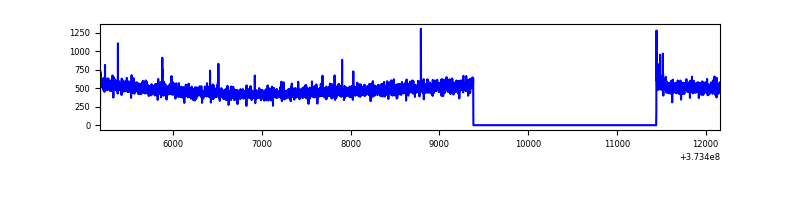 |
| B | 6989 | 4926 | 176 | 176 | 2.52% | 3.57% | 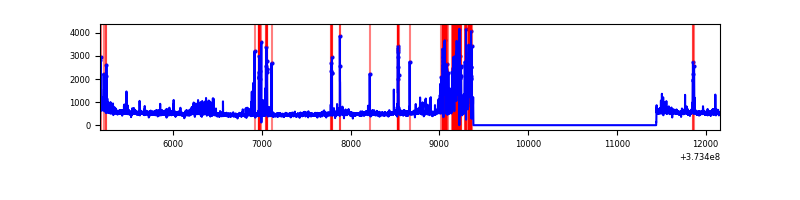 |
| C | 6989 | 4927 | 58 | 58 | 0.83% | 1.18% | 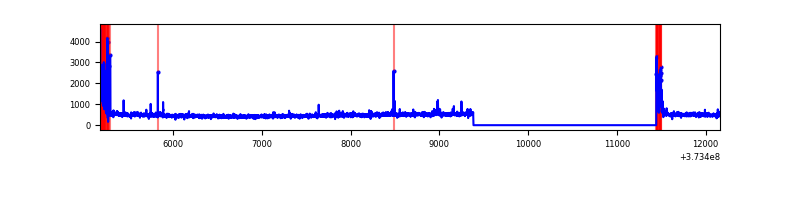 |
| D | 6989 | 4927 | 229 | 229 | 3.28% | 4.65% | 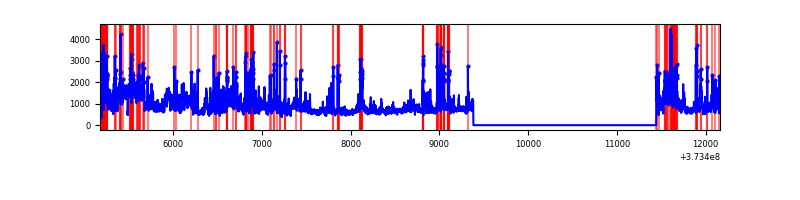 |
Top three noisy pixels from each quadrant. If the there are fewer than three noisy pixels in the level2.evt file, extra rows are filled as -1
| Pixel properties | Quadrant properties | ||||||
|---|---|---|---|---|---|---|---|
| Quadrant | DetID | PixID | Counts | Sigma | Mean | Median | Sigma |
| A | 0 | 159 | 13134 | 105.92 | 597 | 588 | 118.4 |
| A | 13 | 254 | 9062 | 71.54 | 597 | 588 | 118.4 |
| A | 13 | 6 | 7226 | 56.04 | 597 | 588 | 118.4 |
| B | 5 | 172 | 553321 | 5041.25 | 592 | 578 | 109.6 |
| B | 0 | 199 | 72711 | 657.88 | 592 | 578 | 109.6 |
| B | 0 | 189 | 40810 | 366.93 | 592 | 578 | 109.6 |
| C | 0 | 10 | 218199 | 1634.96 | 583 | 589 | 133.1 |
| C | 14 | 67 | 19328 | 140.79 | 583 | 589 | 133.1 |
| C | 1 | 241 | 13983 | 100.63 | 583 | 589 | 133.1 |
| D | 8 | 195 | 1329722 | 9217.07 | 563 | 550 | 144.2 |
| D | 2 | 250 | 351758 | 2435.43 | 563 | 550 | 144.2 |
| D | 12 | 218 | 329656 | 2282.17 | 563 | 550 | 144.2 |
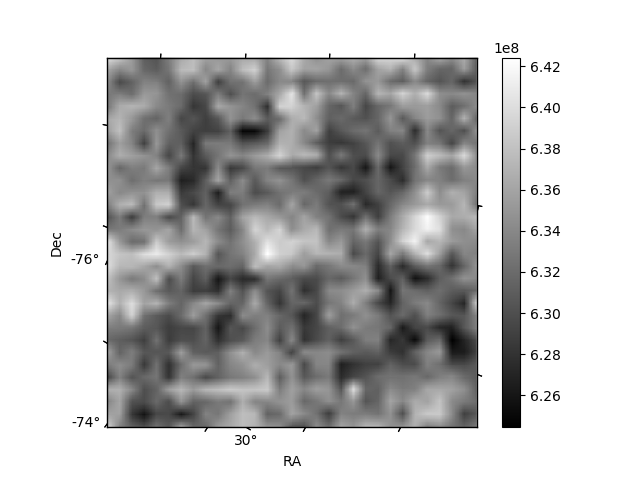
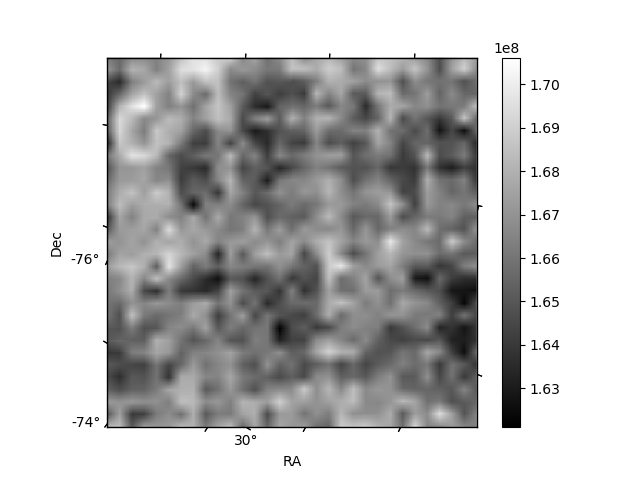
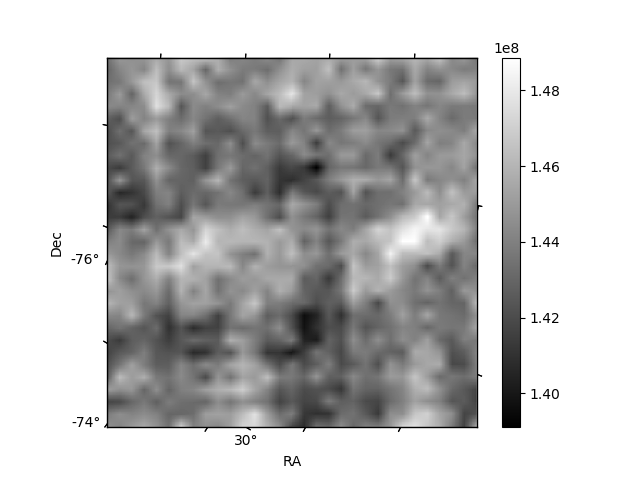
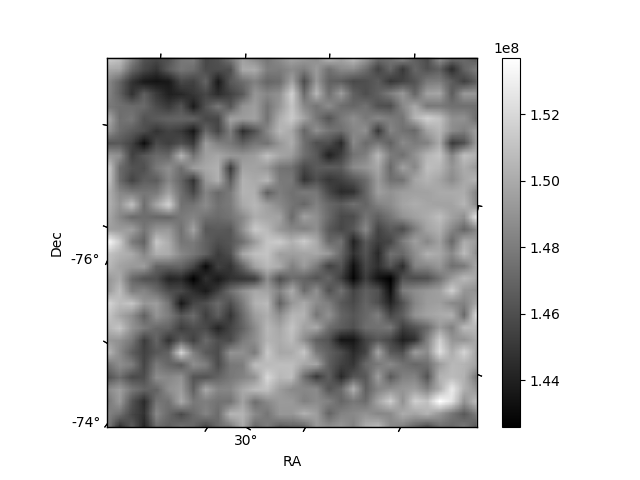
Histogram calculated using DETX and DETY for each event in the final _common_clean file
| Quadrant A | 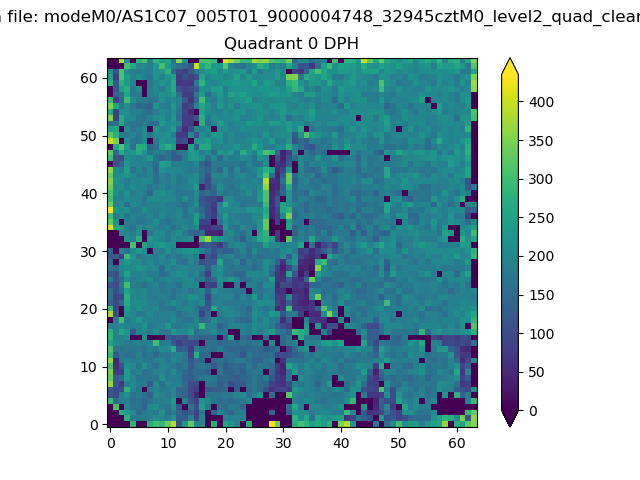 |
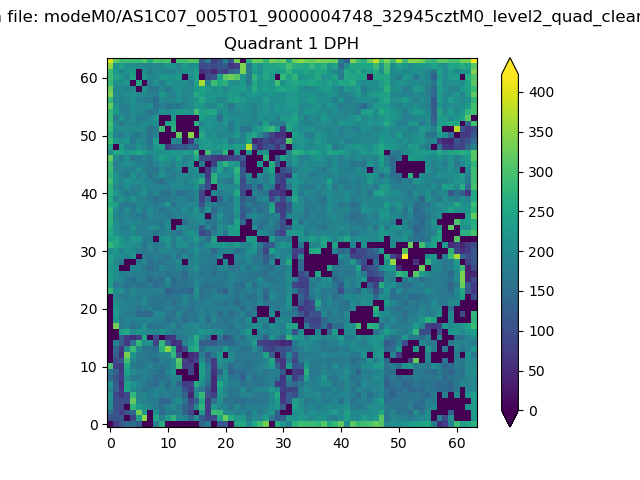 |
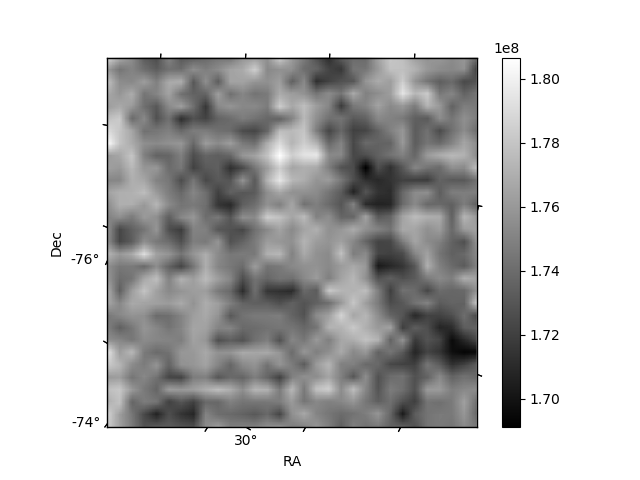
Quadrant B |
|---|---|---|---|
| Quadrant D | 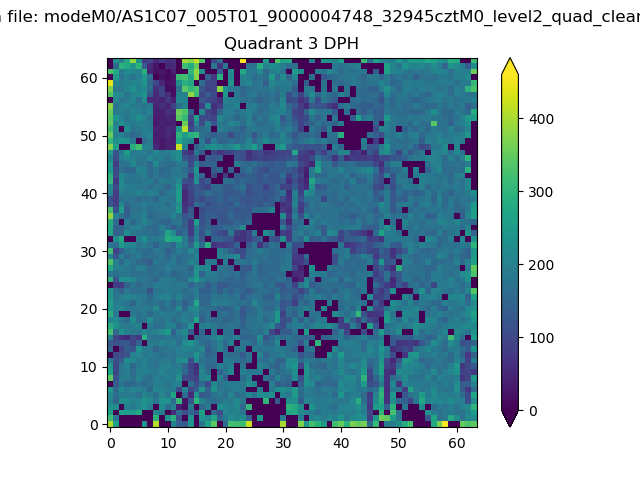 |
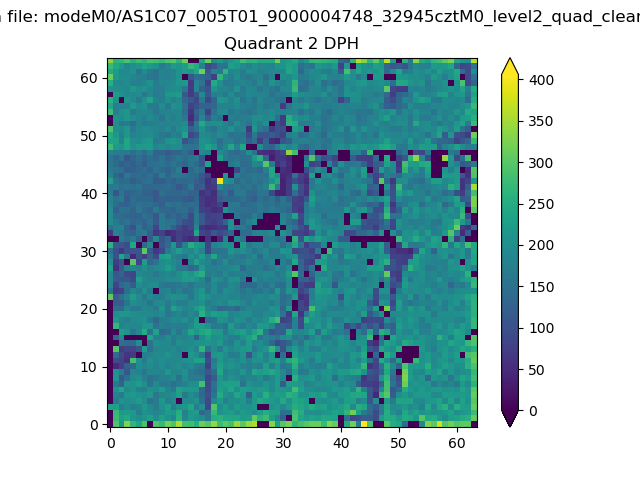 |
Quadrant C |
| Plot type | Count rate plots | Images |
|---|---|---|
| Comparison with Poisson distribution Blue bars denote a histogram of data divided into 1 sec bins. Red curve is a Poisson curve with rate = median count rate of data. |
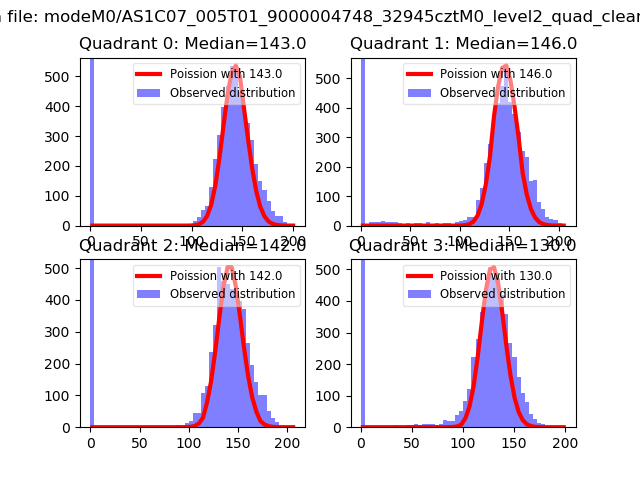 |
 |
| Quadrant-wise count rates Data is divided into 100 sec bins |
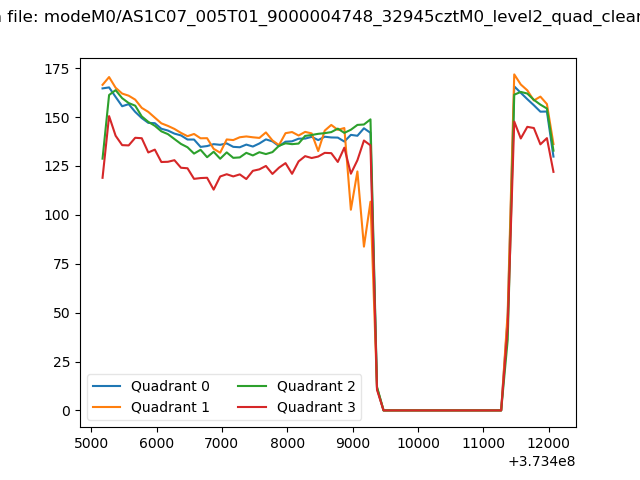 |
|
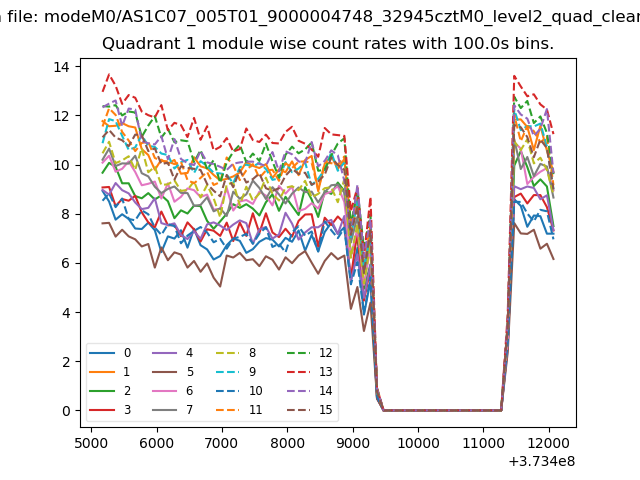
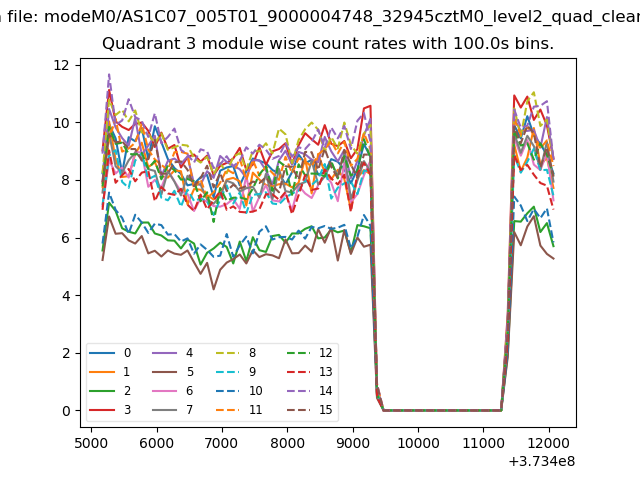
| Module-wise count rates for Quadrant A Data is divided into 100 sec bins |
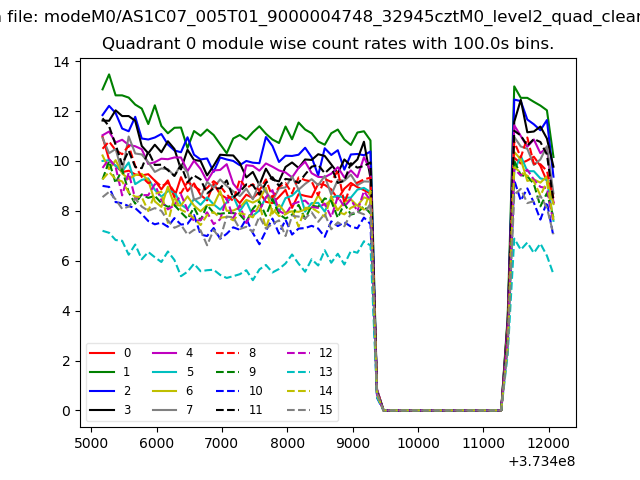 |
 |
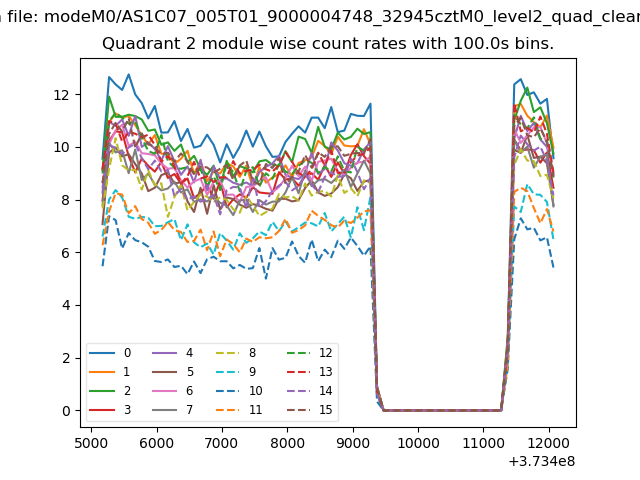
| Module-wise count rates for Quadrant B Data is divided into 100 sec bins |
 |
 |
| Module-wise count rates for Quadrant C Data is divided into 100 sec bins |
 |
 |
| Module-wise count rates for Quadrant D Data is divided into 100 sec bins |
 |
 |
| Parameter | Plot |
|---|---|
| CZT HV Monitor | 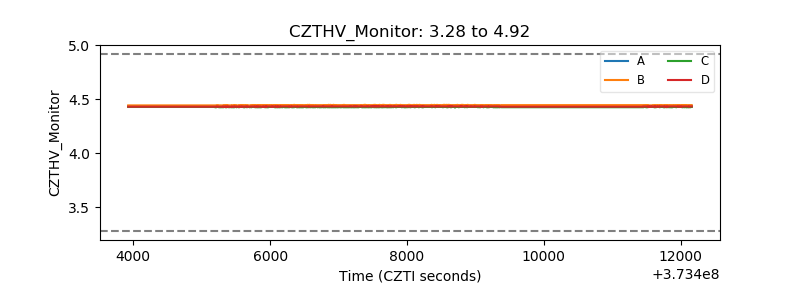 |
| D_VDD | 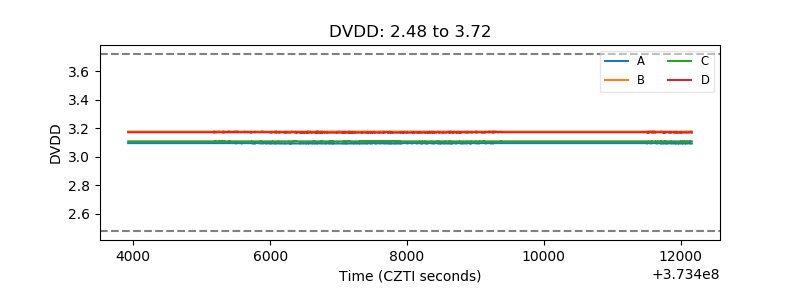 |
| Temperature 1 | 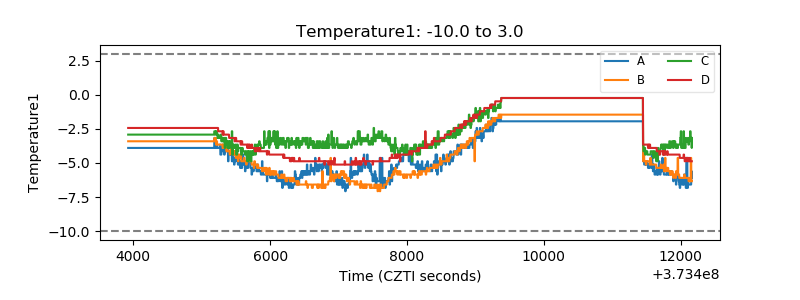 |
| Veto HV Monitor | 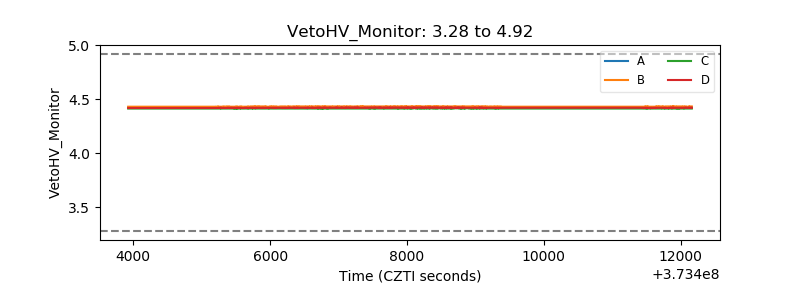 |
| Veto LLD | 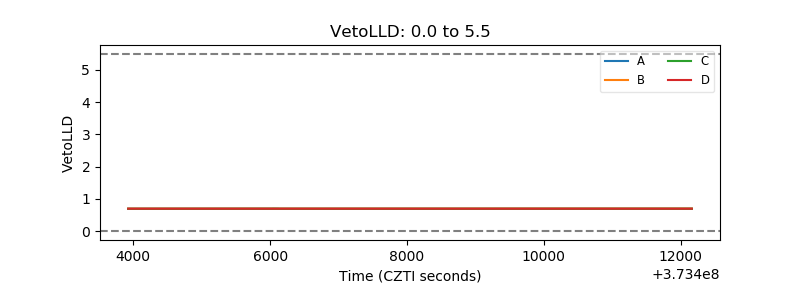 |
| Alpha Counter | 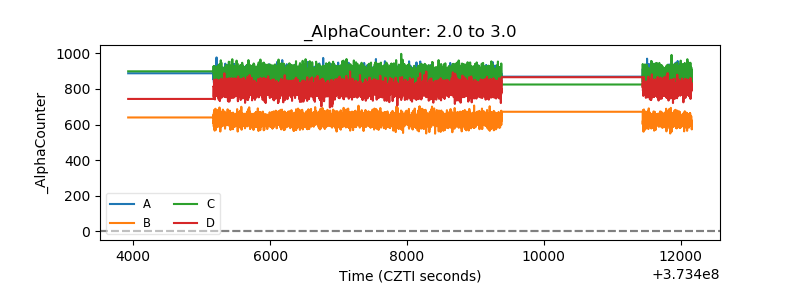 |
| _CPM_Rate | 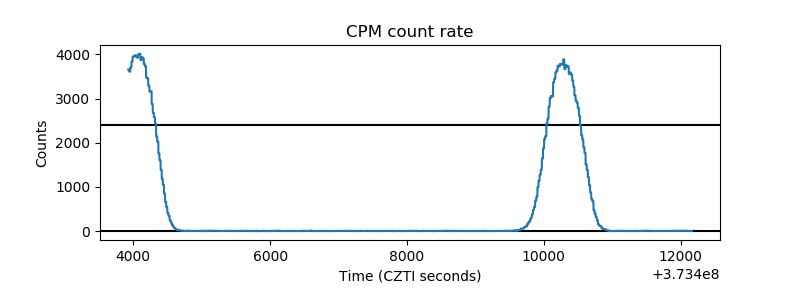 |
| CZT Counter | 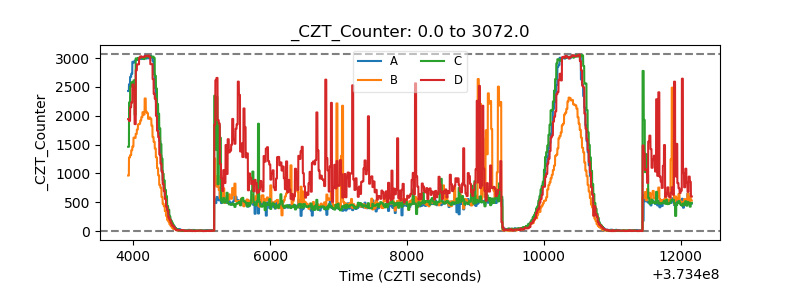 |
| +2.5 Volts monitor | 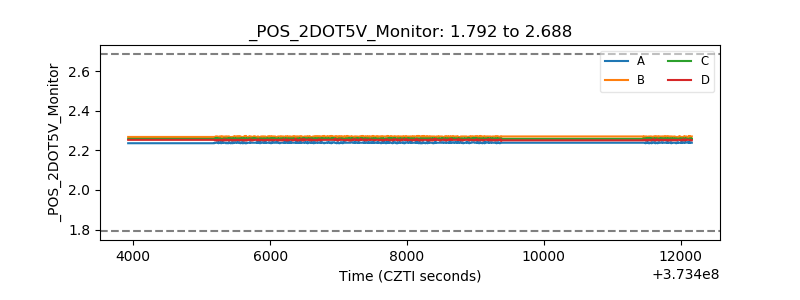 |
| +5 Volts monitor | 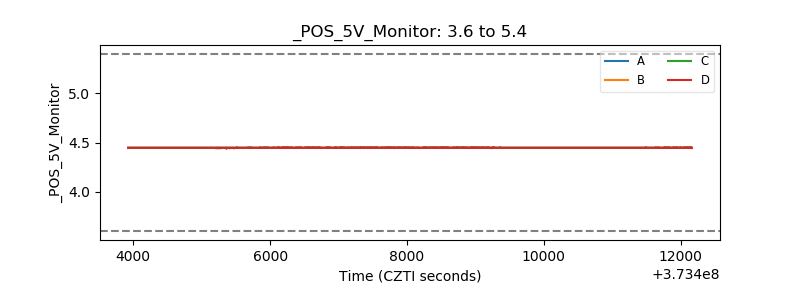 |
| _ROLL_ROT | 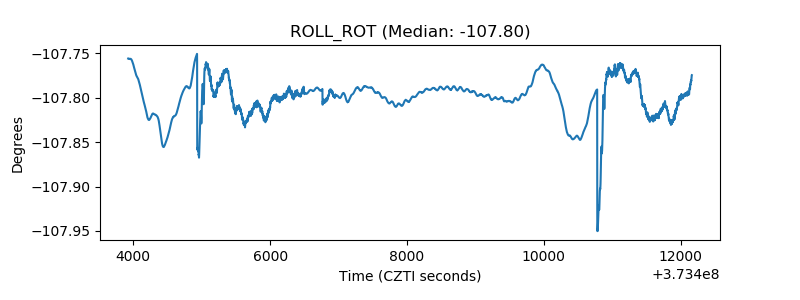 |
| _Roll_DEC | 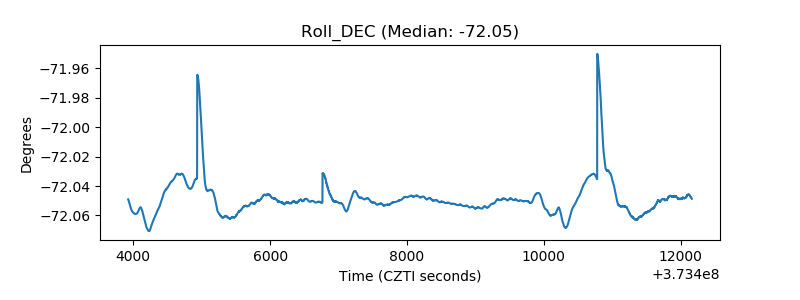 |
| _Roll_RA | 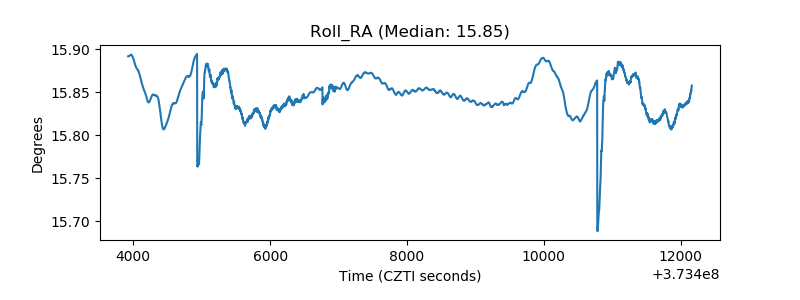 |
| Veto Counter | 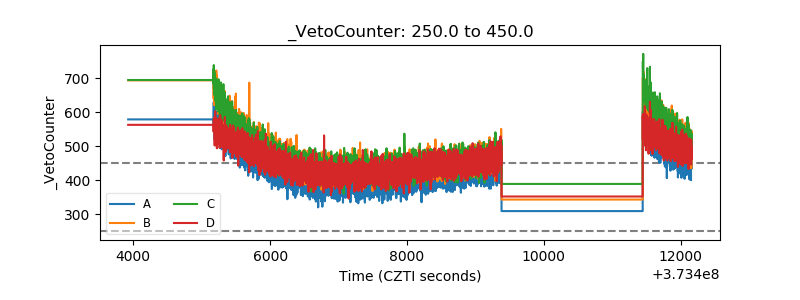 |