| Param | Original file | Final file |
|---|---|---|
| Filename | modeM0/AS1C07_005T01_9000004748_32947cztM0_level2.evt | modeM0/AS1C07_005T01_9000004748_32947cztM0_level2_quad_clean.evt |
| Size (bytes) | 538,326,720 | 102,528,000 |
| Size | 513.4 MB | 97.8 MB |
| Events in quadrant A | 2,451,842 | 713,892 |
| Events in quadrant B | 3,392,194 | 717,987 |
| Events in quadrant C | 2,618,868 | 721,658 |
| Events in quadrant D | 7,489,390 | 587,921 |
| Mode SS | |||
|---|---|---|---|
| Quadrant | BADHDUFLAG | Total packets | Discarded packets |
| A | 0 | 106 | 0 |
| B | 0 | 106 | 0 |
| C | 0 | 106 | 0 |
| D | 0 | 106 | 0 |
| Mode M9 | |||
|---|---|---|---|
| Quadrant | BADHDUFLAG | Total packets | Discarded packets |
| A | 0 | 37 | 0 |
| B | 0 | 37 | 0 |
| C | 0 | 37 | 0 |
| D | 0 | 38 | 0 |
| Mode M0 | |||
|---|---|---|---|
| Quadrant | BADHDUFLAG | Total packets | Discarded packets |
| A | 0 | 10576 | 3 |
| B | 0 | 13383 | 2 |
| C | 0 | 10990 | 2 |
| D | 0 | 25925 | 2 |
| Quadrant | Total seconds | Saturated seconds | Saturation percentage |
|---|---|---|---|
| A | 5184 | 16 | 0.308642% |
| B | 5184 | 312 | 6.018519% |
| C | 5184 | 36 | 0.694444% |
| D | 5184 | 1128 | 21.759259% |
Noise dominated data is calculated using 1-second bins in cleaned event files. If a bin has >2000 counts, and if more than 50% of those come from <1% of pixels, then it is considered to be noise-dominated and hence unusable.
| Quadrant | # 1 sec bins | Bins with >0 counts | Bins with >2000 counts | High rate bins dominated by noise | Noise dominated (total time) | Noise dominated (detector-on time) | Marked lightcurve |
|---|---|---|---|---|---|---|---|
| A | 7306 | 5185 | 6 | 6 | 0.08% | 0.12% | 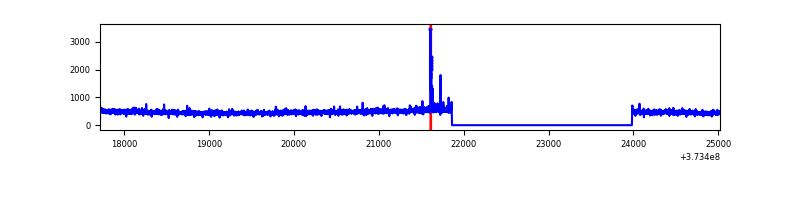 |
| B | 7306 | 5185 | 192 | 192 | 2.63% | 3.70% | 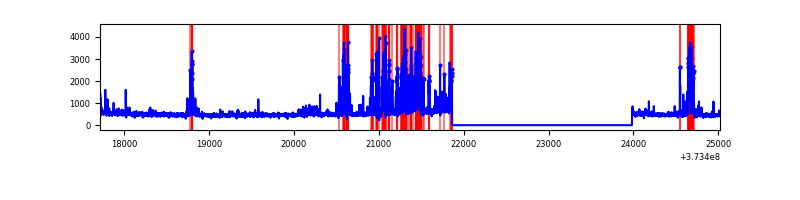 |
| C | 7306 | 5185 | 28 | 28 | 0.38% | 0.54% | 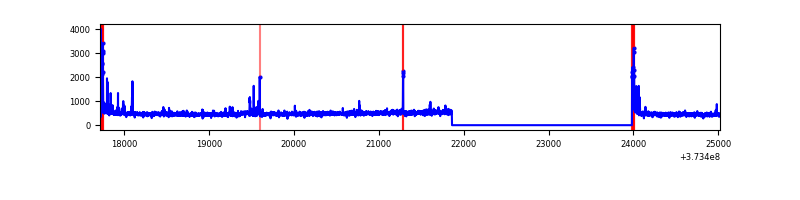 |
| D | 7306 | 5185 | 992 | 992 | 13.58% | 19.13% | 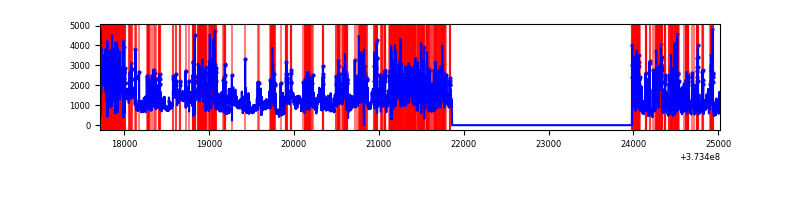 |
Top three noisy pixels from each quadrant. If the there are fewer than three noisy pixels in the level2.evt file, extra rows are filled as -1
| Pixel properties | Quadrant properties | ||||||
|---|---|---|---|---|---|---|---|
| Quadrant | DetID | PixID | Counts | Sigma | Mean | Median | Sigma |
| A | 0 | 191 | 41432 | 327.36 | 616 | 605 | 124.7 |
| A | 0 | 253 | 10165 | 76.65 | 616 | 605 | 124.7 |
| A | 14 | 238 | 9640 | 72.44 | 616 | 605 | 124.7 |
| B | 5 | 172 | 813037 | 7156.14 | 610 | 597 | 113.5 |
| B | 0 | 219 | 49638 | 431.96 | 610 | 597 | 113.5 |
| B | 0 | 230 | 31387 | 271.2 | 610 | 597 | 113.5 |
| C | 0 | 10 | 139033 | 990.13 | 613 | 619 | 139.8 |
| C | 15 | 159 | 25013 | 174.5 | 613 | 619 | 139.8 |
| C | 1 | 241 | 24064 | 167.71 | 613 | 619 | 139.8 |
| D | 8 | 195 | 2109620 | 14890.43 | 544 | 531 | 141.6 |
| D | 7 | 80 | 1674372 | 11817.53 | 544 | 531 | 141.6 |
| D | 12 | 218 | 451164 | 3181.53 | 544 | 531 | 141.6 |
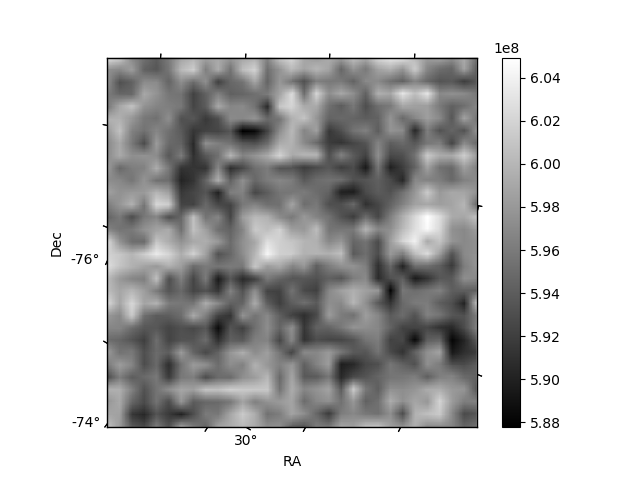
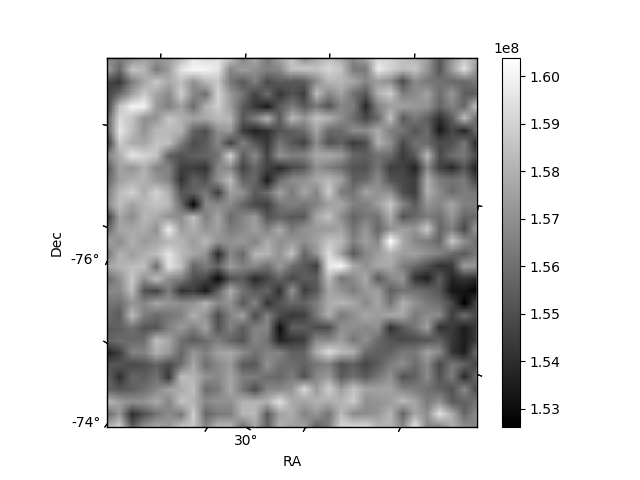
Histogram calculated using DETX and DETY for each event in the final _common_clean file
| Quadrant A | 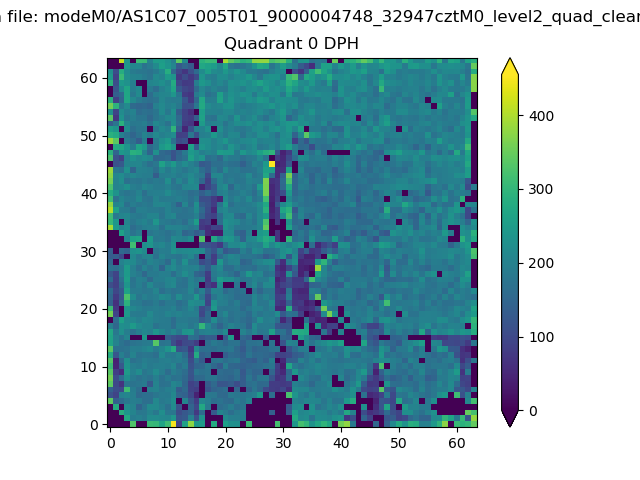 |
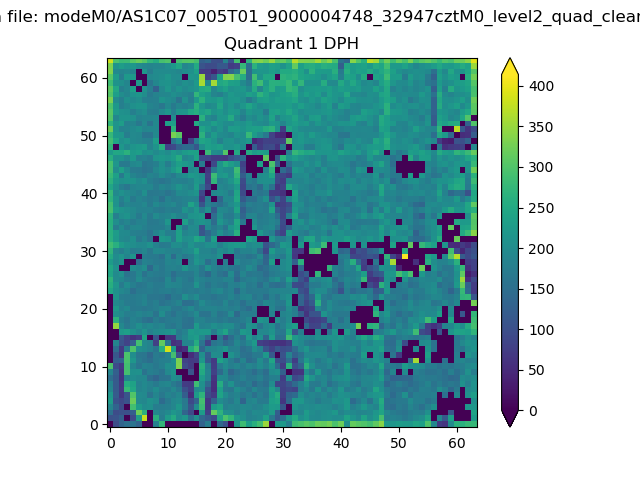 |
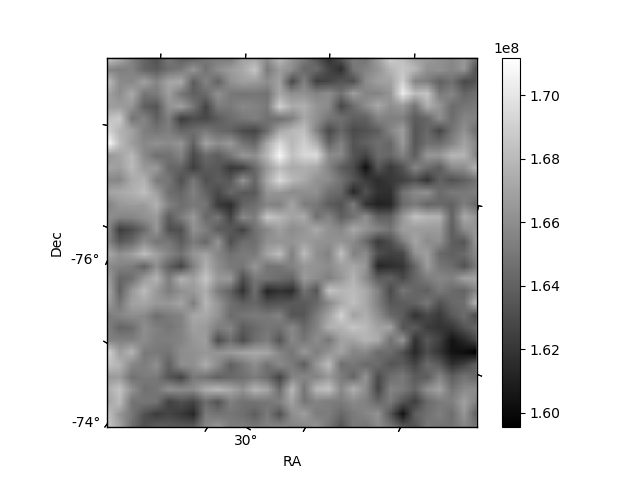
Quadrant B |
|---|---|---|---|
| Quadrant D | 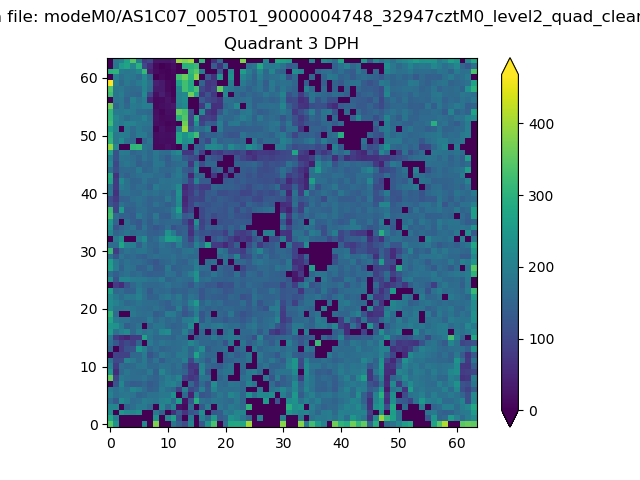 |
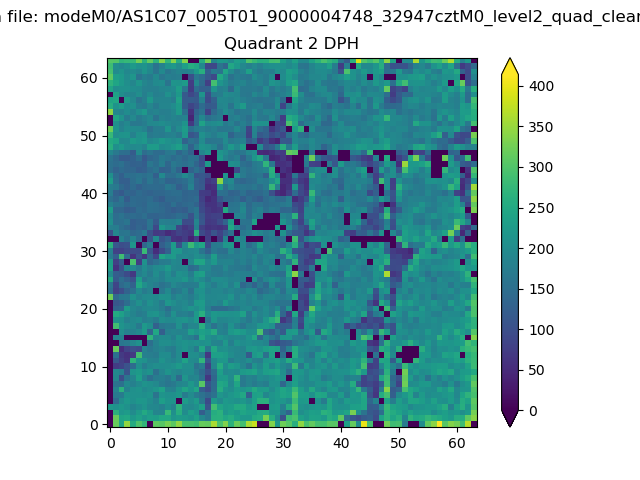 |
Quadrant C |
| Plot type | Count rate plots | Images |
|---|---|---|
| Comparison with Poisson distribution Blue bars denote a histogram of data divided into 1 sec bins. Red curve is a Poisson curve with rate = median count rate of data. |
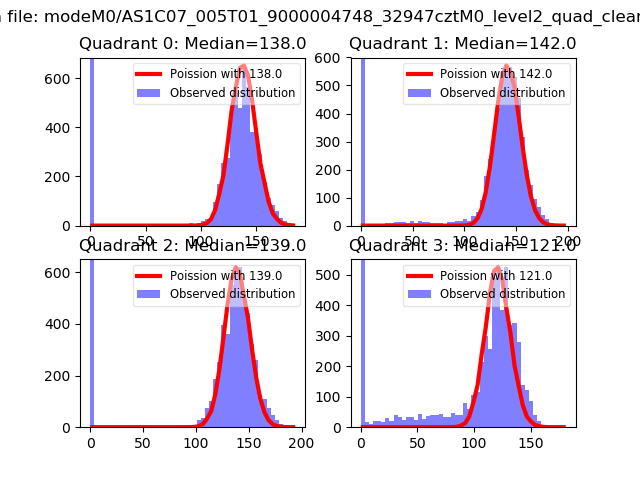 |
 |
| Quadrant-wise count rates Data is divided into 100 sec bins |
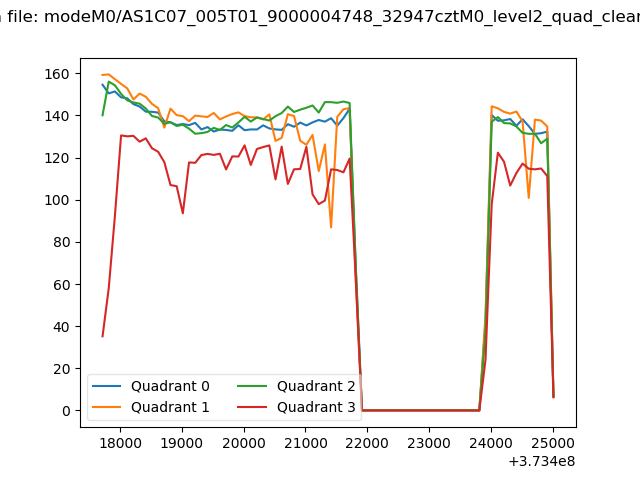 |
|
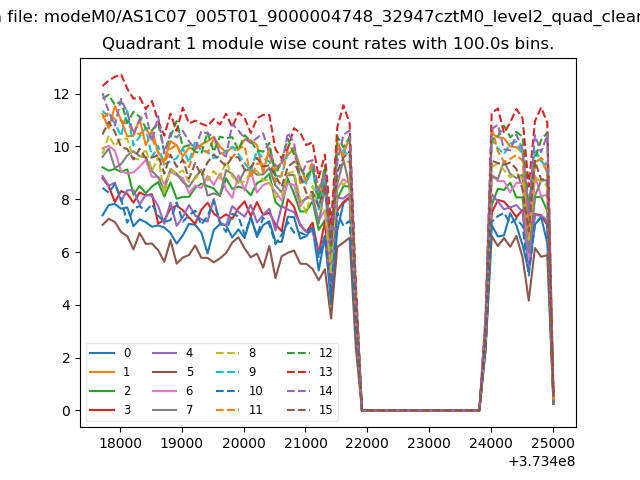
| Module-wise count rates for Quadrant A Data is divided into 100 sec bins |
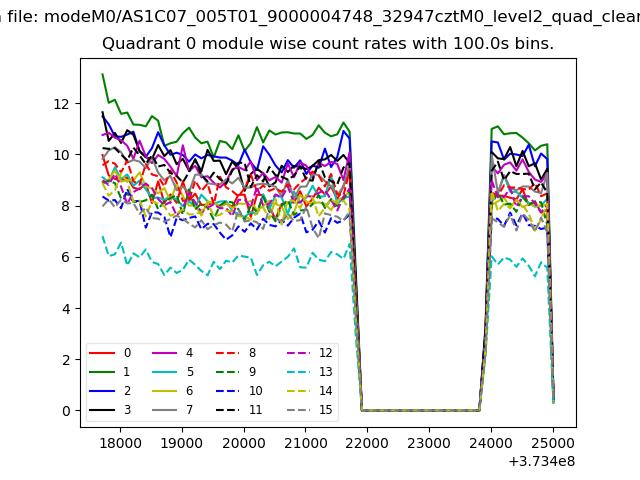 |
 |
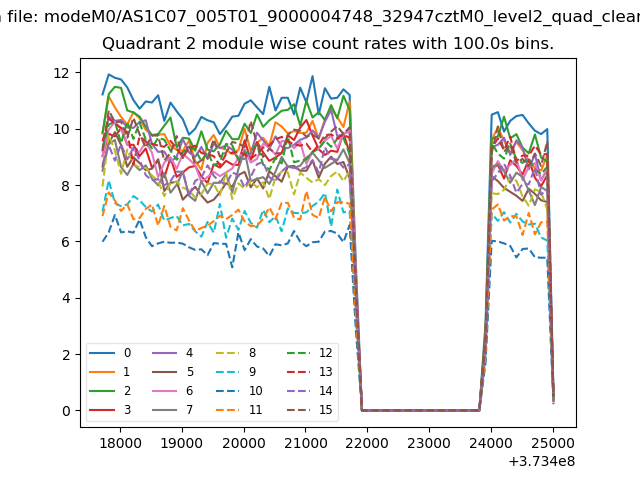
| Module-wise count rates for Quadrant B Data is divided into 100 sec bins |
 |
 |
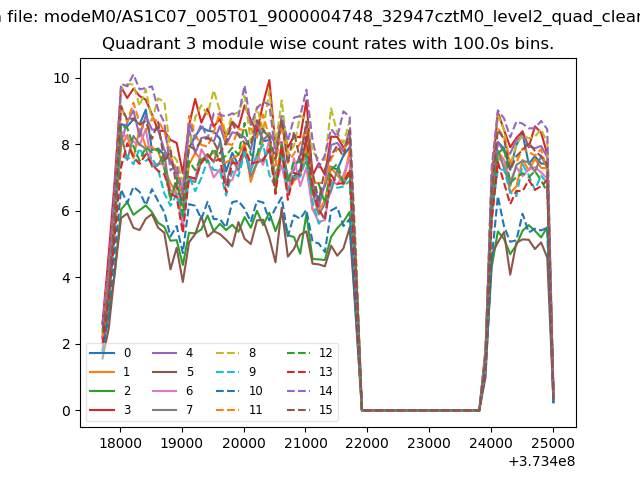
| Module-wise count rates for Quadrant C Data is divided into 100 sec bins |
 |
 |
| Module-wise count rates for Quadrant D Data is divided into 100 sec bins |
 |
 |
| Parameter | Plot |
|---|---|
| CZT HV Monitor | 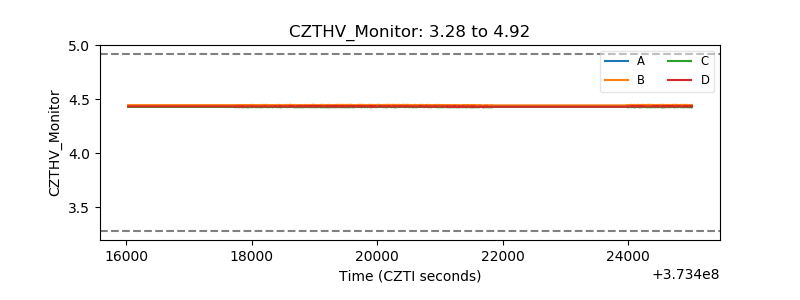 |
| D_VDD | 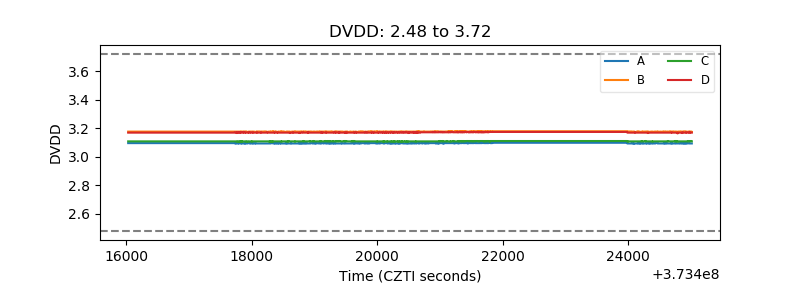 |
| Temperature 1 | 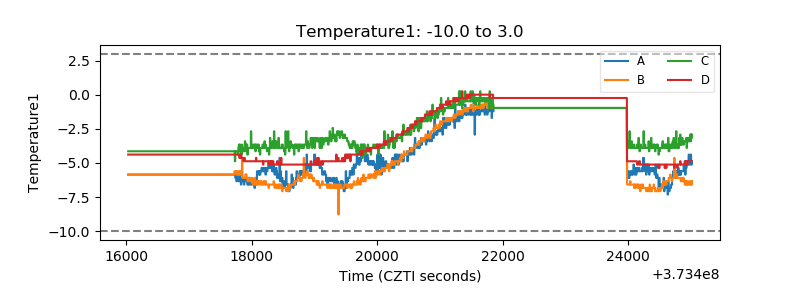 |
| Veto HV Monitor |  |
| Veto LLD | 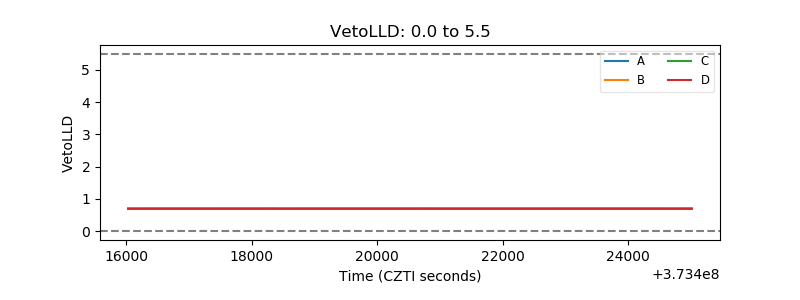 |
| Alpha Counter | 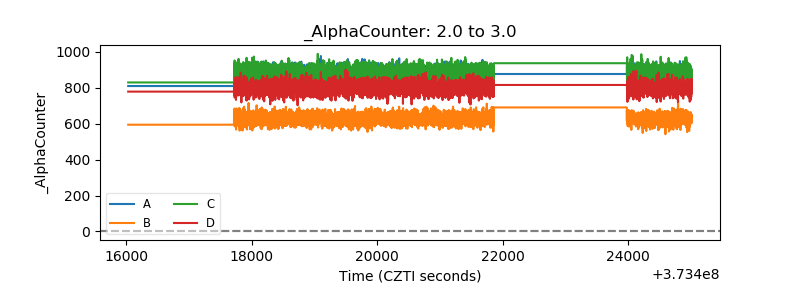 |
| _CPM_Rate | 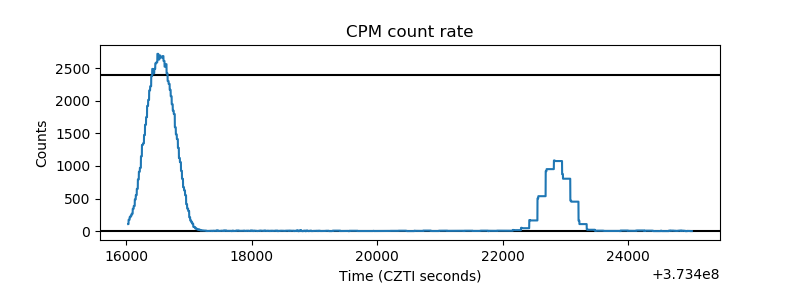 |
| CZT Counter | 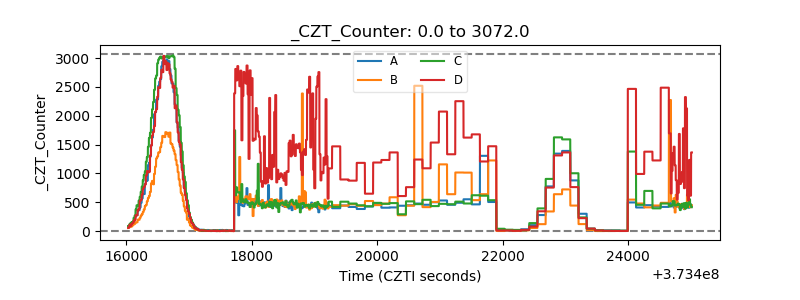 |
| +2.5 Volts monitor |  |
| +5 Volts monitor |  |
| _ROLL_ROT | 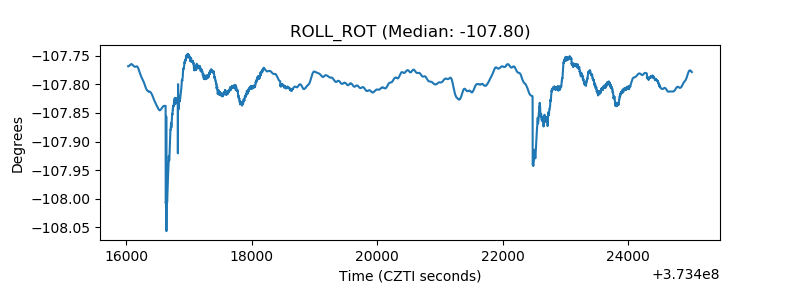 |
| _Roll_DEC | 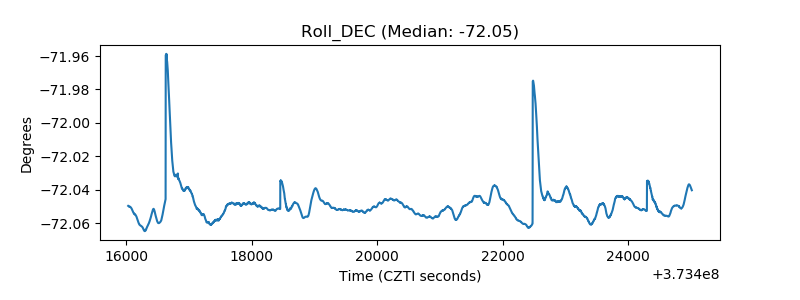 |
| _Roll_RA | 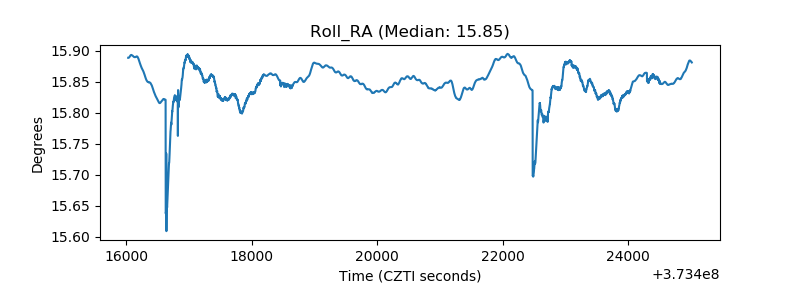 |
| Veto Counter | 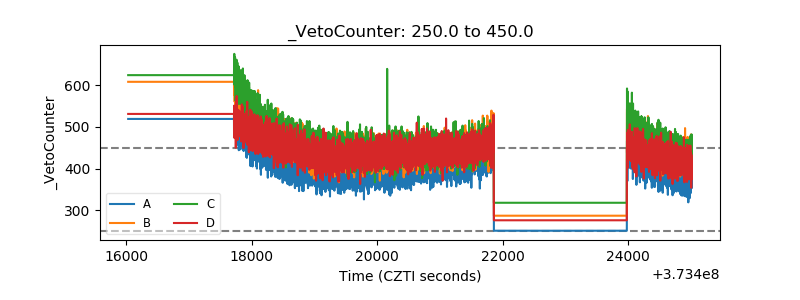 |