| Param | Original file | Final file |
|---|---|---|
| Filename | modeM0/AS1C07_005T01_9000004748_32948cztM0_level2.evt | modeM0/AS1C07_005T01_9000004748_32948cztM0_level2_quad_clean.evt |
| Size (bytes) | 502,318,080 | 100,549,440 |
| Size | 479.0 MB | 95.9 MB |
| Events in quadrant A | 2,499,207 | 690,827 |
| Events in quadrant B | 3,437,528 | 695,602 |
| Events in quadrant C | 2,550,957 | 698,742 |
| Events in quadrant D | 6,367,430 | 590,318 |
| Mode SS | |||
|---|---|---|---|
| Quadrant | BADHDUFLAG | Total packets | Discarded packets |
| A | 0 | 108 | 0 |
| B | 0 | 108 | 0 |
| C | 0 | 108 | 0 |
| D | 0 | 108 | 0 |
| Mode M9 | |||
|---|---|---|---|
| Quadrant | BADHDUFLAG | Total packets | Discarded packets |
| A | 0 | 29 | 0 |
| B | 0 | 29 | 0 |
| C | 0 | 29 | 0 |
| D | 0 | 30 | 0 |
| Mode M0 | |||
|---|---|---|---|
| Quadrant | BADHDUFLAG | Total packets | Discarded packets |
| A | 0 | 10844 | 3 |
| B | 0 | 13661 | 2 |
| C | 0 | 11016 | 2 |
| D | 0 | 22573 | 2 |
| Quadrant | Total seconds | Saturated seconds | Saturation percentage |
|---|---|---|---|
| A | 5271 | 22 | 0.417378% |
| B | 5271 | 298 | 5.653576% |
| C | 5271 | 27 | 0.512237% |
| D | 5271 | 1012 | 19.199393% |
Noise dominated data is calculated using 1-second bins in cleaned event files. If a bin has >2000 counts, and if more than 50% of those come from <1% of pixels, then it is considered to be noise-dominated and hence unusable.
| Quadrant | # 1 sec bins | Bins with >0 counts | Bins with >2000 counts | High rate bins dominated by noise | Noise dominated (total time) | Noise dominated (detector-on time) | Marked lightcurve |
|---|---|---|---|---|---|---|---|
| A | 7242 | 5272 | 12 | 12 | 0.17% | 0.23% | 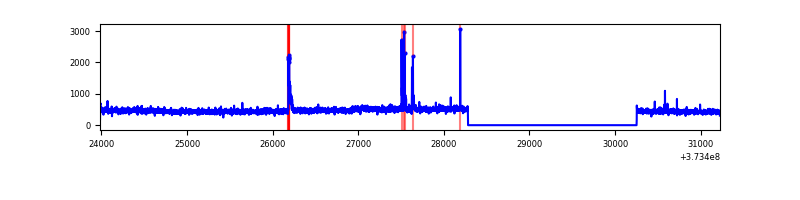 |
| B | 7242 | 5272 | 179 | 179 | 2.47% | 3.40% | 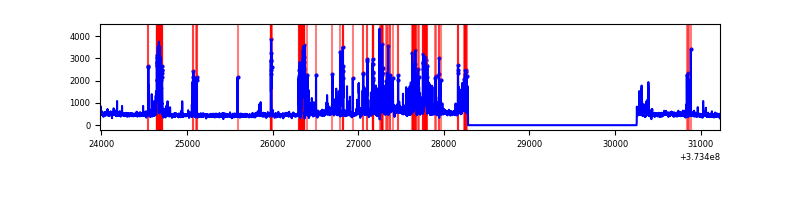 |
| C | 7242 | 5272 | 23 | 23 | 0.32% | 0.44% | 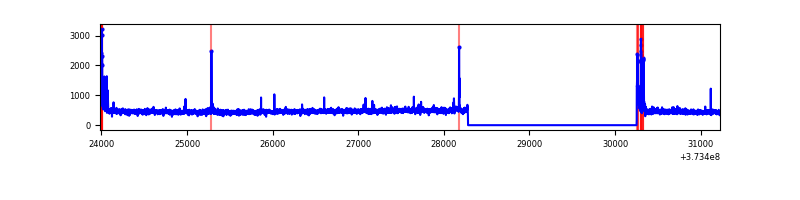 |
| D | 7242 | 5272 | 842 | 842 | 11.63% | 15.97% | 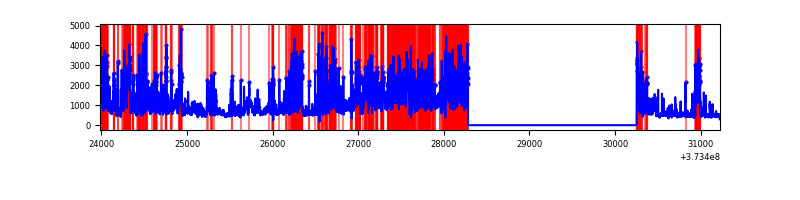 |
Top three noisy pixels from each quadrant. If the there are fewer than three noisy pixels in the level2.evt file, extra rows are filled as -1
| Pixel properties | Quadrant properties | ||||||
|---|---|---|---|---|---|---|---|
| Quadrant | DetID | PixID | Counts | Sigma | Mean | Median | Sigma |
| A | 0 | 191 | 72595 | 587.63 | 612 | 601 | 122.5 |
| A | 0 | 253 | 24842 | 197.86 | 612 | 601 | 122.5 |
| A | 14 | 238 | 10467 | 80.53 | 612 | 601 | 122.5 |
| B | 5 | 172 | 869798 | 7697.19 | 606 | 591 | 112.9 |
| B | 0 | 219 | 46250 | 404.33 | 606 | 591 | 112.9 |
| B | 0 | 189 | 36022 | 313.76 | 606 | 591 | 112.9 |
| C | 0 | 10 | 118913 | 853.56 | 606 | 610 | 138.6 |
| C | 3 | 233 | 23276 | 163.54 | 606 | 610 | 138.6 |
| C | 14 | 67 | 16007 | 111.09 | 606 | 610 | 138.6 |
| D | 12 | 218 | 1401081 | 9753.71 | 551 | 538 | 143.6 |
| D | 7 | 80 | 975786 | 6791.85 | 551 | 538 | 143.6 |
| D | 8 | 195 | 710811 | 4946.51 | 551 | 538 | 143.6 |
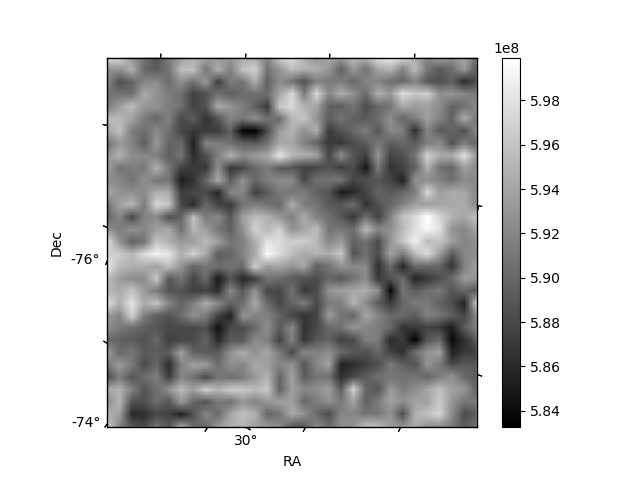
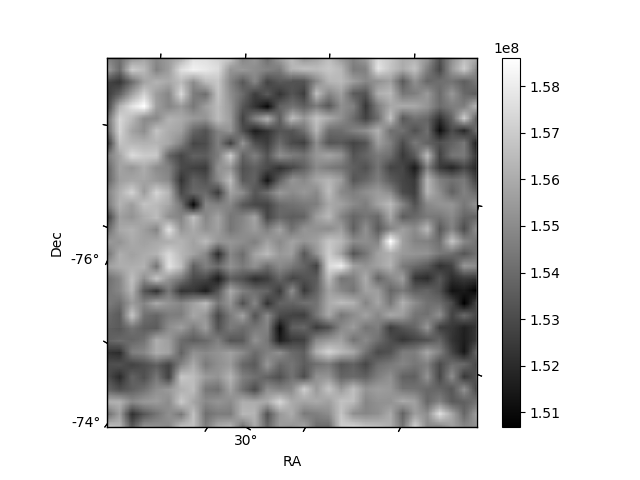
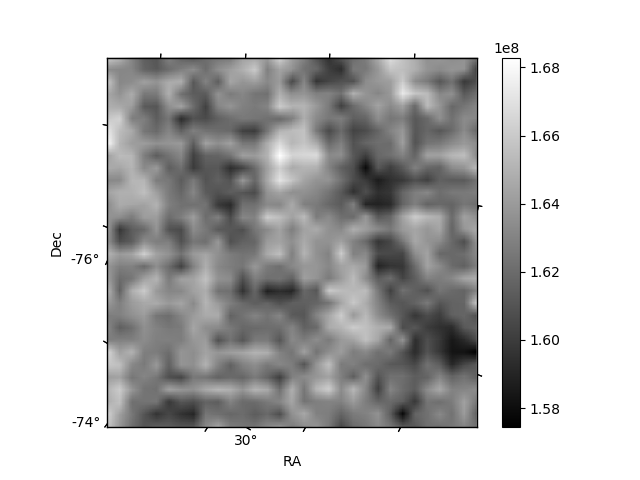
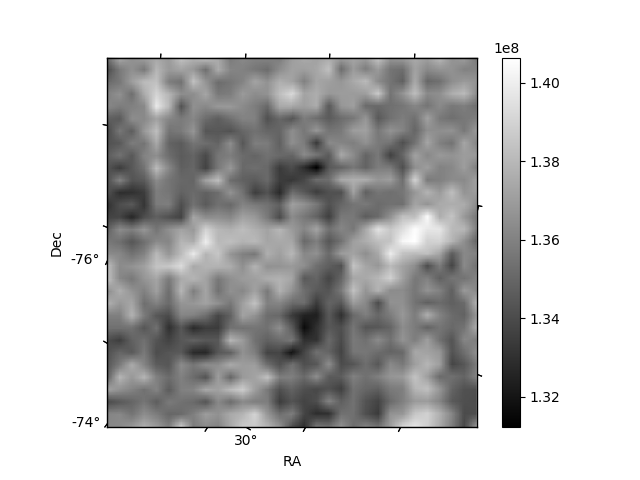
Histogram calculated using DETX and DETY for each event in the final _common_clean file
| Quadrant A | 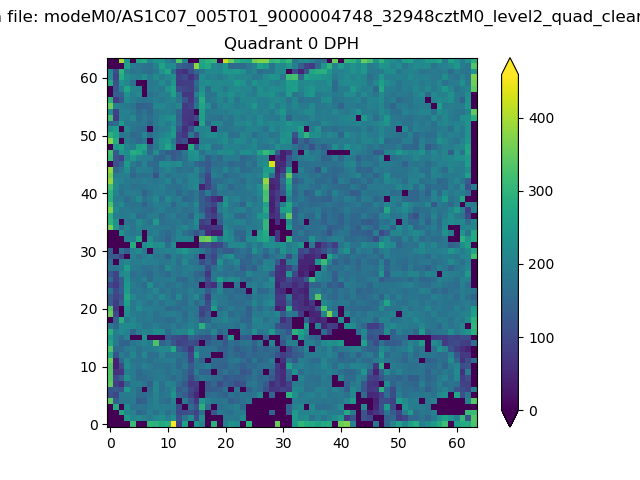 |
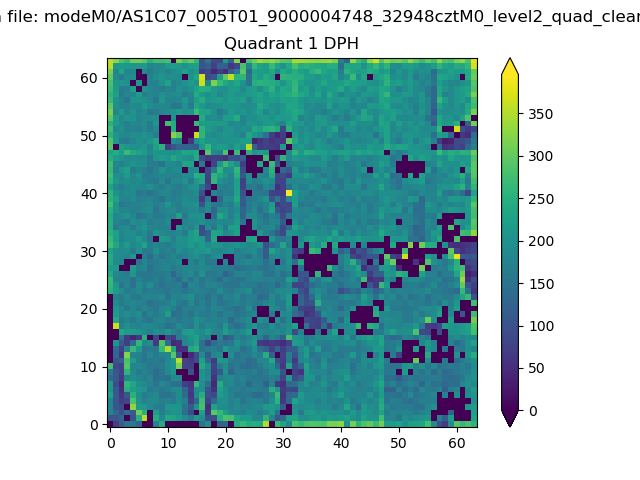 |
Quadrant B |
|---|---|---|---|
| Quadrant D | 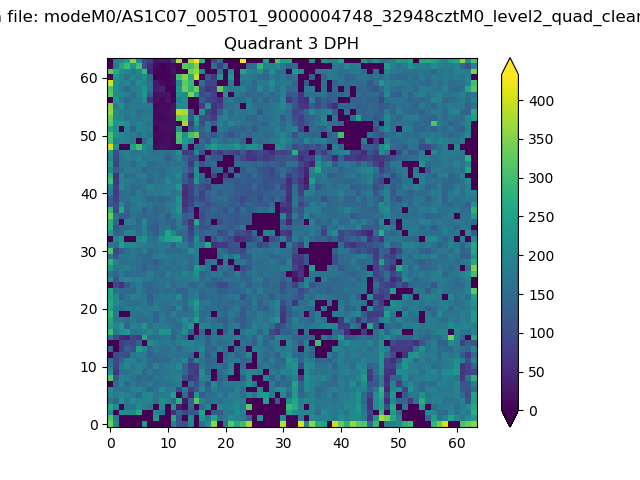 |
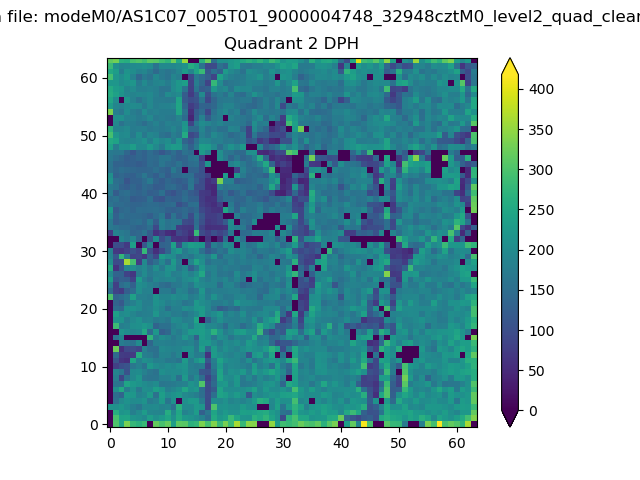 |
Quadrant C |
| Plot type | Count rate plots | Images |
|---|---|---|
| Comparison with Poisson distribution Blue bars denote a histogram of data divided into 1 sec bins. Red curve is a Poisson curve with rate = median count rate of data. |
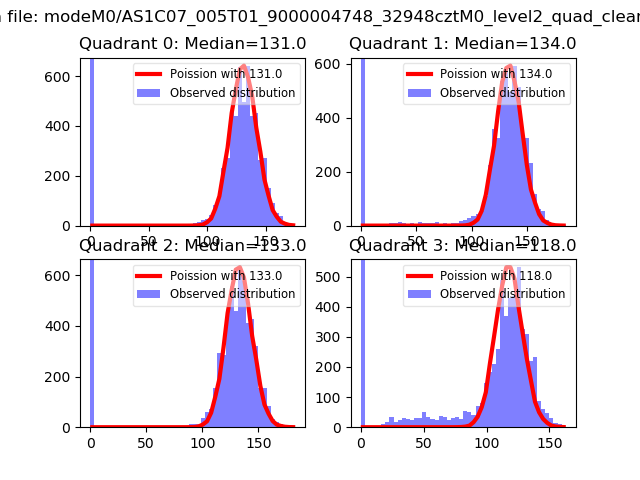 |
 |
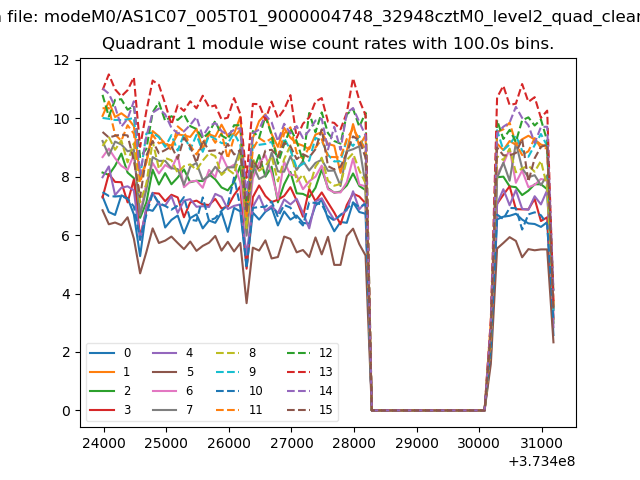
| Quadrant-wise count rates Data is divided into 100 sec bins |
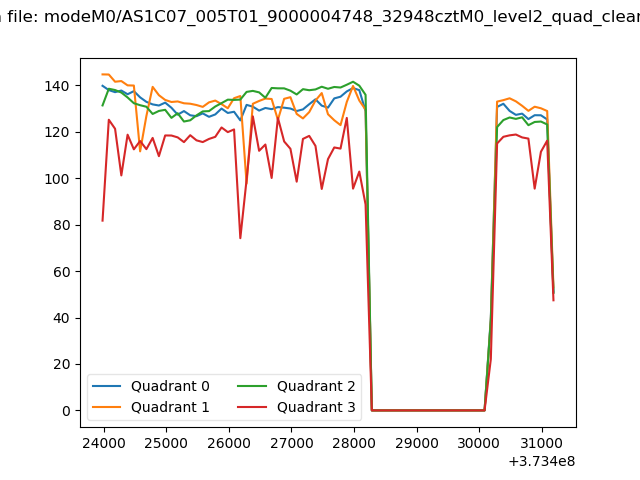 |
|
| Module-wise count rates for Quadrant A Data is divided into 100 sec bins |
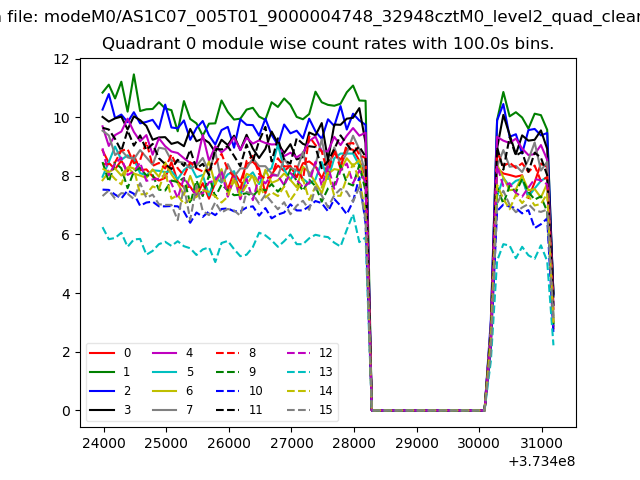 |
 |
| Module-wise count rates for Quadrant B Data is divided into 100 sec bins |
 |
 |
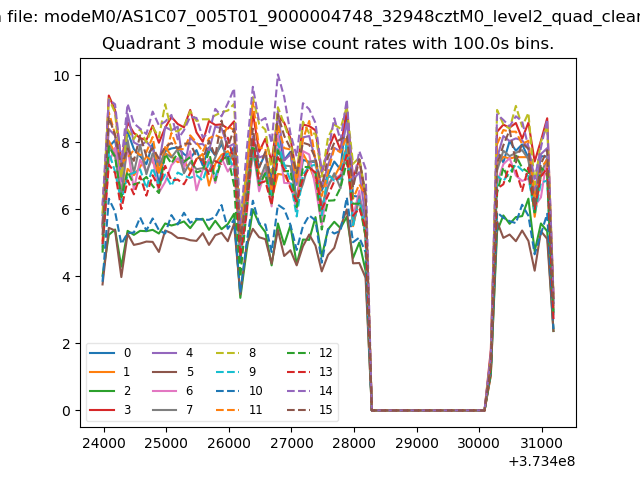
| Module-wise count rates for Quadrant C Data is divided into 100 sec bins |
 |
 |
| Module-wise count rates for Quadrant D Data is divided into 100 sec bins |
 |
 |
| Parameter | Plot |
|---|---|
| CZT HV Monitor |  |
| D_VDD |  |
| Temperature 1 | 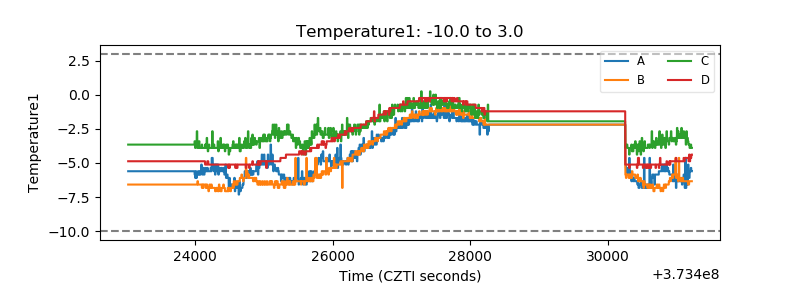 |
| Veto HV Monitor |  |
| Veto LLD | 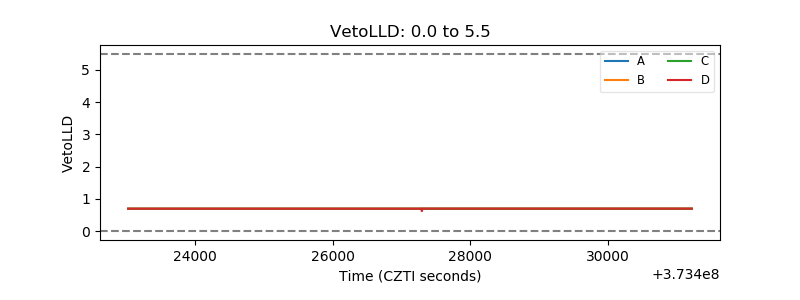 |
| Alpha Counter | 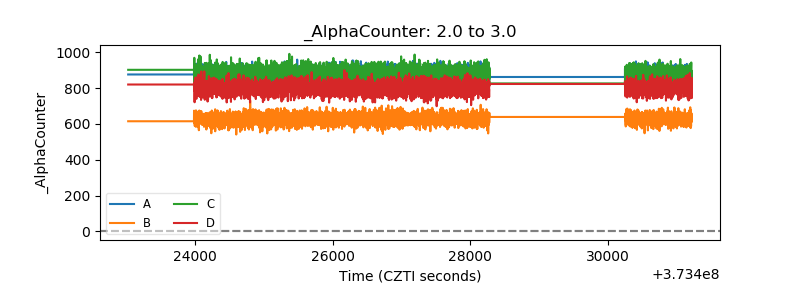 |
| _CPM_Rate | 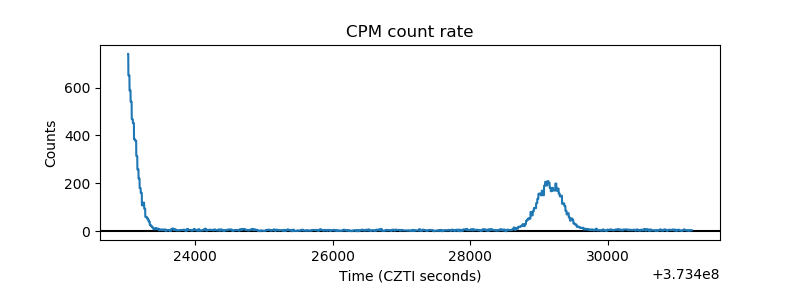 |
| CZT Counter | 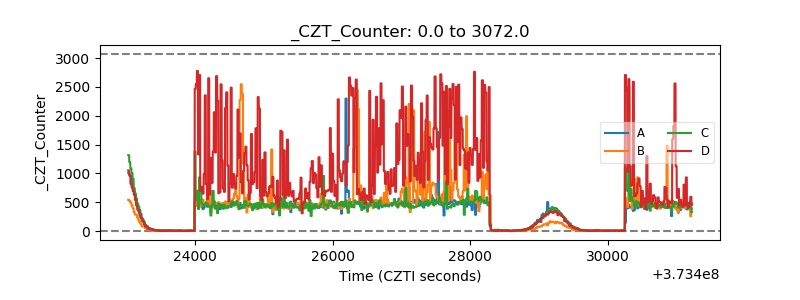 |
| +2.5 Volts monitor |  |
| +5 Volts monitor |  |
| _ROLL_ROT | 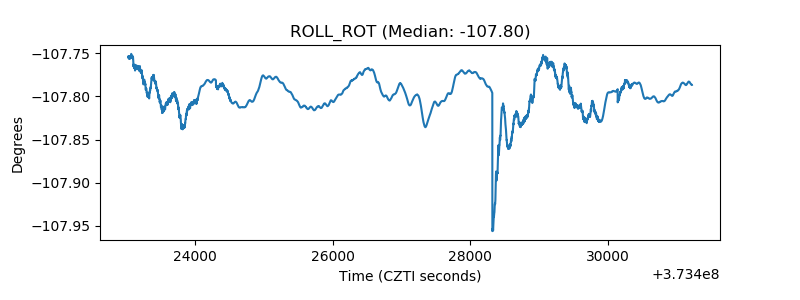 |
| _Roll_DEC | 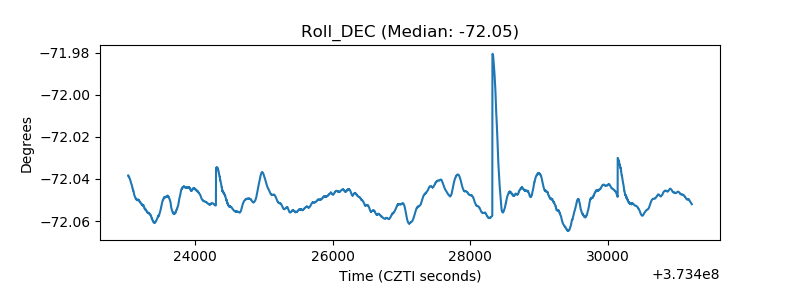 |
| _Roll_RA |  |
| Veto Counter | 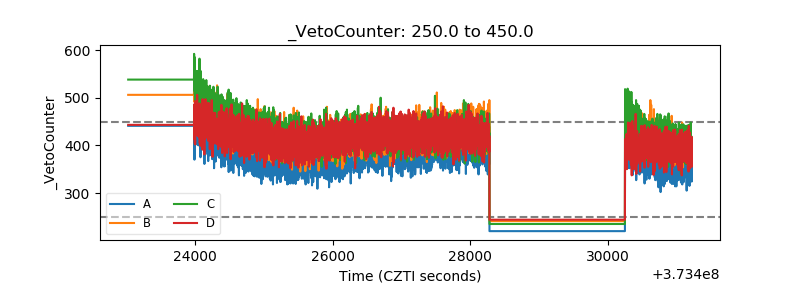 |