| Param | Original file | Final file |
|---|---|---|
| Filename | modeM0/AS1C07_005T01_9000004748_32949cztM0_level2.evt | modeM0/AS1C07_005T01_9000004748_32949cztM0_level2_quad_clean.evt |
| Size (bytes) | 491,708,160 | 83,134,080 |
| Size | 468.9 MB | 79.3 MB |
| Events in quadrant A | 2,077,485 | 587,930 |
| Events in quadrant B | 3,398,253 | 577,046 |
| Events in quadrant C | 2,154,558 | 596,868 |
| Events in quadrant D | 6,946,726 | 429,700 |
| Mode SS | |||
|---|---|---|---|
| Quadrant | BADHDUFLAG | Total packets | Discarded packets |
| A | 0 | 92 | 0 |
| B | 0 | 92 | 0 |
| C | 0 | 92 | 0 |
| D | 0 | 92 | 0 |
| Mode M9 | |||
|---|---|---|---|
| Quadrant | BADHDUFLAG | Total packets | Discarded packets |
| A | 0 | 14 | 0 |
| B | 0 | 14 | 0 |
| C | 0 | 14 | 0 |
| D | 0 | 15 | 0 |
| Mode M0 | |||
|---|---|---|---|
| Quadrant | BADHDUFLAG | Total packets | Discarded packets |
| A | 0 | 9295 | 1 |
| B | 0 | 13151 | 1 |
| C | 0 | 9542 | 1 |
| D | 0 | 23733 | 1 |
| Quadrant | Total seconds | Saturated seconds | Saturation percentage |
|---|---|---|---|
| A | 4628 | 2 | 0.043215% |
| B | 4628 | 387 | 8.362143% |
| C | 4628 | 17 | 0.367329% |
| D | 4628 | 1900 | 41.054451% |
Noise dominated data is calculated using 1-second bins in cleaned event files. If a bin has >2000 counts, and if more than 50% of those come from <1% of pixels, then it is considered to be noise-dominated and hence unusable.
| Quadrant | # 1 sec bins | Bins with >0 counts | Bins with >2000 counts | High rate bins dominated by noise | Noise dominated (total time) | Noise dominated (detector-on time) | Marked lightcurve |
|---|---|---|---|---|---|---|---|
| A | 4628 | 4628 | 0 | 0 | 0.00% | 0.00% |  |
| B | 4628 | 4628 | 272 | 272 | 5.88% | 5.88% |  |
| C | 4628 | 4628 | 13 | 13 | 0.28% | 0.28% |  |
| D | 4628 | 4628 | 1759 | 1759 | 38.01% | 38.01% |  |
Top three noisy pixels from each quadrant. If the there are fewer than three noisy pixels in the level2.evt file, extra rows are filled as -1
| Pixel properties | Quadrant properties | ||||||
|---|---|---|---|---|---|---|---|
| Quadrant | DetID | PixID | Counts | Sigma | Mean | Median | Sigma |
| A | 13 | 254 | 8883 | 77.26 | 533 | 520 | 108.2 |
| A | 3 | 137 | 4855 | 40.05 | 533 | 520 | 108.2 |
| A | 0 | 226 | 4617 | 37.85 | 533 | 520 | 108.2 |
| B | 5 | 172 | 1205080 | 12346.69 | 516 | 503 | 97.6 |
| B | 5 | 200 | 39997 | 404.81 | 516 | 503 | 97.6 |
| B | 0 | 229 | 23204 | 232.68 | 516 | 503 | 97.6 |
| C | 0 | 10 | 54224 | 445.71 | 520 | 524 | 120.5 |
| C | 1 | 241 | 39098 | 320.16 | 520 | 524 | 120.5 |
| C | 14 | 67 | 11783 | 93.45 | 520 | 524 | 120.5 |
| D | 12 | 227 | 2860996 | 26656.88 | 416 | 406 | 107.3 |
| D | 12 | 218 | 1042459 | 9710.54 | 416 | 406 | 107.3 |
| D | 8 | 195 | 600226 | 5589.52 | 416 | 406 | 107.3 |
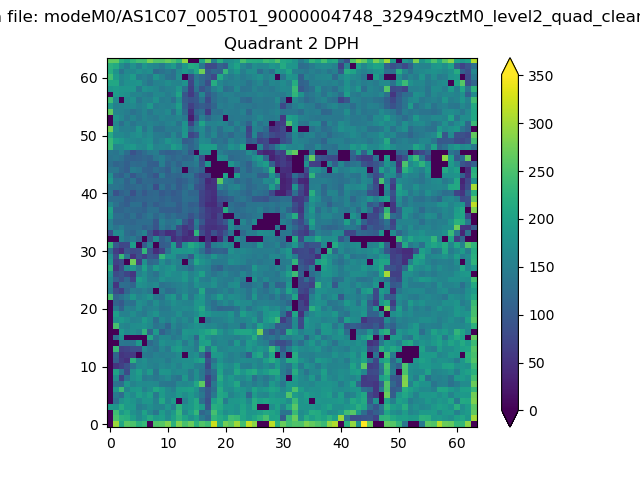
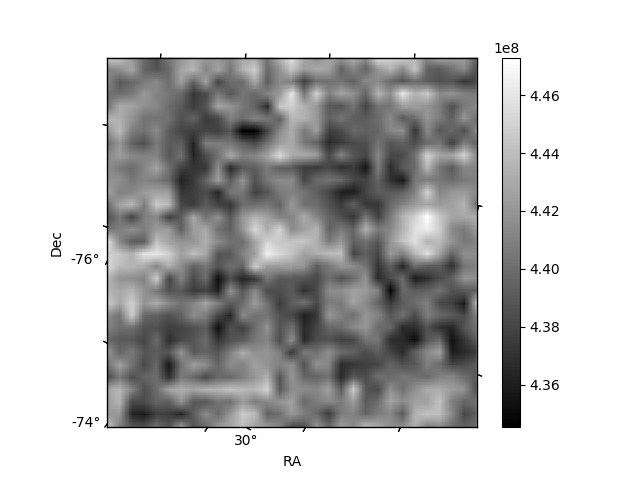
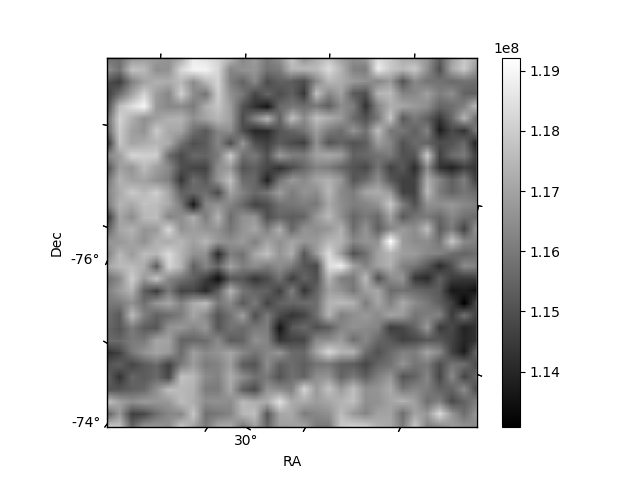
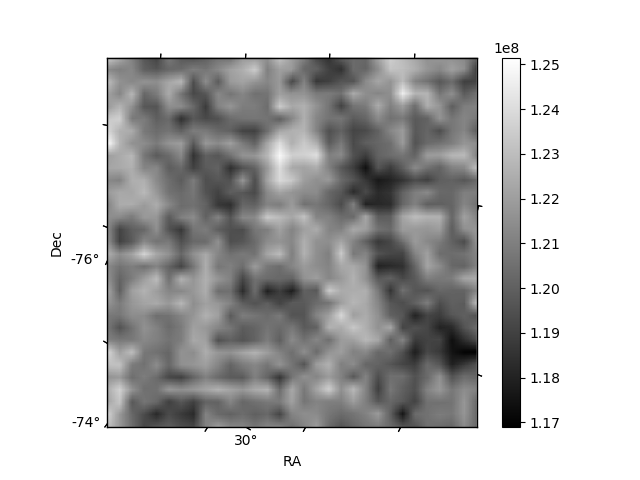
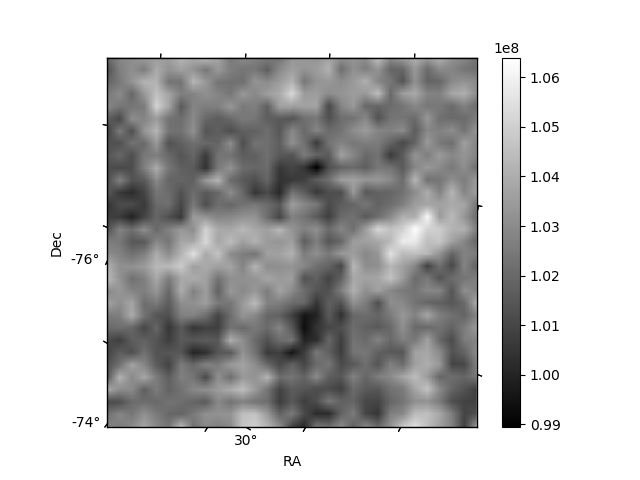
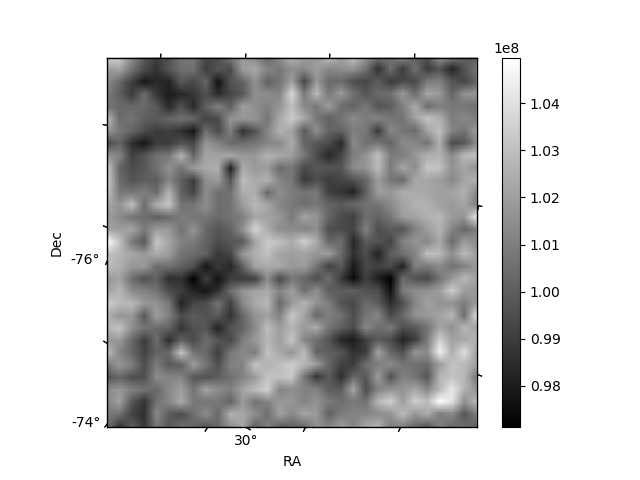
Histogram calculated using DETX and DETY for each event in the final _common_clean file
| Quadrant A | 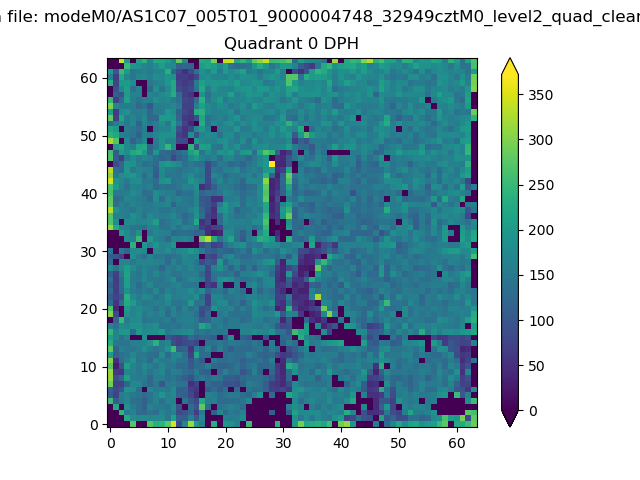 |
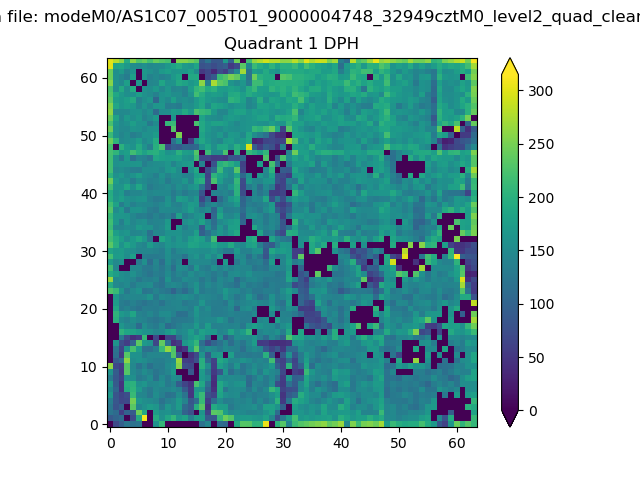 |
Quadrant B |
|---|---|---|---|
| Quadrant D | 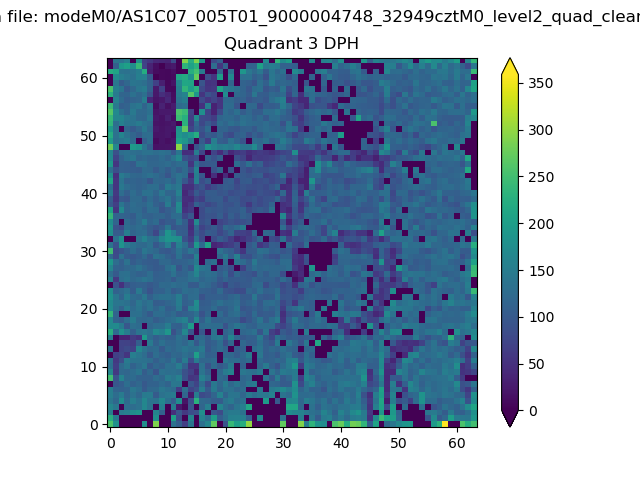 |
 |
Quadrant C |
| Plot type | Count rate plots | Images |
|---|---|---|
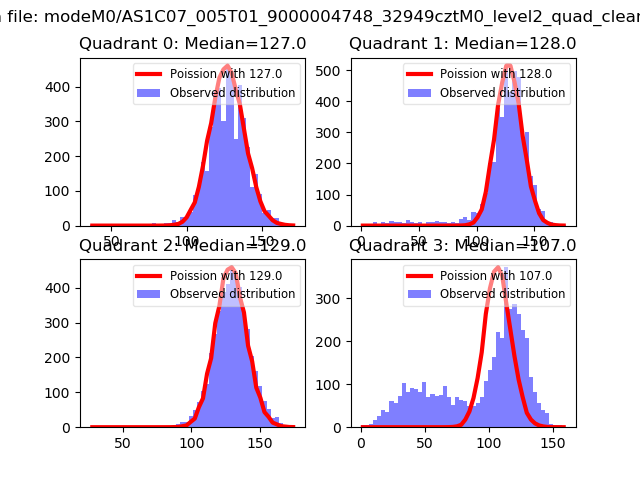
| Comparison with Poisson distribution Blue bars denote a histogram of data divided into 1 sec bins. Red curve is a Poisson curve with rate = median count rate of data. |
 |
 |
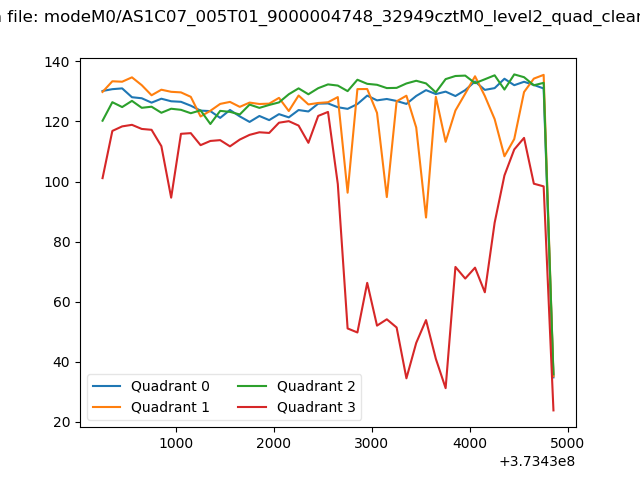
| Quadrant-wise count rates Data is divided into 100 sec bins |
 |
|
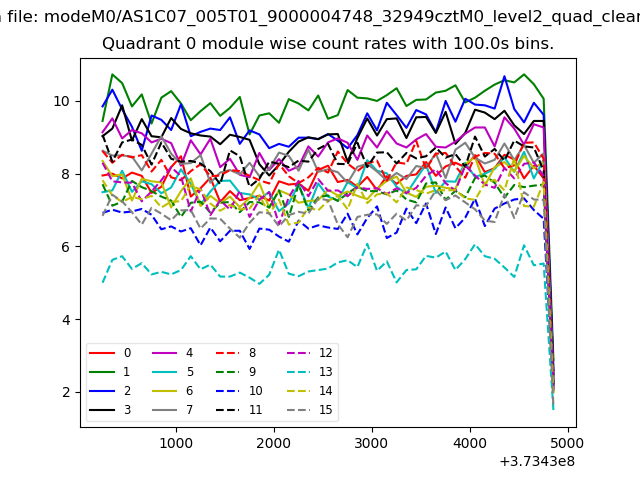
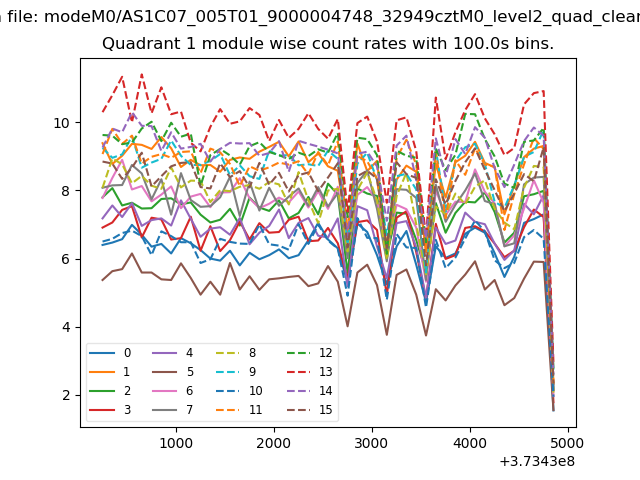
| Module-wise count rates for Quadrant A Data is divided into 100 sec bins |
 |
 |
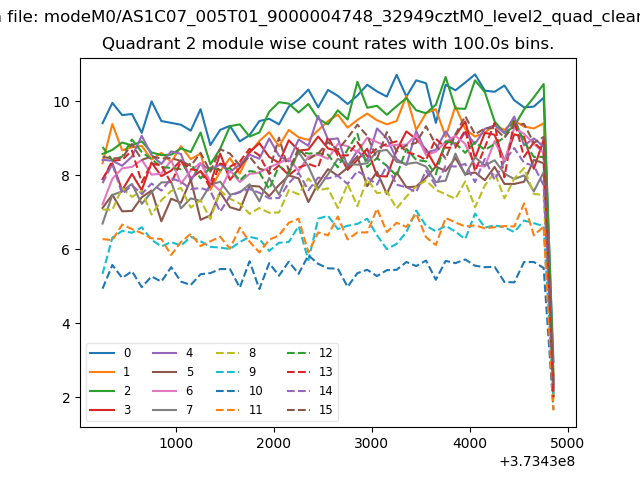
| Module-wise count rates for Quadrant B Data is divided into 100 sec bins |
 |
 |
| Module-wise count rates for Quadrant C Data is divided into 100 sec bins |
 |
 |
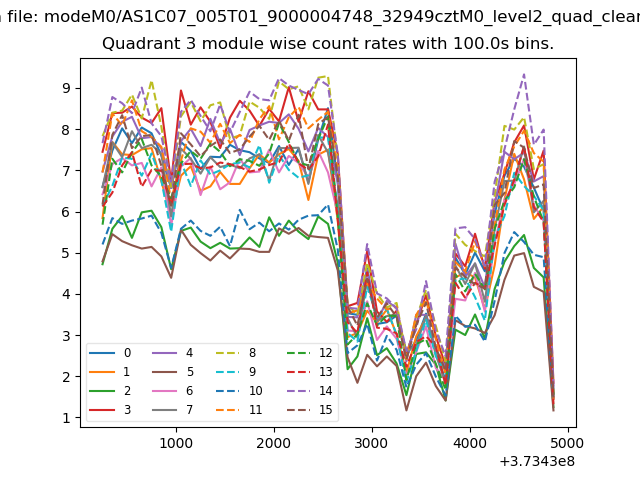
| Module-wise count rates for Quadrant D Data is divided into 100 sec bins |
 |
 |
| Parameter | Plot |
|---|---|
| CZT HV Monitor | 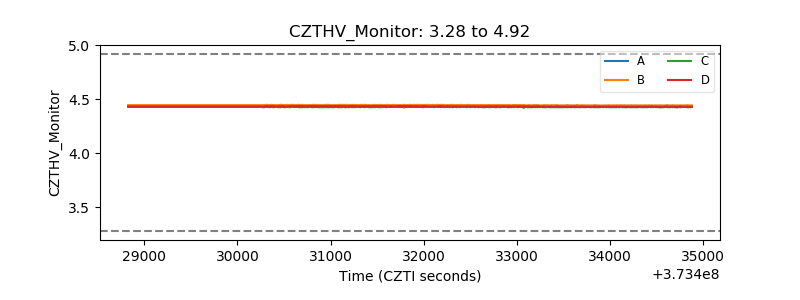 |
| D_VDD | 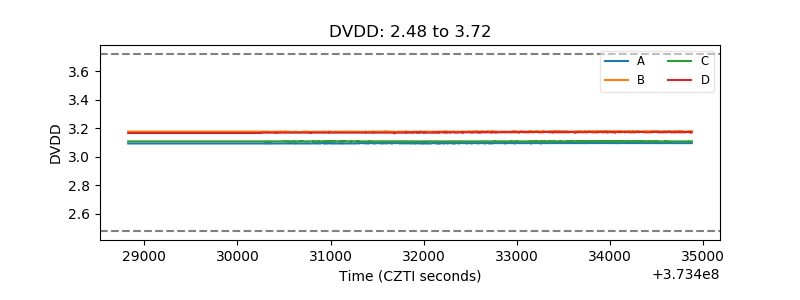 |
| Temperature 1 |  |
| Veto HV Monitor |  |
| Veto LLD | 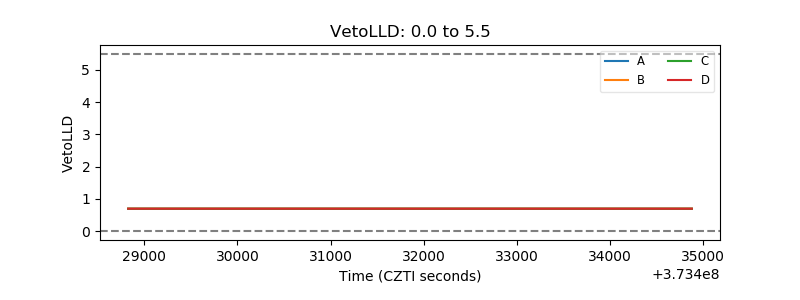 |
| Alpha Counter | 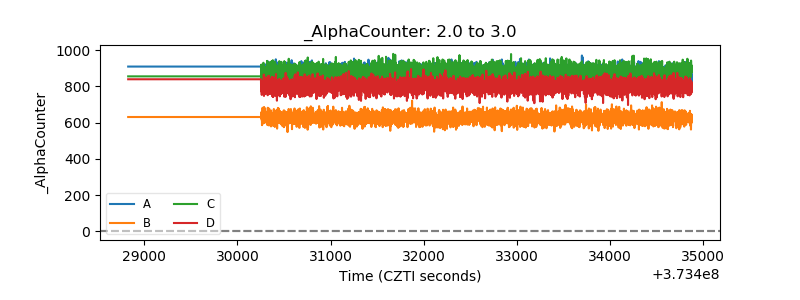 |
| _CPM_Rate | 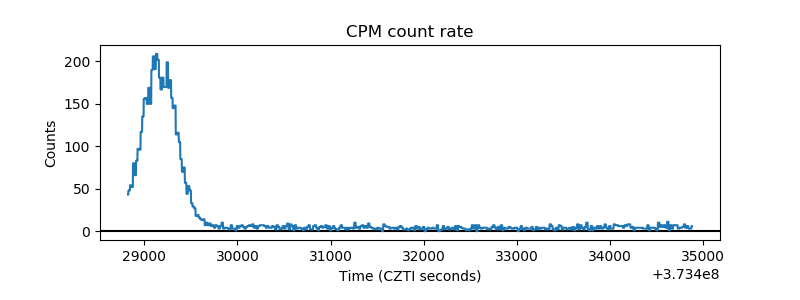 |
| CZT Counter | 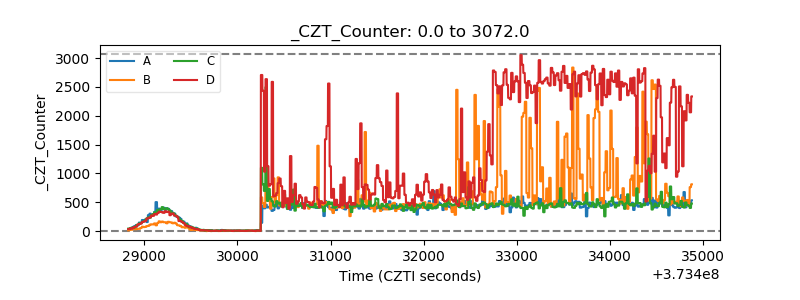 |
| +2.5 Volts monitor |  |
| +5 Volts monitor |  |
| _ROLL_ROT | 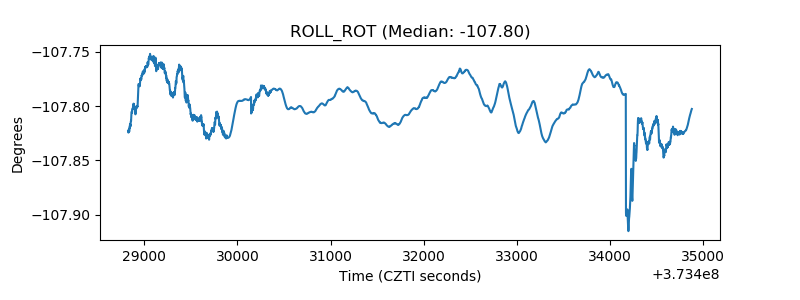 |
| _Roll_DEC | 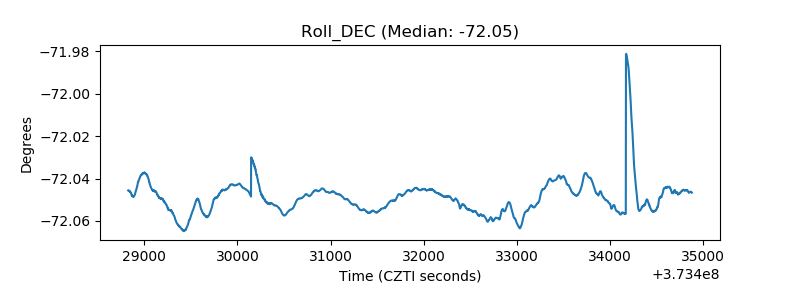 |
| _Roll_RA | 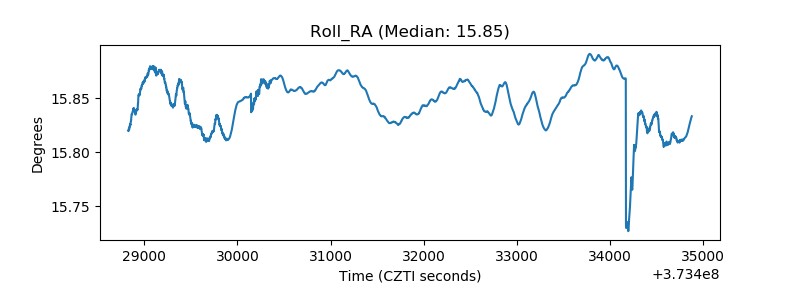 |
| Veto Counter | 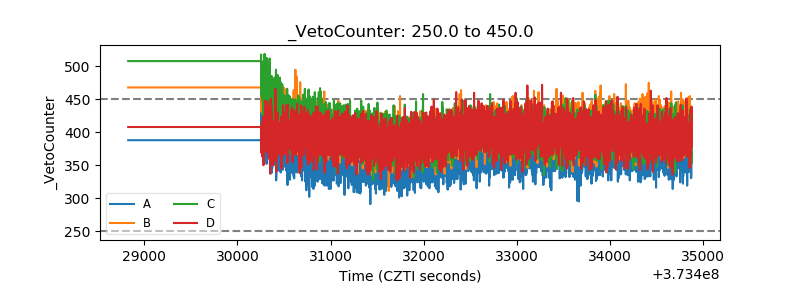 |