| Param | Original file | Final file |
|---|---|---|
| Filename | modeM0/AS1C07_001T01_9000004752cztM0_level2.fits | modeM0/AS1C07_001T01_9000004752cztM0_level2_quad_clean.evt |
| Size (bytes) | 650,689,920 | 904,360,320 |
| Size | 620.5 MB | 862.5 MB |
| Events in quadrant A | 4,027,950 | 6,181,642 |
| Events in quadrant B | 3,688,794 | 5,690,024 |
| Events in quadrant C | 3,996,892 | 5,913,003 |
| Events in quadrant D | 3,145,998 | 4,766,756 |
| Mode M0 | |||
|---|---|---|---|
| Quadrant | BADHDUFLAG | Total packets | Discarded packets |
| A | 0 | 142993 | 0 |
| B | 0 | 202749 | 0 |
| C | 0 | 155466 | 0 |
| D | 0 | 304242 | 0 |
| Mode SS | |||
|---|---|---|---|
| Quadrant | BADHDUFLAG | Total packets | Discarded packets |
| A | 0 | 1438 | 0 |
| B | 0 | 1438 | 0 |
| C | 0 | 1438 | 0 |
| D | 0 | 1438 | 0 |
| Mode M9 | |||
|---|---|---|---|
| Quadrant | BADHDUFLAG | Total packets | Discarded packets |
| A | 0 | 262 | 0 |
| B | 0 | 262 | 0 |
| C | 0 | 262 | 0 |
| D | 0 | 262 | 0 |
| Quadrant | Total seconds | Saturated seconds | Saturation percentage |
|---|---|---|---|
| A | 70589 | 99 | 0.140248% |
| B | 70589 | 6805 | 9.640312% |
| C | 70589 | 920 | 1.303319% |
| D | 70589 | 9358 | 13.257023% |
Noise dominated data is calculated using 1-second bins in cleaned event files. If a bin has >2000 counts, and if more than 50% of those come from <1% of pixels, then it is considered to be noise-dominated and hence unusable.
| Quadrant | # 1 sec bins | Bins with >0 counts | Bins with >2000 counts | High rate bins dominated by noise | Noise dominated (total time) | Noise dominated (detector-on time) | Marked lightcurve |
|---|---|---|---|---|---|---|---|
| A | 95856 | 70587 | 0 | 0 | 0.00% | 0.00% |  |
| B | 95855 | 70347 | 0 | 0 | 0.00% | 0.00% |  |
| C | 95856 | 70570 | 0 | 0 | 0.00% | 0.00% | 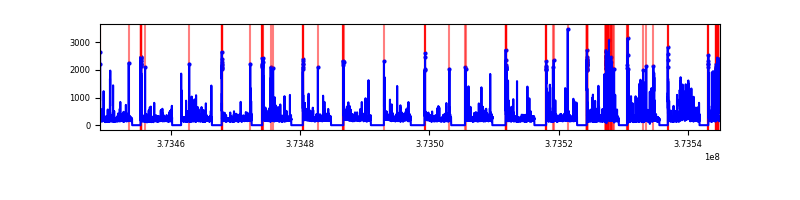 |
| D | 95856 | 70523 | 0 | 0 | 0.00% | 0.00% | 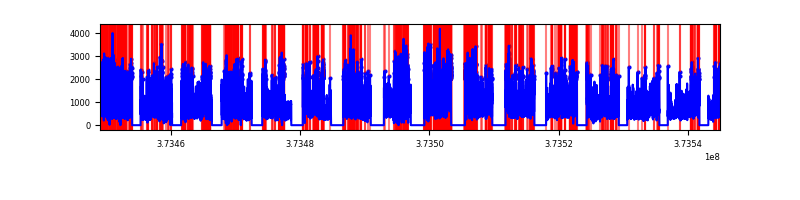 |
Top three noisy pixels from each quadrant. If the there are fewer than three noisy pixels in the level2.evt file, extra rows are filled as -1
| Pixel properties | Quadrant properties | ||||||
|---|---|---|---|---|---|---|---|
| Quadrant | DetID | PixID | Counts | Sigma | Mean | Median | Sigma |
| A | 7 | 110 | 3405 | 9.35 | 1054 | 996 | 257.6 |
| A | 0 | 29 | 3332 | 9.07 | 1054 | 996 | 257.6 |
| A | 9 | 19 | 3264 | 8.8 | 1054 | 996 | 257.6 |
| B | 2 | 9 | 3088 | 11.29 | 979 | 936 | 190.7 |
| B | 3 | 80 | 2733 | 9.42 | 979 | 936 | 190.7 |
| B | 2 | 8 | 2529 | 8.35 | 979 | 936 | 190.7 |
| C | 3 | 202 | 3167 | 8.14 | 1057 | 1000 | 266.4 |
| C | 3 | 203 | 3103 | 7.9 | 1057 | 1000 | 266.4 |
| C | 3 | 187 | 2813 | 6.81 | 1057 | 1000 | 266.4 |
| D | 4 | 160 | 2451 | 6.83 | 903 | 827 | 237.7 |
| D | 10 | 189 | 2375 | 6.51 | 903 | 827 | 237.7 |
| D | 6 | 62 | 2312 | 6.25 | 903 | 827 | 237.7 |
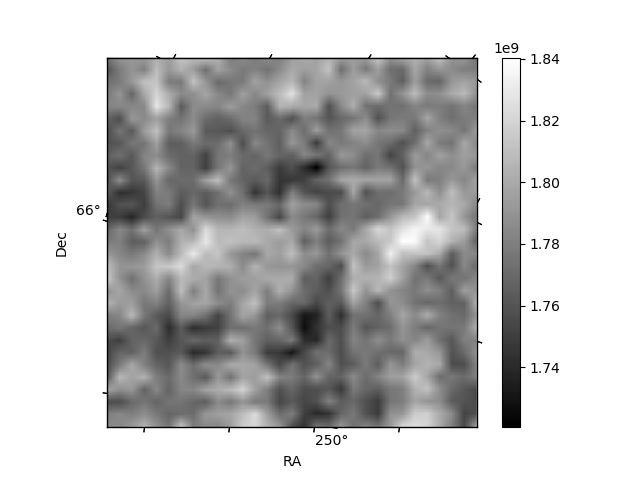
Histogram calculated using DETX and DETY for each event in the final _common_clean file
| Quadrant A | 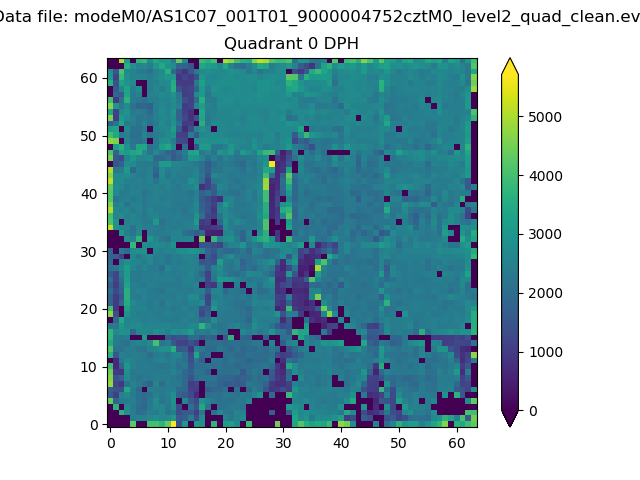 |
 |
Quadrant B |
|---|---|---|---|
| Quadrant D |  |
 |
Quadrant C |
| Plot type | Count rate plots | Images |
|---|---|---|
| Comparison with Poisson distribution Blue bars denote a histogram of data divided into 1 sec bins. Red curve is a Poisson curve with rate = median count rate of data. |
 |
 |
| Quadrant-wise count rates Data is divided into 100 sec bins |
 |
|
| Module-wise count rates for Quadrant A Data is divided into 100 sec bins |
 |
 |
| Module-wise count rates for Quadrant B Data is divided into 100 sec bins |
 |
 |
| Module-wise count rates for Quadrant C Data is divided into 100 sec bins |
 |
 |
| Module-wise count rates for Quadrant D Data is divided into 100 sec bins |
 |
 |
| Parameter | Plot |
|---|---|
| CZT HV Monitor |  |
| D_VDD | 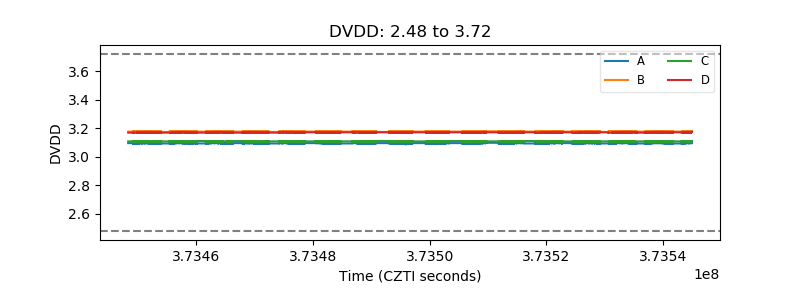 |
| Temperature 1 |  |
| Veto HV Monitor |  |
| Veto LLD | 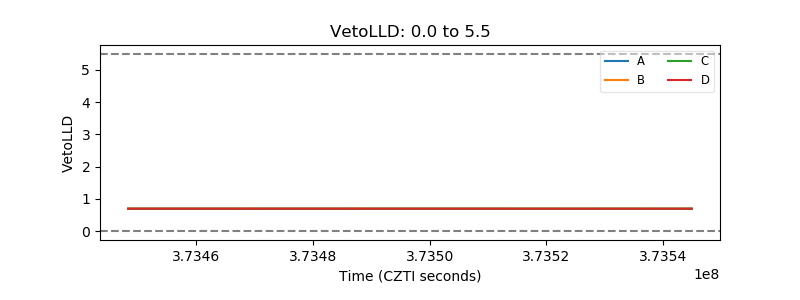 |
| Alpha Counter | 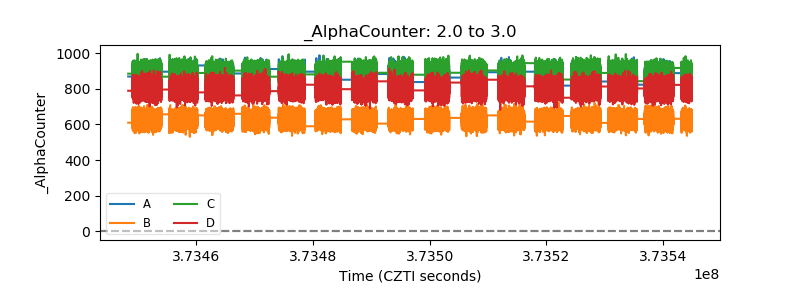 |
| _CPM_Rate |  |
| CZT Counter |  |
| +2.5 Volts monitor |  |
| +5 Volts monitor |  |
| _ROLL_ROT |  |
| _Roll_DEC |  |
| _Roll_RA | 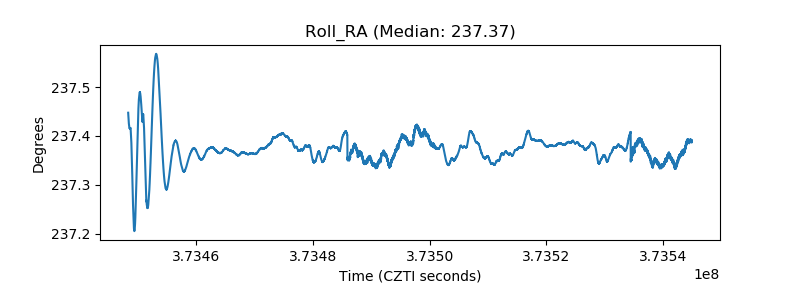 |
| Veto Counter | 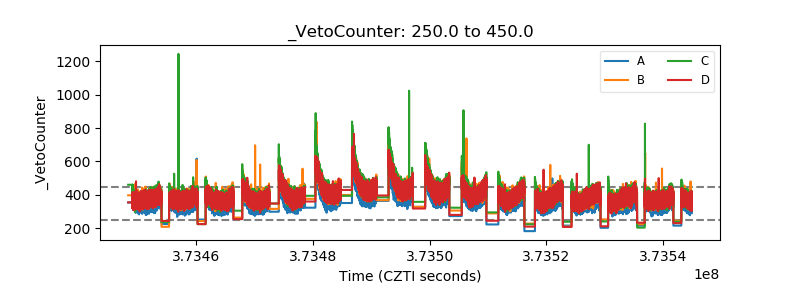 |