| Param | Original file | Final file |
|---|---|---|
| Filename | modeM0/AS1C07_001T01_9000004752_32953cztM0_level2.evt | modeM0/AS1C07_001T01_9000004752_32953cztM0_level2_quad_clean.evt |
| Size (bytes) | 643,849,920 | 103,800,960 |
| Size | 614.0 MB | 99.0 MB |
| Events in quadrant A | 2,641,929 | 734,961 |
| Events in quadrant B | 5,566,943 | 663,975 |
| Events in quadrant C | 2,867,149 | 718,910 |
| Events in quadrant D | 8,024,514 | 613,008 |
| Mode M0 | |||
|---|---|---|---|
| Quadrant | BADHDUFLAG | Total packets | Discarded packets |
| A | 0 | 11846 | 3 |
| B | 0 | 20482 | 2 |
| C | 0 | 12631 | 2 |
| D | 0 | 27995 | 2 |
| Mode SS | |||
|---|---|---|---|
| Quadrant | BADHDUFLAG | Total packets | Discarded packets |
| A | 0 | 118 | 0 |
| B | 0 | 118 | 0 |
| C | 0 | 118 | 0 |
| D | 0 | 118 | 0 |
| Mode M9 | |||
|---|---|---|---|
| Quadrant | BADHDUFLAG | Total packets | Discarded packets |
| A | 0 | 17 | 0 |
| B | 0 | 17 | 0 |
| C | 0 | 17 | 0 |
| D | 0 | 18 | 0 |
| Quadrant | Total seconds | Saturated seconds | Saturation percentage |
|---|---|---|---|
| A | 5900 | 5 | 0.084746% |
| B | 5900 | 1071 | 18.152542% |
| C | 5900 | 74 | 1.254237% |
| D | 5900 | 1205 | 20.423729% |
Noise dominated data is calculated using 1-second bins in cleaned event files. If a bin has >2000 counts, and if more than 50% of those come from <1% of pixels, then it is considered to be noise-dominated and hence unusable.
| Quadrant | # 1 sec bins | Bins with >0 counts | Bins with >2000 counts | High rate bins dominated by noise | Noise dominated (total time) | Noise dominated (detector-on time) | Marked lightcurve |
|---|---|---|---|---|---|---|---|
| A | 7213 | 5901 | 0 | 0 | 0.00% | 0.00% | 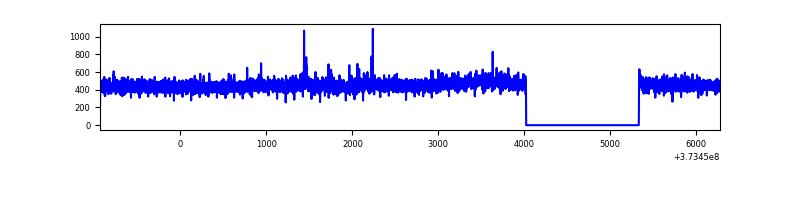 |
| B | 7212 | 5900 | 772 | 772 | 10.70% | 13.08% | 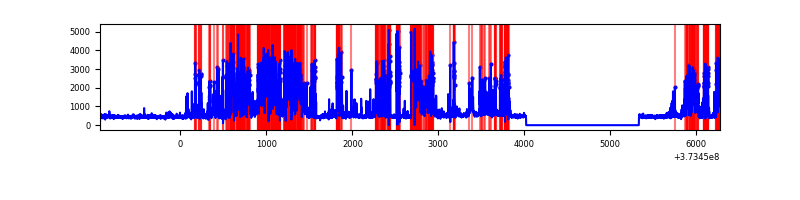 |
| C | 7213 | 5901 | 65 | 65 | 0.90% | 1.10% | 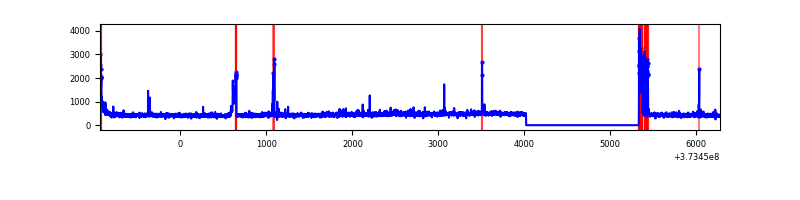 |
| D | 7213 | 5901 | 1172 | 1172 | 16.25% | 19.86% | 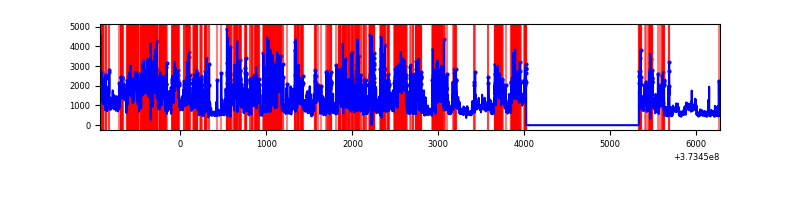 |
Top three noisy pixels from each quadrant. If the there are fewer than three noisy pixels in the level2.evt file, extra rows are filled as -1
| Pixel properties | Quadrant properties | ||||||
|---|---|---|---|---|---|---|---|
| Quadrant | DetID | PixID | Counts | Sigma | Mean | Median | Sigma |
| A | 0 | 191 | 12109 | 83.58 | 677 | 660 | 137.0 |
| A | 13 | 254 | 11599 | 79.86 | 677 | 660 | 137.0 |
| A | 13 | 6 | 9314 | 63.17 | 677 | 660 | 137.0 |
| B | 5 | 172 | 1706164 | 14446.85 | 617 | 602 | 118.1 |
| B | 5 | 200 | 1256869 | 10641.13 | 617 | 602 | 118.1 |
| B | 0 | 199 | 81339 | 683.88 | 617 | 602 | 118.1 |
| C | 0 | 10 | 140123 | 928.32 | 650 | 655 | 150.2 |
| C | 9 | 187 | 112044 | 741.42 | 650 | 655 | 150.2 |
| C | 1 | 241 | 37646 | 246.22 | 650 | 655 | 150.2 |
| D | 12 | 227 | 2366998 | 15051.23 | 604 | 590 | 157.2 |
| D | 8 | 195 | 1202199 | 7642.68 | 604 | 590 | 157.2 |
| D | 7 | 80 | 1045373 | 6645.2 | 604 | 590 | 157.2 |
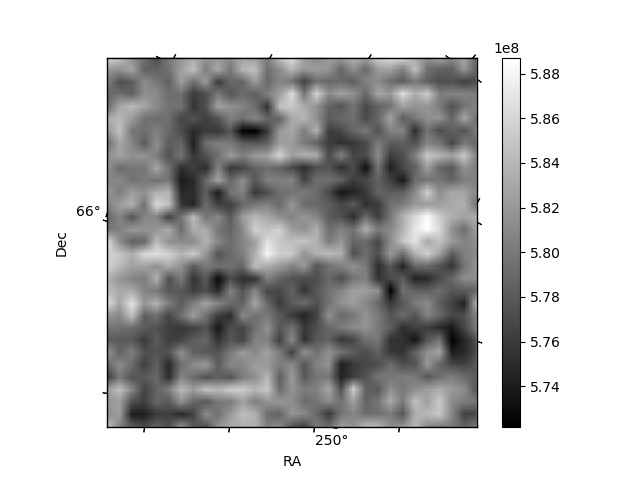
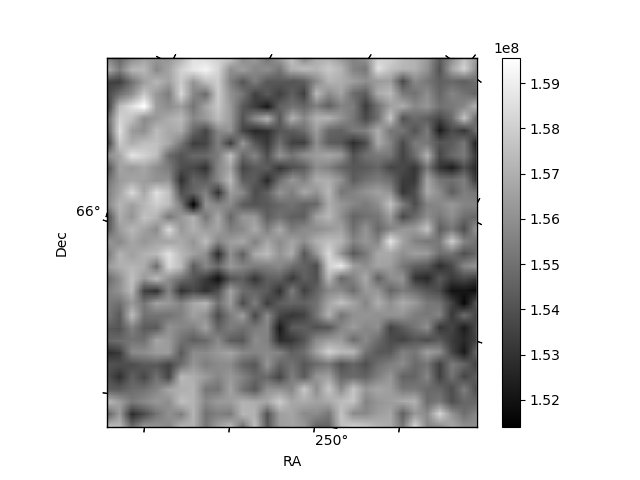
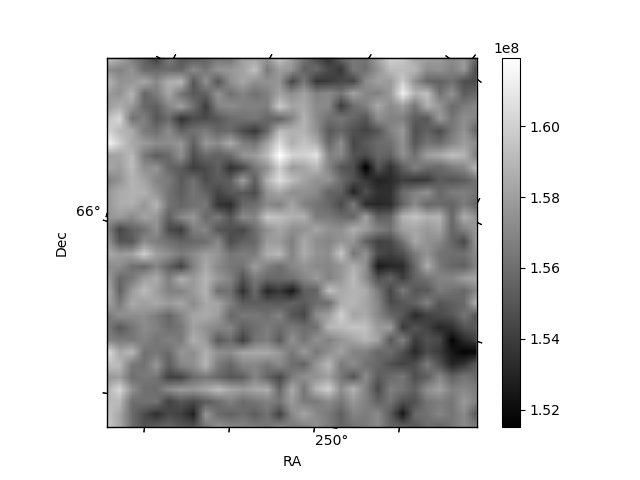
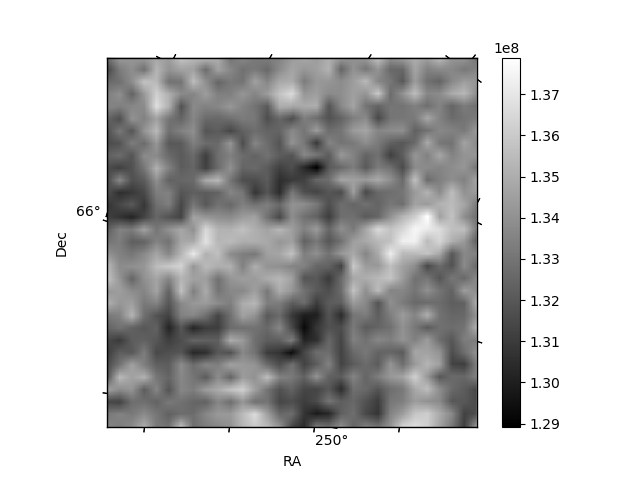
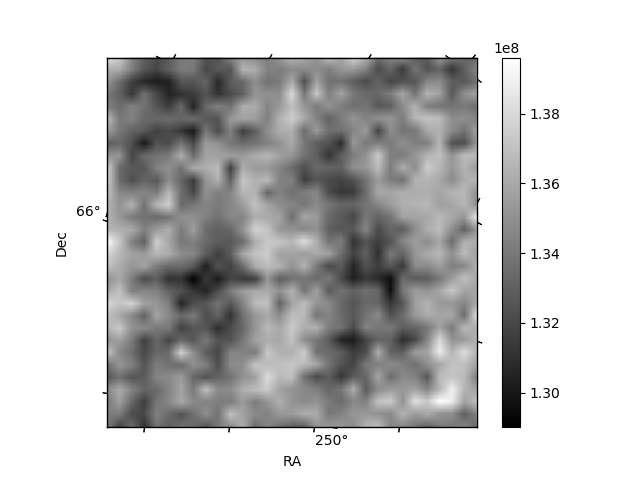
Histogram calculated using DETX and DETY for each event in the final _common_clean file
| Quadrant A | 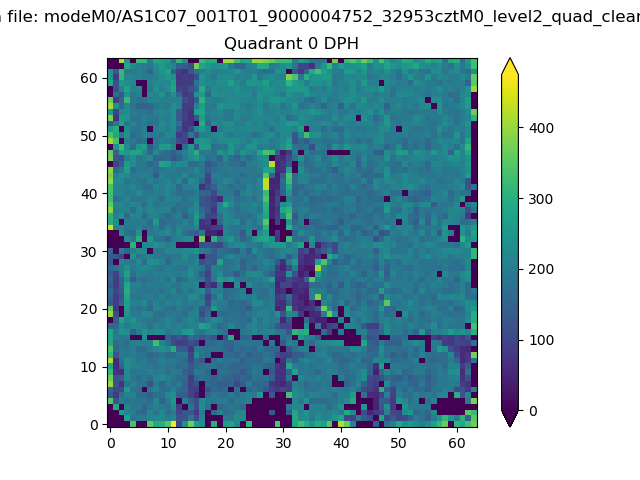 |
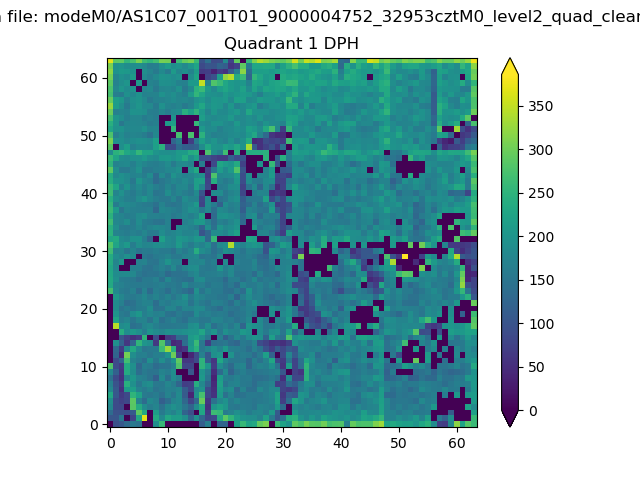 |
Quadrant B |
|---|---|---|---|
| Quadrant D | 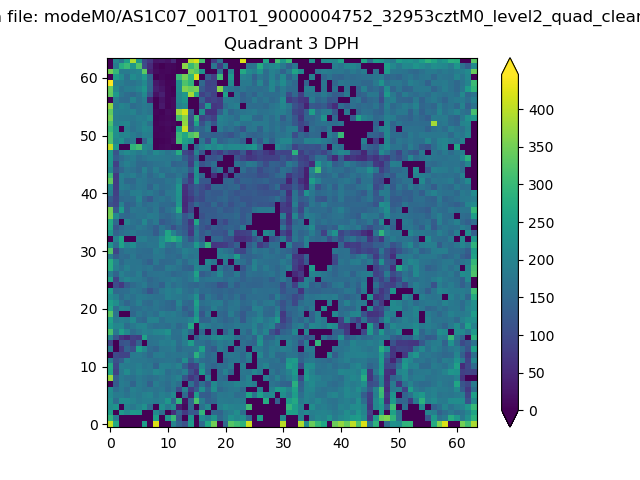 |
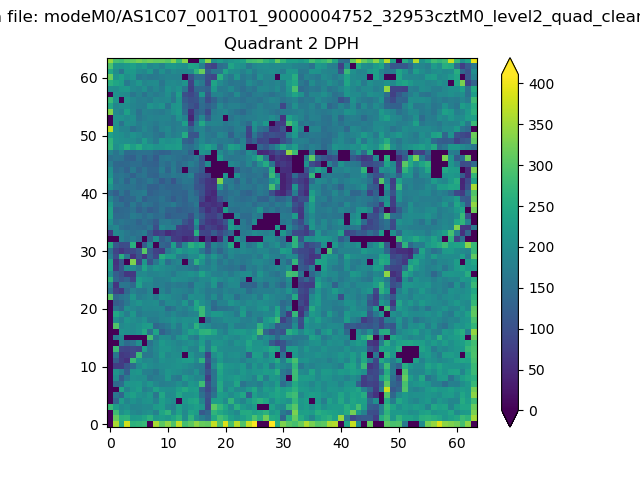 |
Quadrant C |
| Plot type | Count rate plots | Images |
|---|---|---|
| Comparison with Poisson distribution Blue bars denote a histogram of data divided into 1 sec bins. Red curve is a Poisson curve with rate = median count rate of data. |
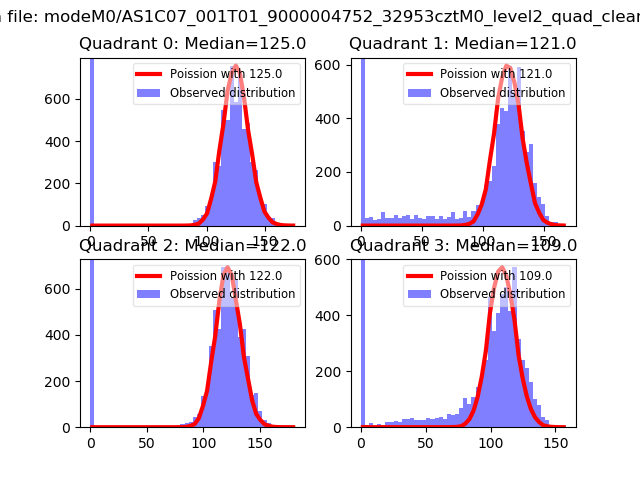 |
 |
| Quadrant-wise count rates Data is divided into 100 sec bins |
 |
|
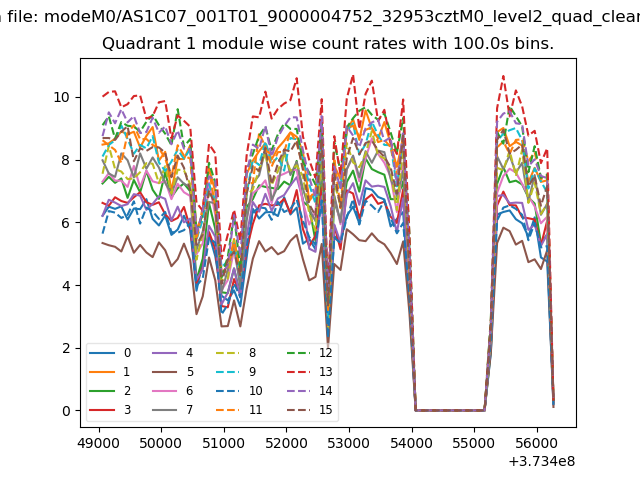
| Module-wise count rates for Quadrant A Data is divided into 100 sec bins |
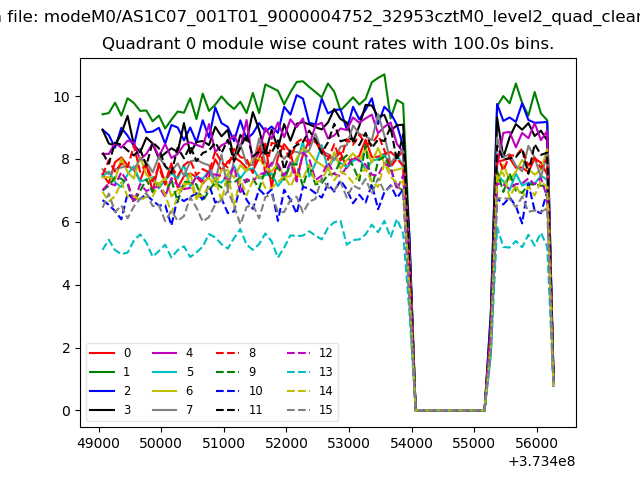 |
 |
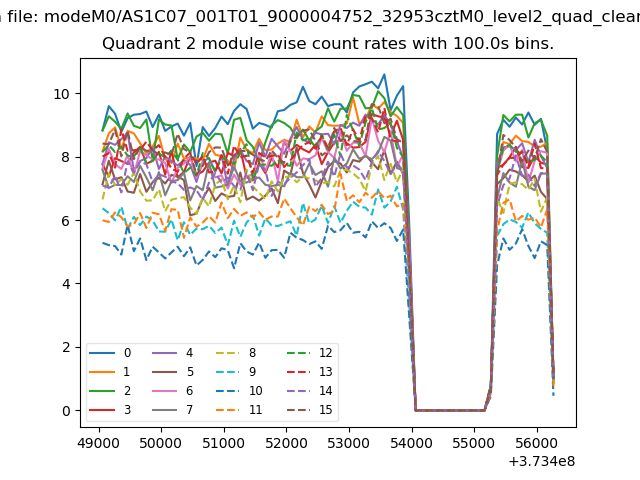
| Module-wise count rates for Quadrant B Data is divided into 100 sec bins |
 |
 |
| Module-wise count rates for Quadrant C Data is divided into 100 sec bins |
 |
 |
| Module-wise count rates for Quadrant D Data is divided into 100 sec bins |
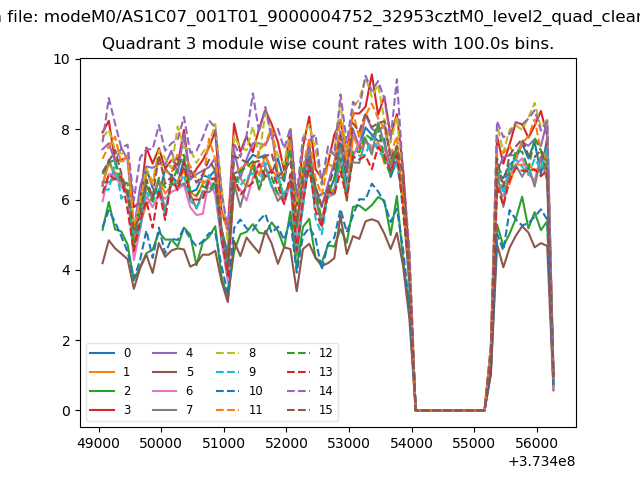 |
 |
| Parameter | Plot |
|---|---|
| CZT HV Monitor | 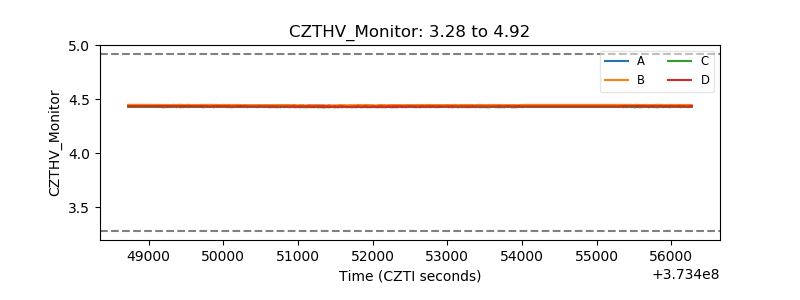 |
| D_VDD | 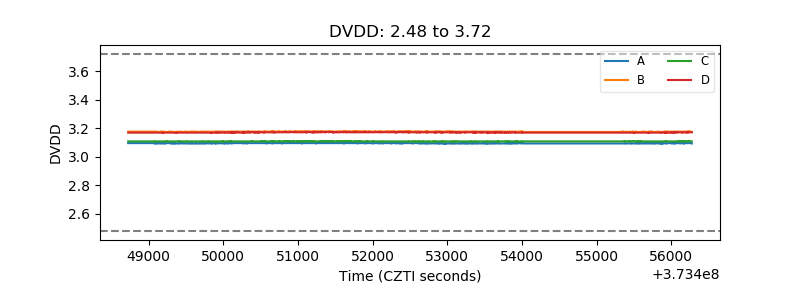 |
| Temperature 1 | 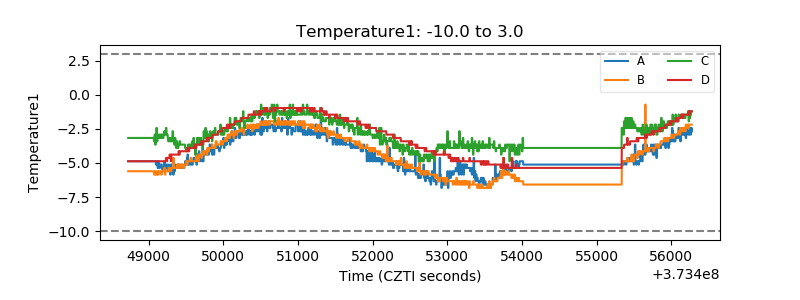 |
| Veto HV Monitor | 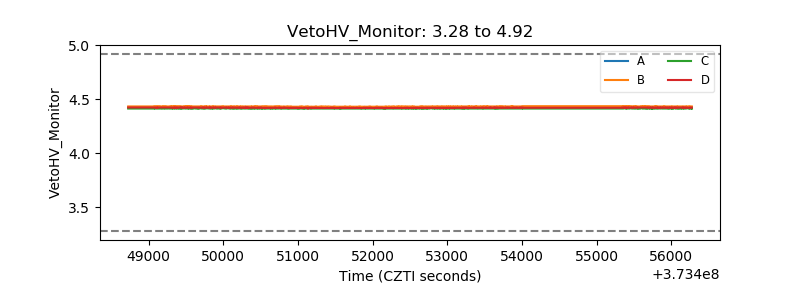 |
| Veto LLD | 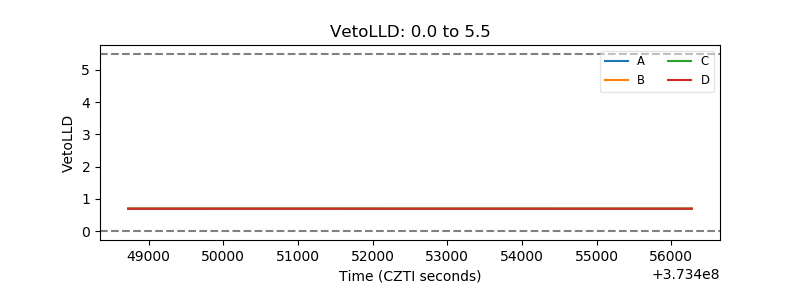 |
| Alpha Counter | 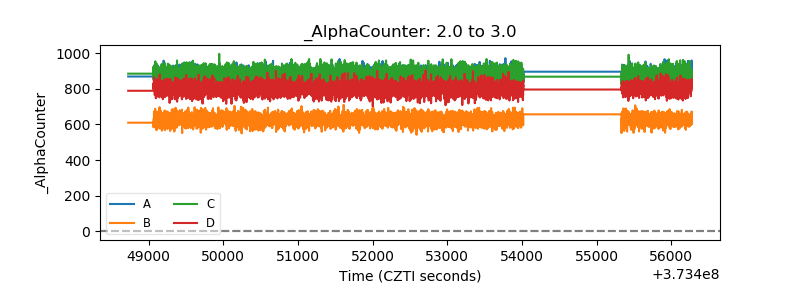 |
| _CPM_Rate | 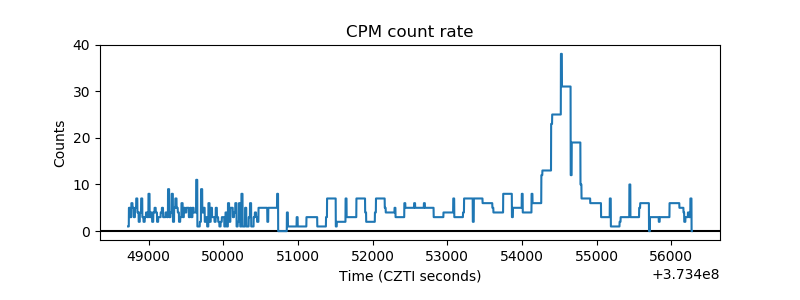 |
| CZT Counter | 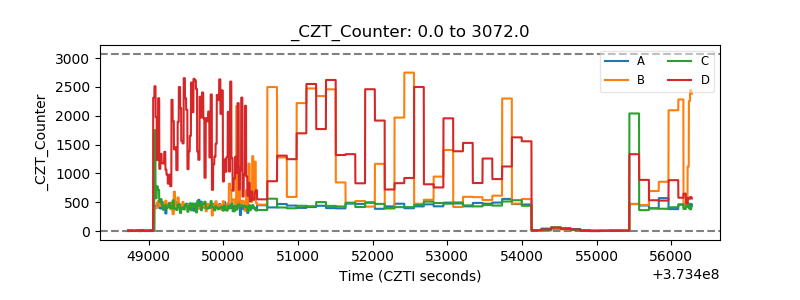 |
| +2.5 Volts monitor |  |
| +5 Volts monitor |  |
| _ROLL_ROT | 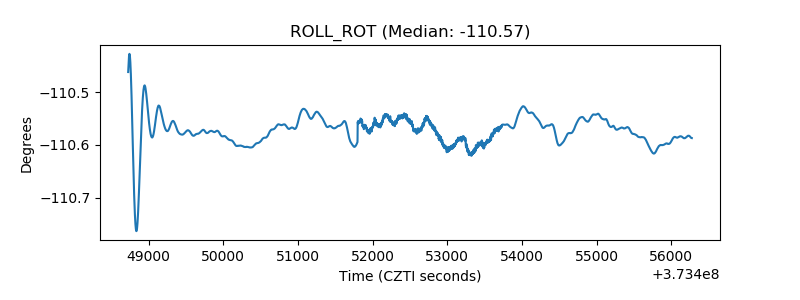 |
| _Roll_DEC | 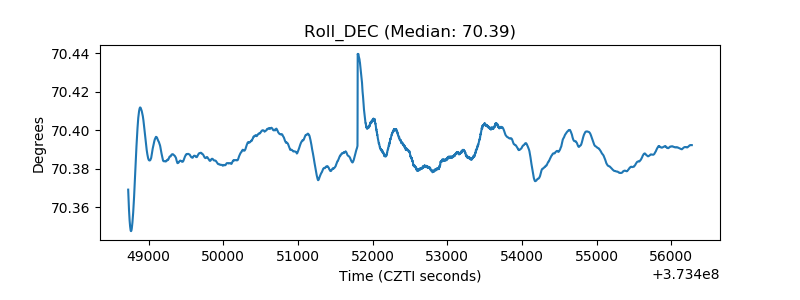 |
| _Roll_RA |  |
| Veto Counter | 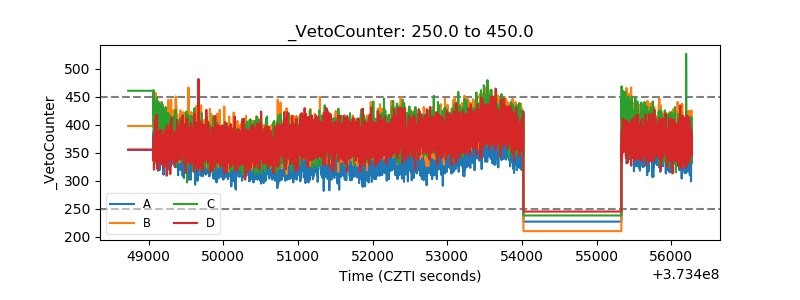 |