| Param | Original file | Final file |
|---|---|---|
| Filename | modeM0/AS1C07_001T01_9000004752_32954cztM0_level2.evt | modeM0/AS1C07_001T01_9000004752_32954cztM0_level2_quad_clean.evt |
| Size (bytes) | 987,543,360 | 178,090,560 |
| Size | 941.8 MB | 169.8 MB |
| Events in quadrant A | 4,576,866 | 1,238,762 |
| Events in quadrant B | 8,853,734 | 1,150,082 |
| Events in quadrant C | 4,656,565 | 1,221,316 |
| Events in quadrant D | 11,147,821 | 1,091,694 |
| Mode M0 | |||
|---|---|---|---|
| Quadrant | BADHDUFLAG | Total packets | Discarded packets |
| A | 0 | 20266 | 3 |
| B | 0 | 32744 | 2 |
| C | 0 | 20639 | 2 |
| D | 0 | 40275 | 2 |
| Mode SS | |||
|---|---|---|---|
| Quadrant | BADHDUFLAG | Total packets | Discarded packets |
| A | 0 | 204 | 0 |
| B | 0 | 204 | 0 |
| C | 0 | 204 | 0 |
| D | 0 | 204 | 0 |
| Mode M9 | |||
|---|---|---|---|
| Quadrant | BADHDUFLAG | Total packets | Discarded packets |
| A | 0 | 29 | 0 |
| B | 0 | 29 | 0 |
| C | 0 | 29 | 0 |
| D | 0 | 29 | 0 |
| Quadrant | Total seconds | Saturated seconds | Saturation percentage |
|---|---|---|---|
| A | 9975 | 13 | 0.130326% |
| B | 9975 | 1471 | 14.746867% |
| C | 9975 | 42 | 0.421053% |
| D | 9975 | 1054 | 10.566416% |
Noise dominated data is calculated using 1-second bins in cleaned event files. If a bin has >2000 counts, and if more than 50% of those come from <1% of pixels, then it is considered to be noise-dominated and hence unusable.
| Quadrant | # 1 sec bins | Bins with >0 counts | Bins with >2000 counts | High rate bins dominated by noise | Noise dominated (total time) | Noise dominated (detector-on time) | Marked lightcurve |
|---|---|---|---|---|---|---|---|
| A | 12900 | 9977 | 4 | 4 | 0.03% | 0.04% | 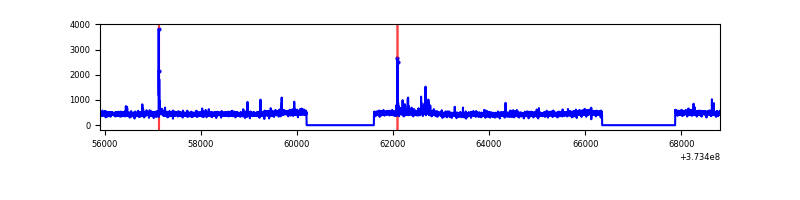 |
| B | 12900 | 9976 | 1036 | 1036 | 8.03% | 10.38% | 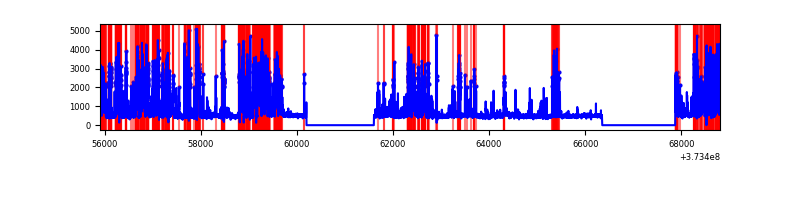 |
| C | 12900 | 9977 | 29 | 29 | 0.22% | 0.29% | 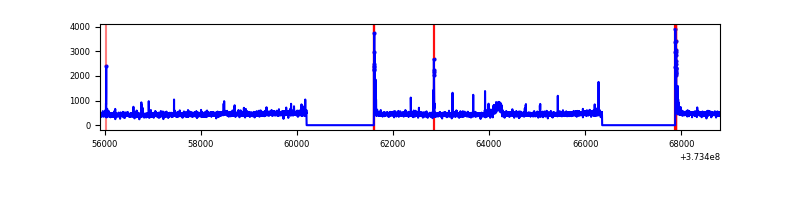 |
| D | 12900 | 9977 | 890 | 890 | 6.90% | 8.92% | 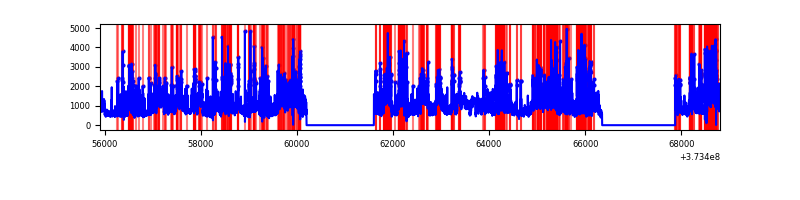 |
Top three noisy pixels from each quadrant. If the there are fewer than three noisy pixels in the level2.evt file, extra rows are filled as -1
| Pixel properties | Quadrant properties | ||||||
|---|---|---|---|---|---|---|---|
| Quadrant | DetID | PixID | Counts | Sigma | Mean | Median | Sigma |
| A | 0 | 191 | 111966 | 486.42 | 1142 | 1117 | 227.9 |
| A | 13 | 254 | 18746 | 77.36 | 1142 | 1117 | 227.9 |
| A | 13 | 6 | 17314 | 71.07 | 1142 | 1117 | 227.9 |
| B | 5 | 172 | 2510797 | 12458.74 | 1071 | 1044 | 201.4 |
| B | 5 | 200 | 1471261 | 7298.35 | 1071 | 1044 | 201.4 |
| B | 0 | 229 | 230680 | 1139.94 | 1071 | 1044 | 201.4 |
| C | 0 | 10 | 145879 | 564.17 | 1114 | 1122 | 256.6 |
| C | 9 | 187 | 42893 | 162.8 | 1114 | 1122 | 256.6 |
| C | 14 | 67 | 30094 | 112.91 | 1114 | 1122 | 256.6 |
| D | 8 | 195 | 2712489 | 9855.26 | 1059 | 1038 | 275.1 |
| D | 7 | 80 | 1570553 | 5704.69 | 1059 | 1038 | 275.1 |
| D | 2 | 250 | 439837 | 1594.89 | 1059 | 1038 | 275.1 |
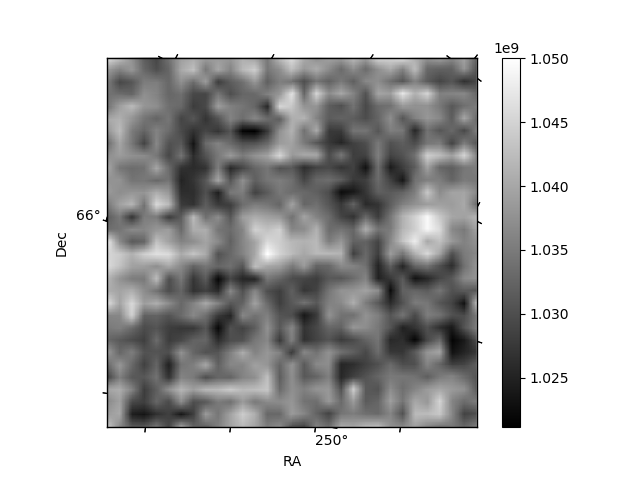
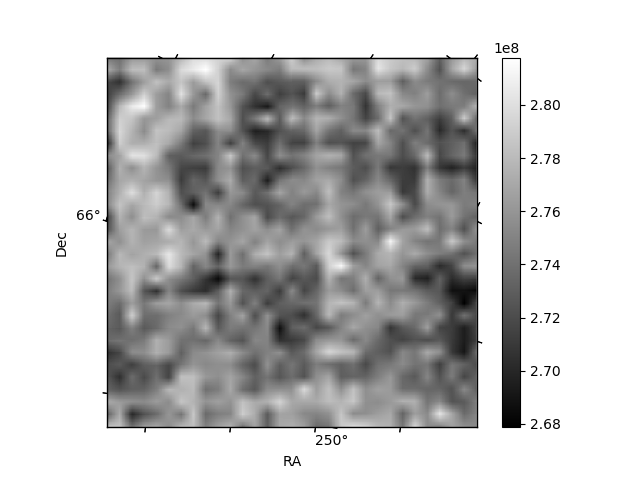
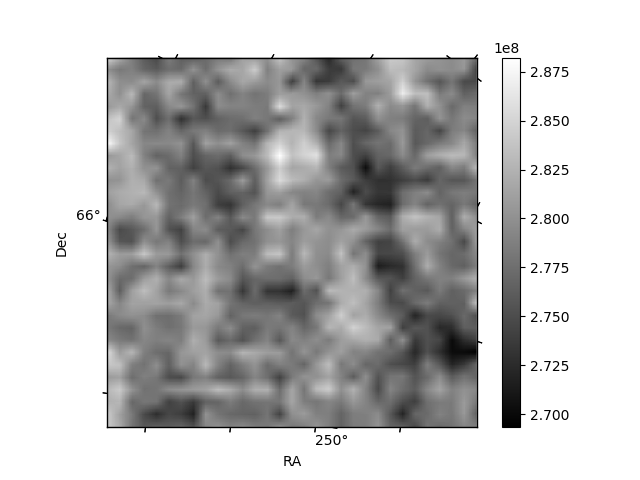
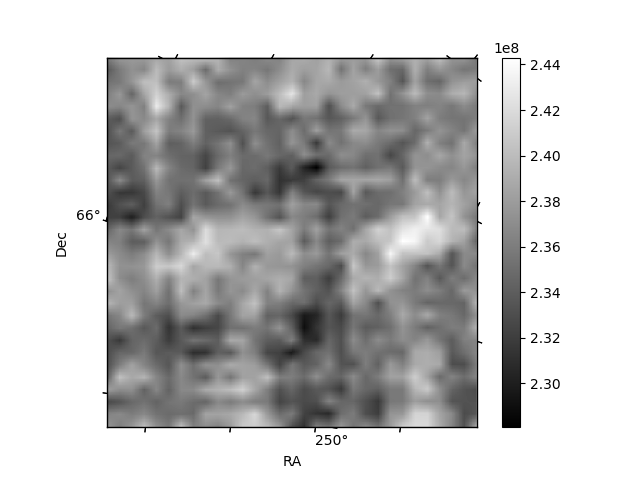
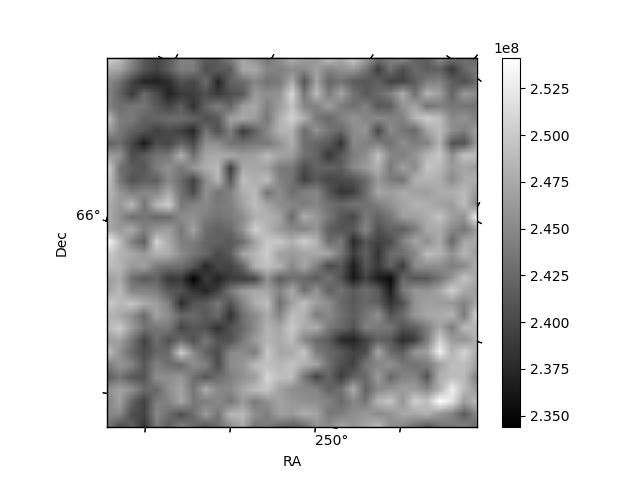
Histogram calculated using DETX and DETY for each event in the final _common_clean file
| Quadrant A | 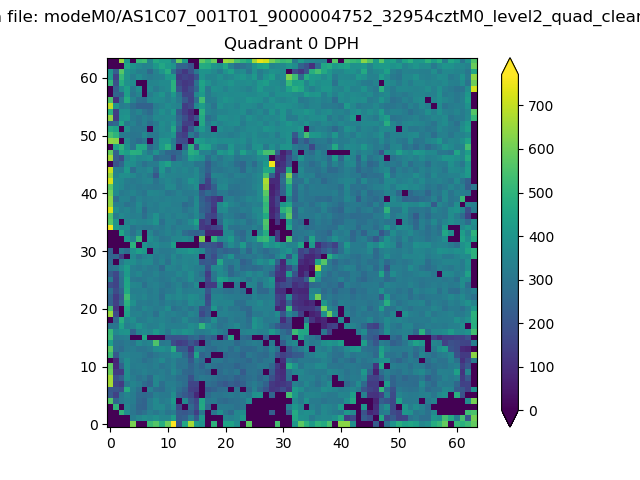 |
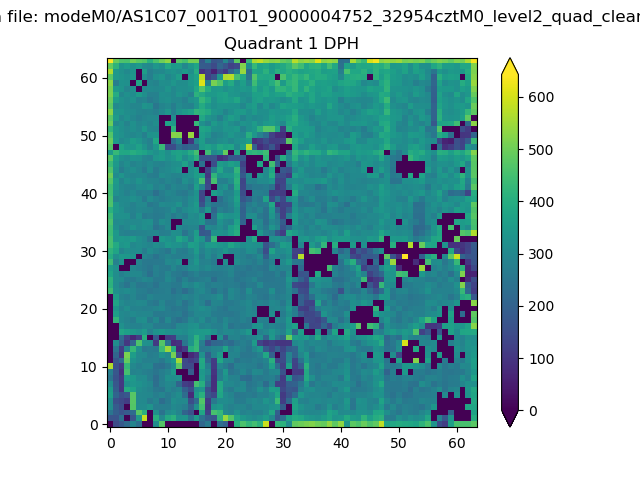 |
Quadrant B |
|---|---|---|---|
| Quadrant D | 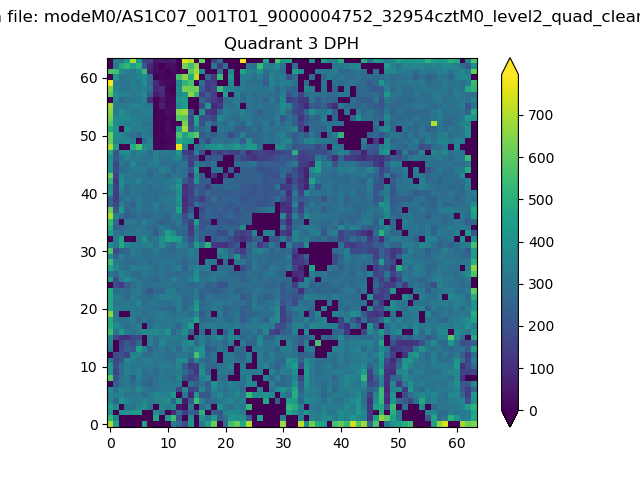 |
 |
Quadrant C |
| Plot type | Count rate plots | Images |
|---|---|---|
| Comparison with Poisson distribution Blue bars denote a histogram of data divided into 1 sec bins. Red curve is a Poisson curve with rate = median count rate of data. |
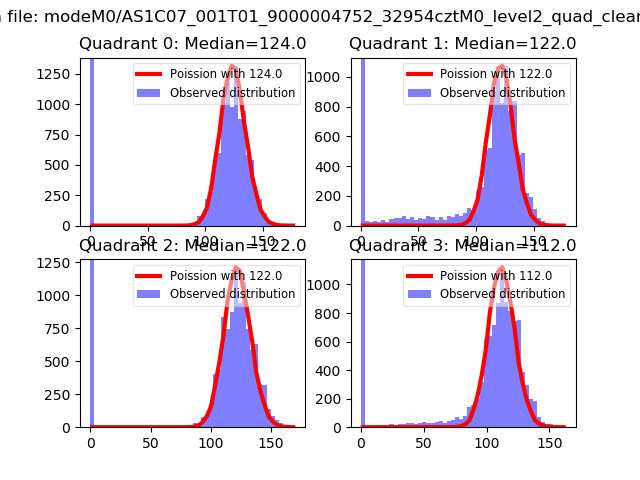 |
 |
| Quadrant-wise count rates Data is divided into 100 sec bins |
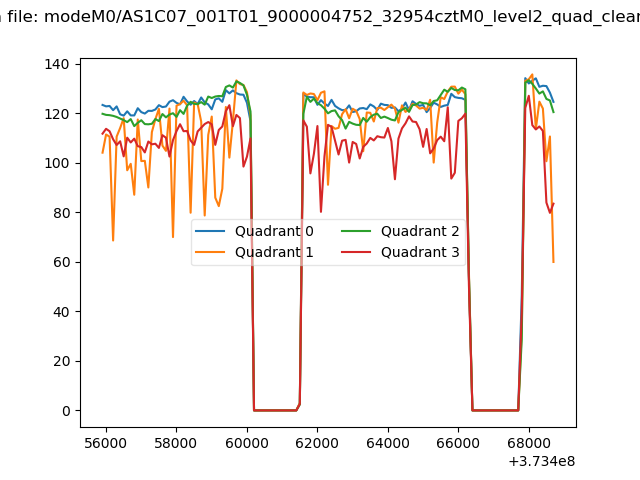 |
|
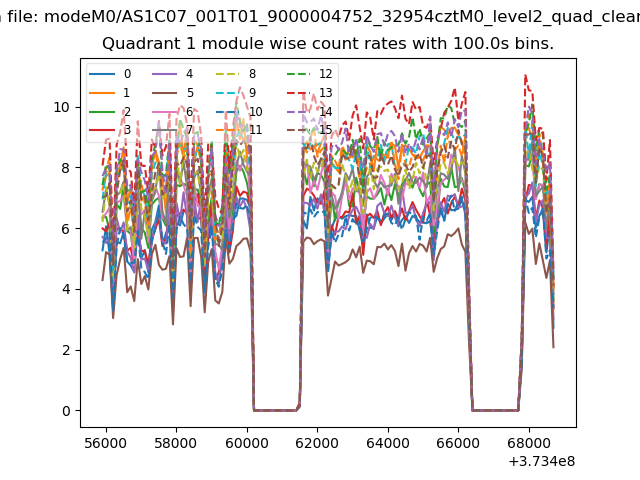
| Module-wise count rates for Quadrant A Data is divided into 100 sec bins |
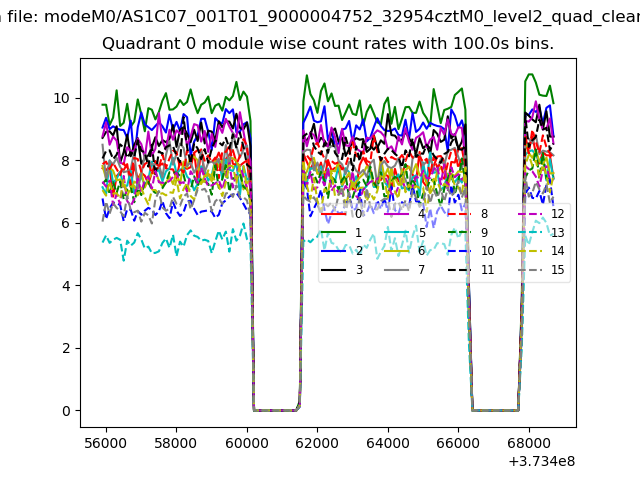 |
 |
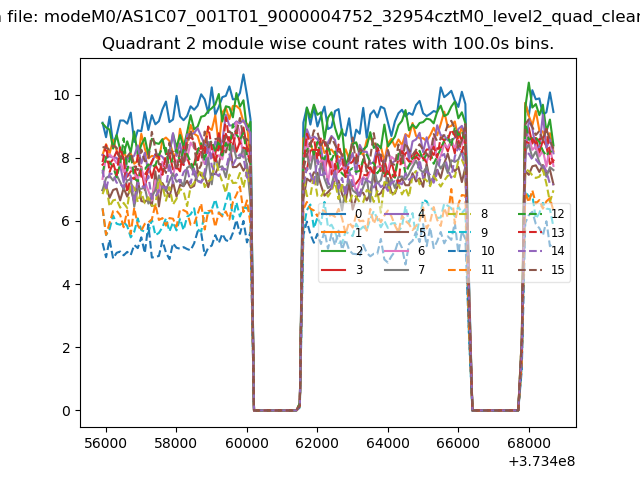
| Module-wise count rates for Quadrant B Data is divided into 100 sec bins |
 |
 |
| Module-wise count rates for Quadrant C Data is divided into 100 sec bins |
 |
 |
| Module-wise count rates for Quadrant D Data is divided into 100 sec bins |
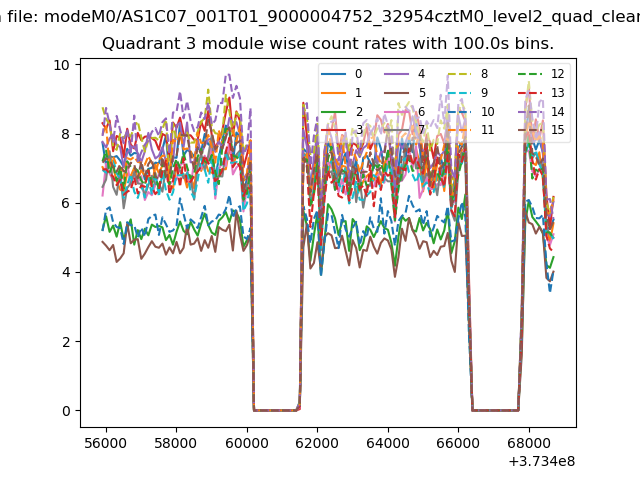 |
 |
| Parameter | Plot |
|---|---|
| CZT HV Monitor | 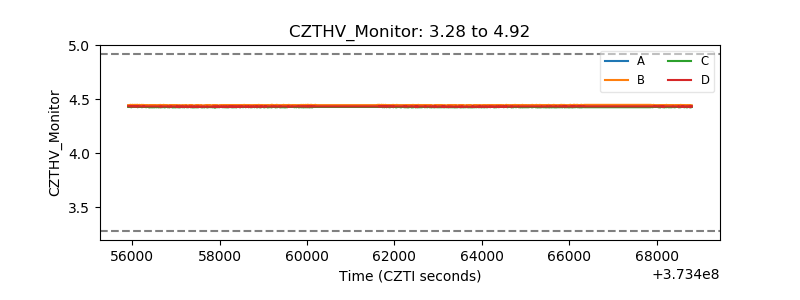 |
| D_VDD | 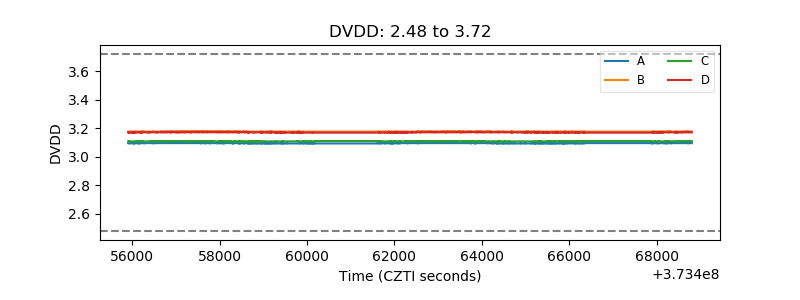 |
| Temperature 1 | 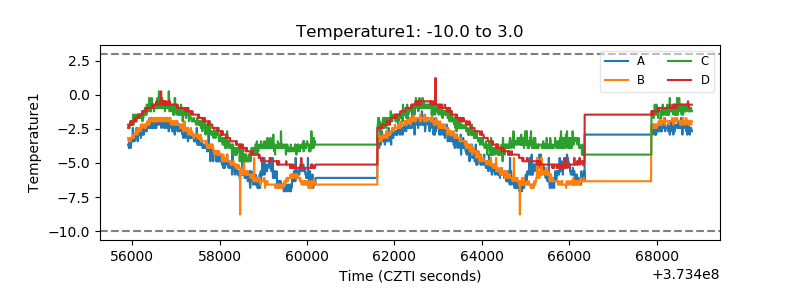 |
| Veto HV Monitor | 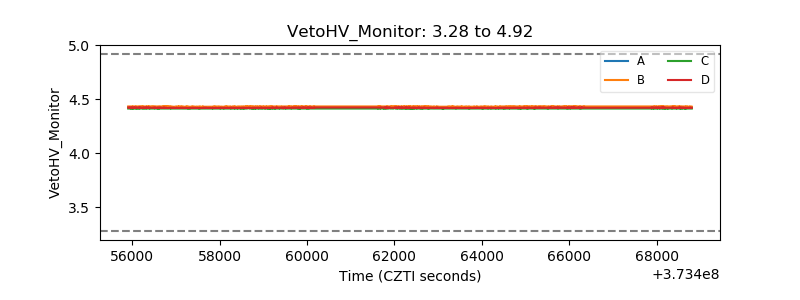 |
| Veto LLD | 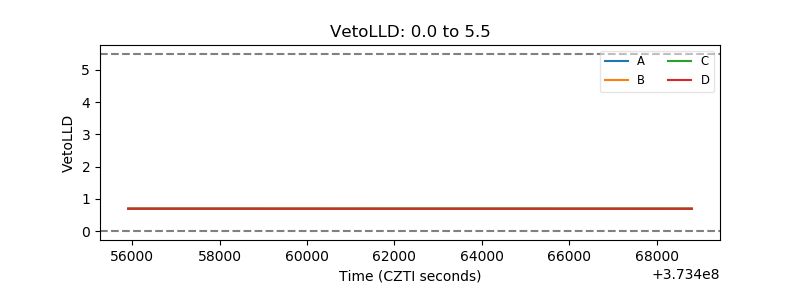 |
| Alpha Counter |  |
| _CPM_Rate | 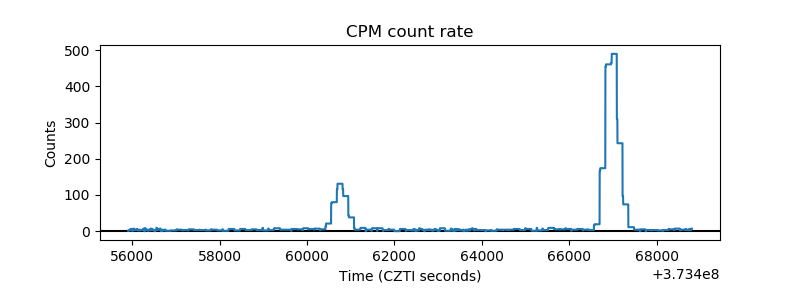 |
| CZT Counter |  |
| +2.5 Volts monitor |  |
| +5 Volts monitor |  |
| _ROLL_ROT | 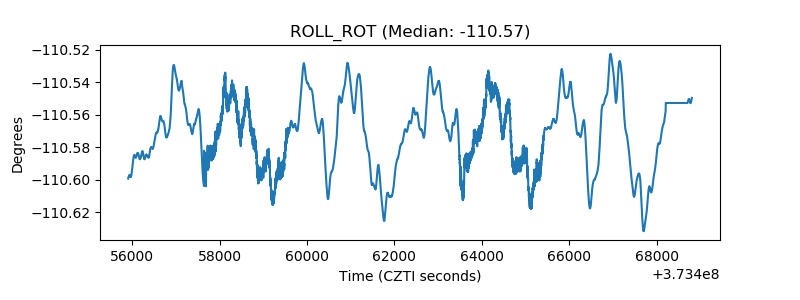 |
| _Roll_DEC | 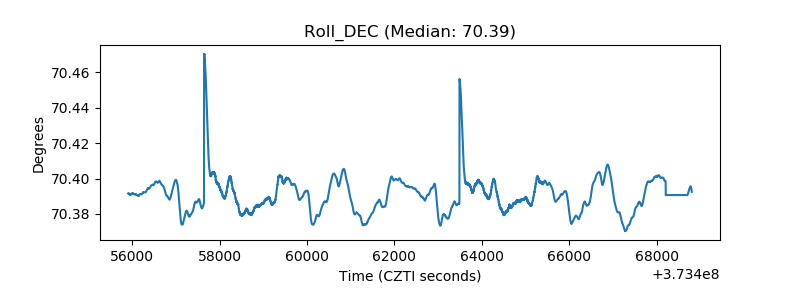 |
| _Roll_RA | 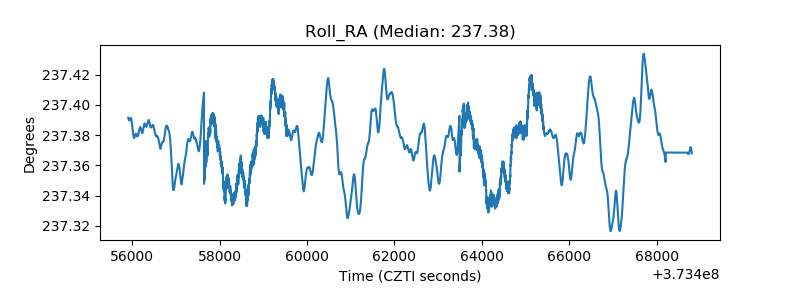 |
| Veto Counter | 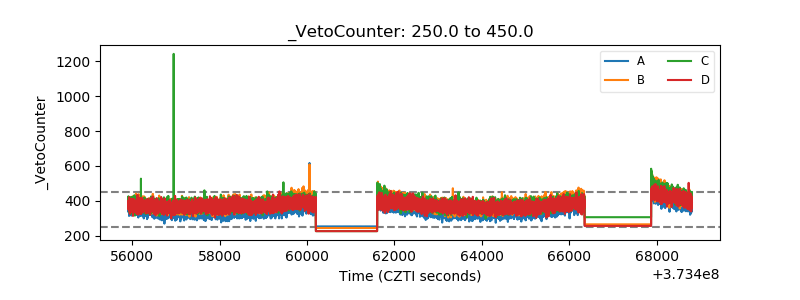 |