| Param | Original file | Final file |
|---|---|---|
| Filename | modeM0/AS1C07_001T01_9000004752_32955cztM0_level2.evt | modeM0/AS1C07_001T01_9000004752_32955cztM0_level2_quad_clean.evt |
| Size (bytes) | 570,156,480 | 104,817,600 |
| Size | 543.7 MB | 100.0 MB |
| Events in quadrant A | 2,599,721 | 730,743 |
| Events in quadrant B | 4,716,457 | 684,593 |
| Events in quadrant C | 2,783,406 | 719,143 |
| Events in quadrant D | 6,780,412 | 639,581 |
| Mode M0 | |||
|---|---|---|---|
| Quadrant | BADHDUFLAG | Total packets | Discarded packets |
| A | 0 | 11521 | 3 |
| B | 0 | 17832 | 2 |
| C | 0 | 12097 | 2 |
| D | 0 | 24267 | 2 |
| Mode SS | |||
|---|---|---|---|
| Quadrant | BADHDUFLAG | Total packets | Discarded packets |
| A | 0 | 116 | 0 |
| B | 0 | 116 | 0 |
| C | 0 | 116 | 0 |
| D | 0 | 116 | 0 |
| Mode M9 | |||
|---|---|---|---|
| Quadrant | BADHDUFLAG | Total packets | Discarded packets |
| A | 0 | 20 | 0 |
| B | 0 | 20 | 0 |
| C | 0 | 20 | 0 |
| D | 0 | 21 | 0 |
| Quadrant | Total seconds | Saturated seconds | Saturation percentage |
|---|---|---|---|
| A | 5718 | 4 | 0.069955% |
| B | 5718 | 771 | 13.483736% |
| C | 5718 | 54 | 0.944386% |
| D | 5718 | 783 | 13.693599% |
Noise dominated data is calculated using 1-second bins in cleaned event files. If a bin has >2000 counts, and if more than 50% of those come from <1% of pixels, then it is considered to be noise-dominated and hence unusable.
| Quadrant | # 1 sec bins | Bins with >0 counts | Bins with >2000 counts | High rate bins dominated by noise | Noise dominated (total time) | Noise dominated (detector-on time) | Marked lightcurve |
|---|---|---|---|---|---|---|---|
| A | 7361 | 5719 | 0 | 0 | 0.00% | 0.00% | 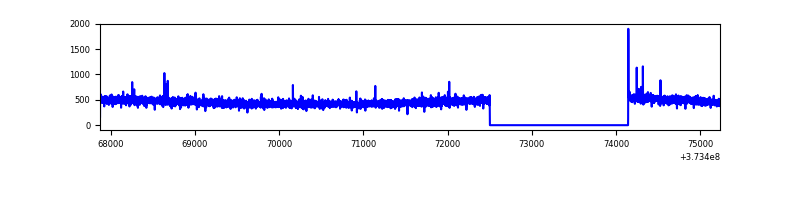 |
| B | 7361 | 5718 | 509 | 509 | 6.91% | 8.90% | 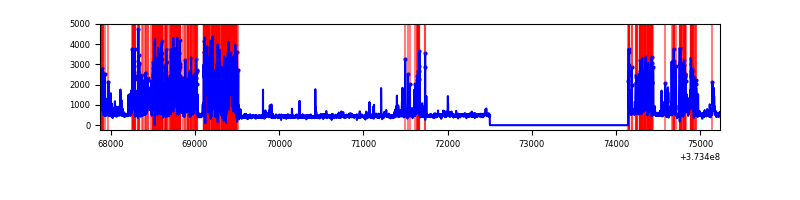 |
| C | 7361 | 5719 | 39 | 39 | 0.53% | 0.68% | 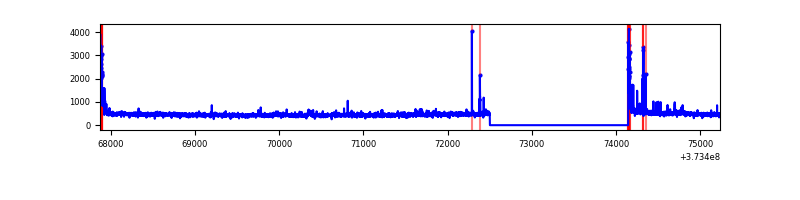 |
| D | 7361 | 5719 | 661 | 661 | 8.98% | 11.56% | 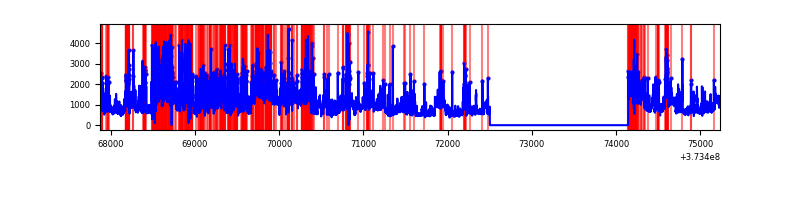 |
Top three noisy pixels from each quadrant. If the there are fewer than three noisy pixels in the level2.evt file, extra rows are filled as -1
| Pixel properties | Quadrant properties | ||||||
|---|---|---|---|---|---|---|---|
| Quadrant | DetID | PixID | Counts | Sigma | Mean | Median | Sigma |
| A | 13 | 6 | 14691 | 104.44 | 664 | 651 | 134.4 |
| A | 13 | 254 | 10832 | 75.74 | 664 | 651 | 134.4 |
| A | 9 | 143 | 8268 | 56.66 | 664 | 651 | 134.4 |
| B | 5 | 172 | 1916995 | 16298.97 | 624 | 608 | 117.6 |
| B | 0 | 229 | 166471 | 1410.67 | 624 | 608 | 117.6 |
| B | 5 | 200 | 59824 | 503.64 | 624 | 608 | 117.6 |
| C | 0 | 10 | 145027 | 973.6 | 646 | 651 | 148.3 |
| C | 1 | 241 | 45591 | 303.05 | 646 | 651 | 148.3 |
| C | 3 | 233 | 16284 | 105.42 | 646 | 651 | 148.3 |
| D | 8 | 195 | 1662948 | 10460.02 | 610 | 598 | 158.9 |
| D | 7 | 80 | 1378367 | 8669.35 | 610 | 598 | 158.9 |
| D | 12 | 233 | 466088 | 2929.01 | 610 | 598 | 158.9 |
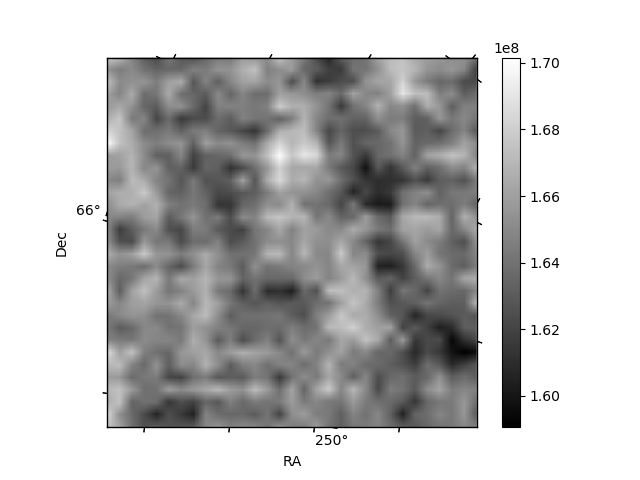
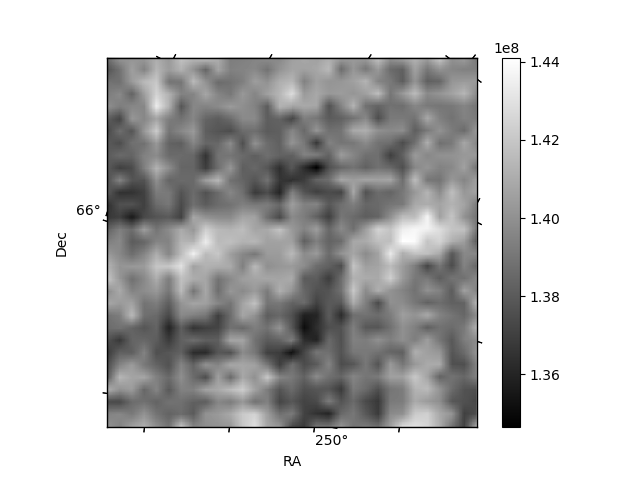
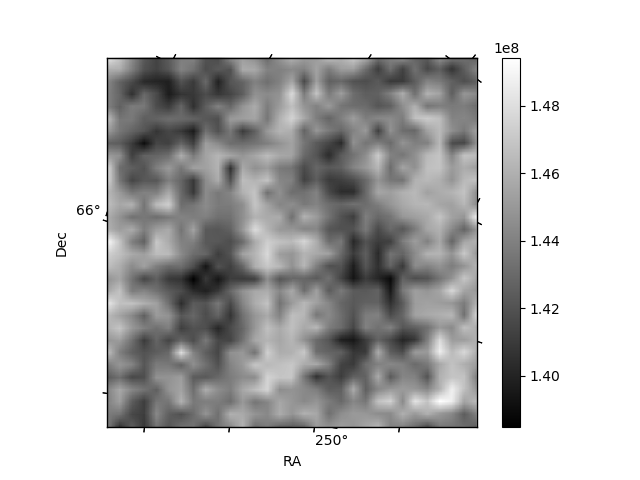
Histogram calculated using DETX and DETY for each event in the final _common_clean file
| Quadrant A | 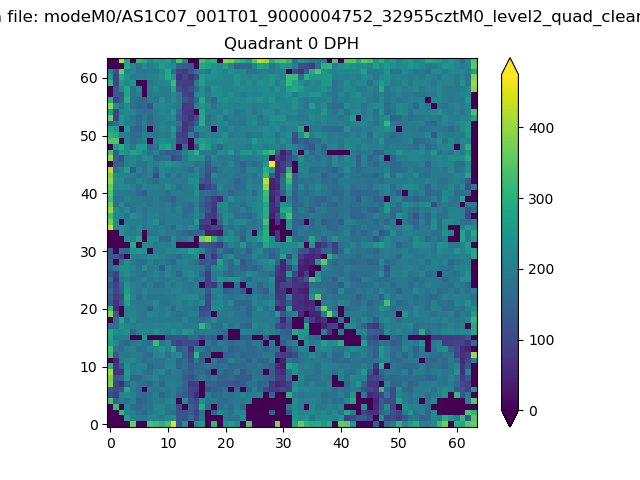 |
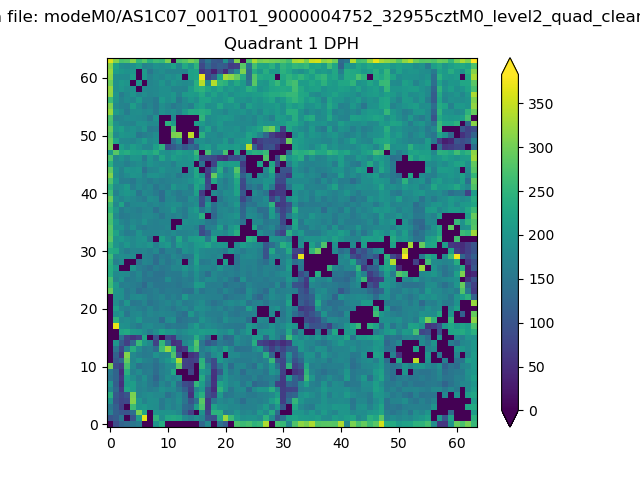 |
Quadrant B |
|---|---|---|---|
| Quadrant D | 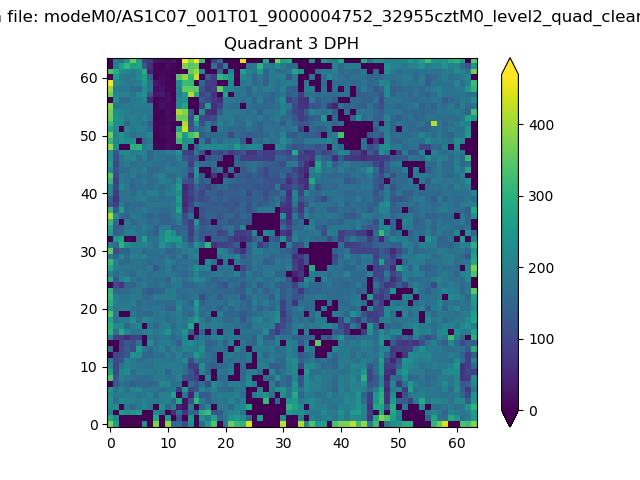 |
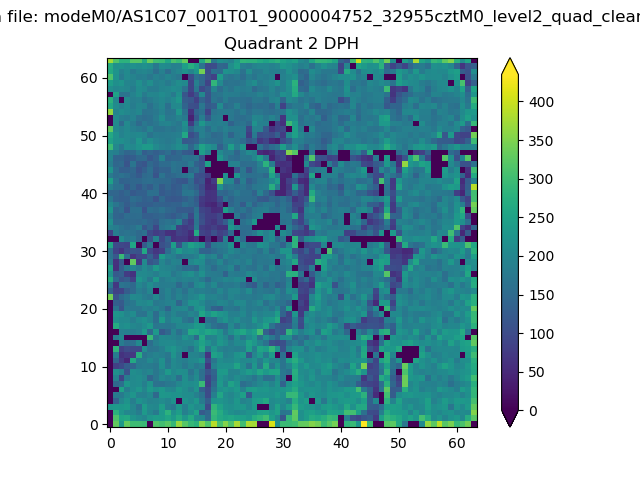 |
Quadrant C |
| Plot type | Count rate plots | Images |
|---|---|---|
| Comparison with Poisson distribution Blue bars denote a histogram of data divided into 1 sec bins. Red curve is a Poisson curve with rate = median count rate of data. |
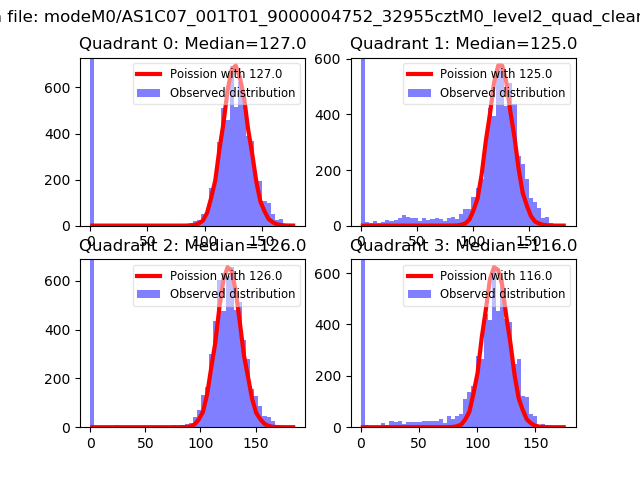 |
 |
| Quadrant-wise count rates Data is divided into 100 sec bins |
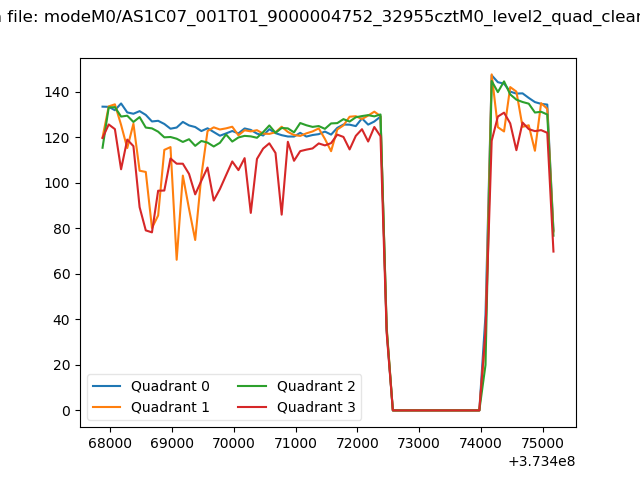 |
|
| Module-wise count rates for Quadrant A Data is divided into 100 sec bins |
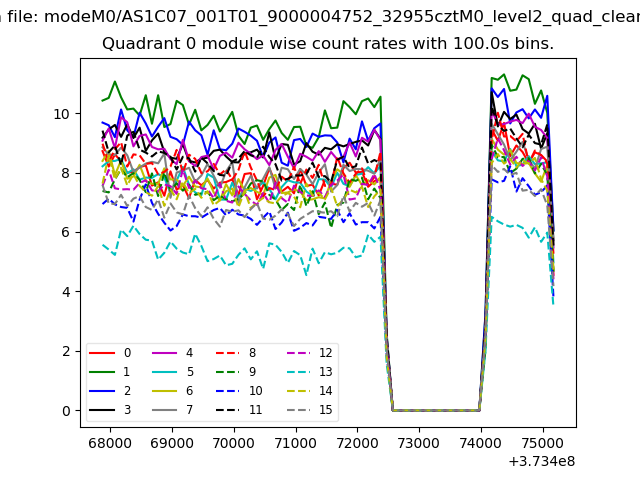 |
 |
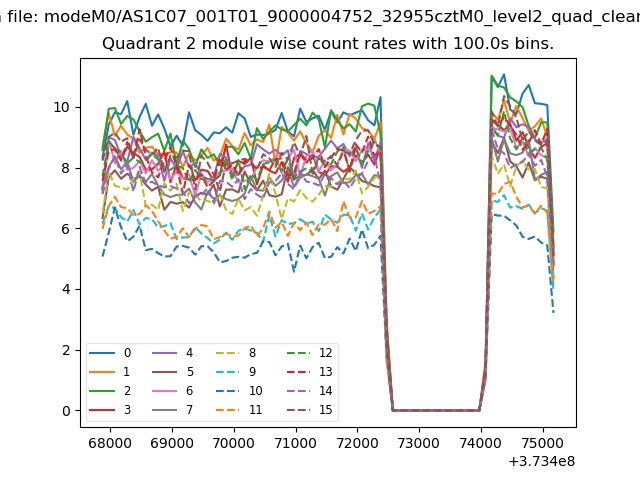
| Module-wise count rates for Quadrant B Data is divided into 100 sec bins |
 |
 |
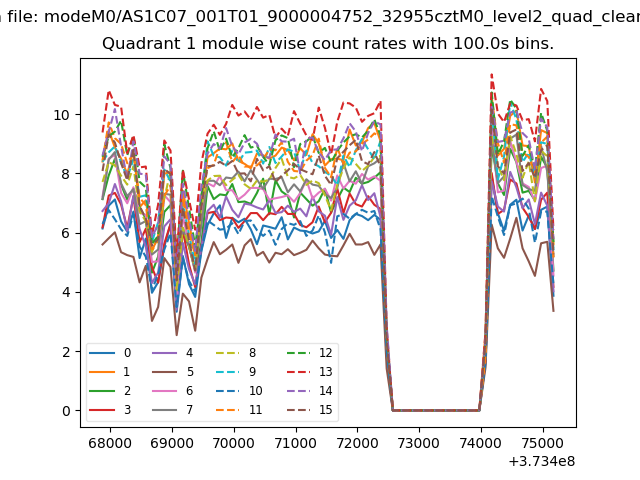
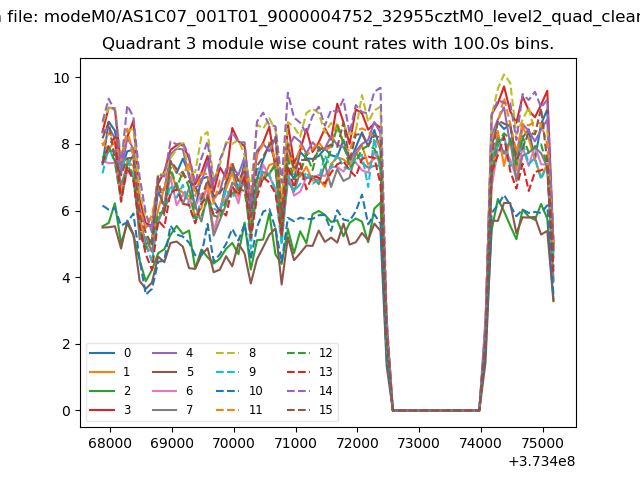
| Module-wise count rates for Quadrant C Data is divided into 100 sec bins |
 |
 |
| Module-wise count rates for Quadrant D Data is divided into 100 sec bins |
 |
 |
| Parameter | Plot |
|---|---|
| CZT HV Monitor | 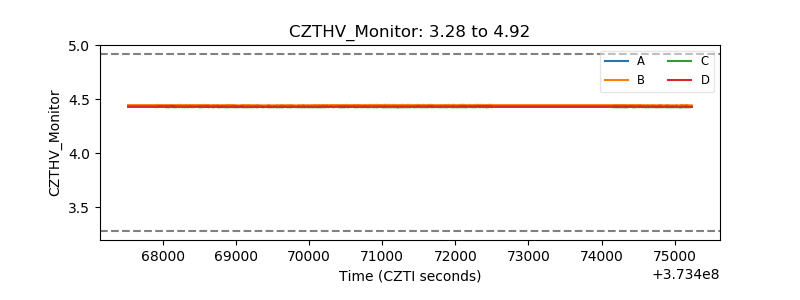 |
| D_VDD | 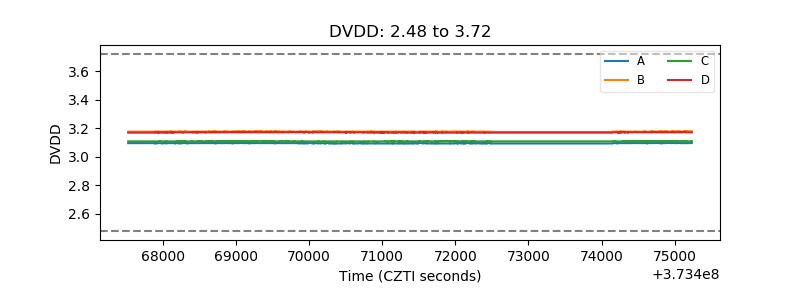 |
| Temperature 1 | 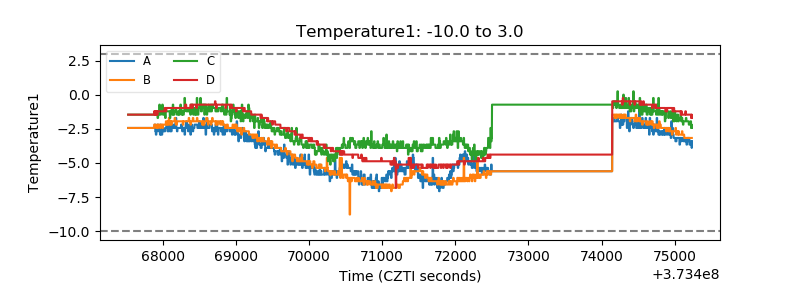 |
| Veto HV Monitor | 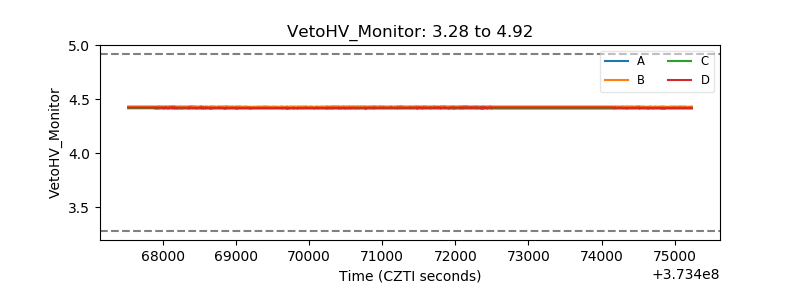 |
| Veto LLD | 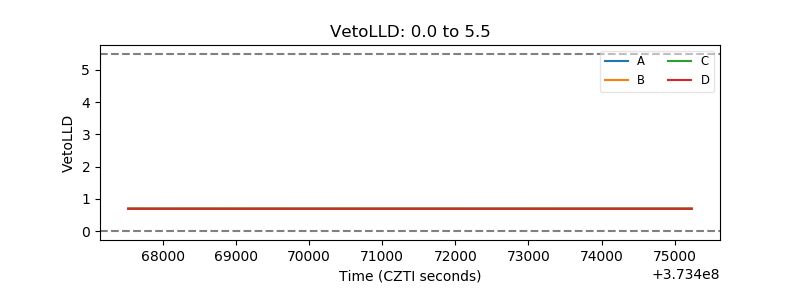 |
| Alpha Counter | 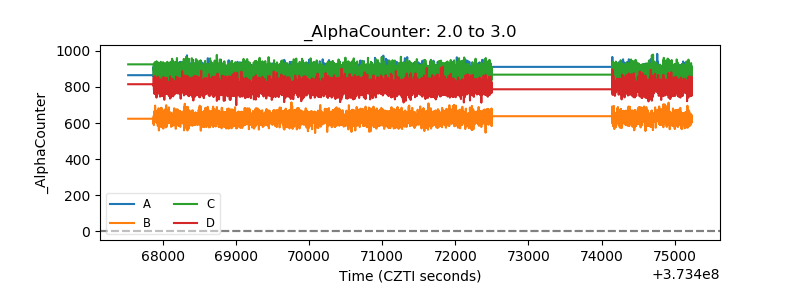 |
| _CPM_Rate |  |
| CZT Counter | 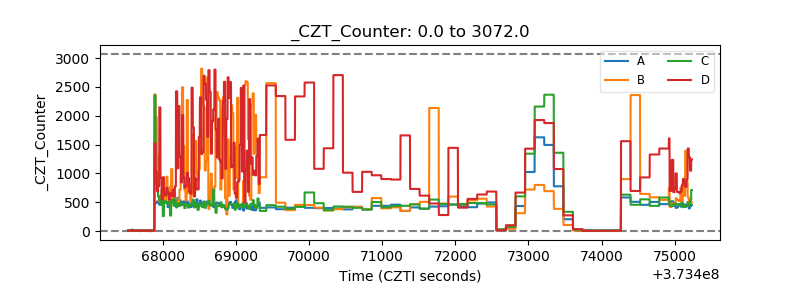 |
| +2.5 Volts monitor |  |
| +5 Volts monitor |  |
| _ROLL_ROT | 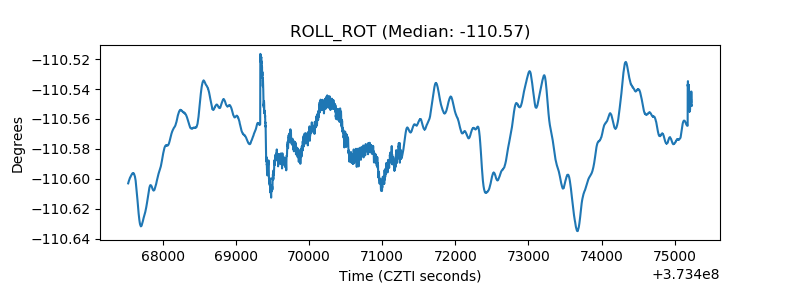 |
| _Roll_DEC | 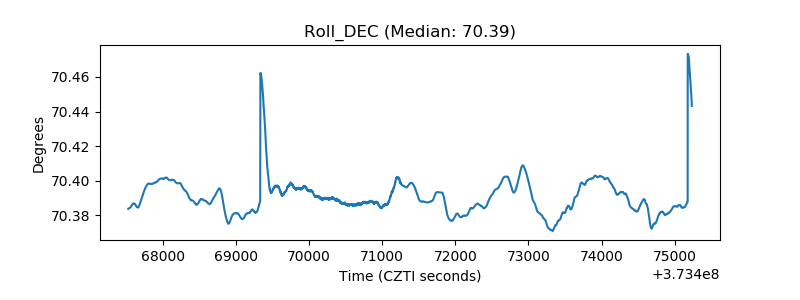 |
| _Roll_RA | 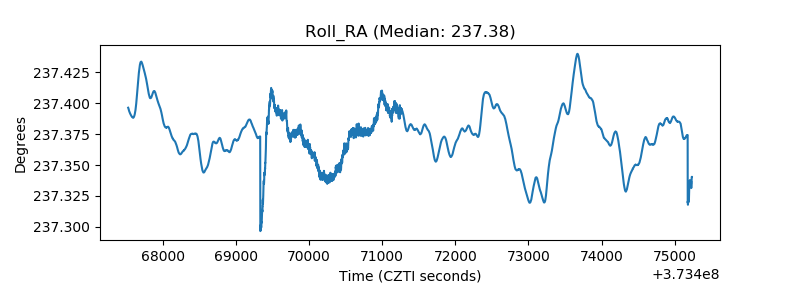 |
| Veto Counter | 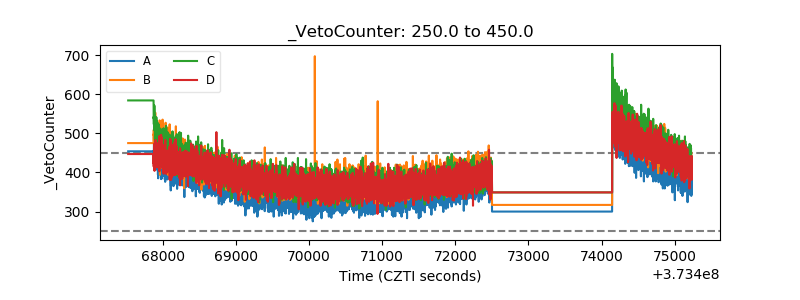 |