| Param | Original file | Final file |
|---|---|---|
| Filename | modeM0/AS1C07_001T01_9000004752_32958cztM0_level2.evt | modeM0/AS1C07_001T01_9000004752_32958cztM0_level2_quad_clean.evt |
| Size (bytes) | 511,554,240 | 103,587,840 |
| Size | 487.9 MB | 98.8 MB |
| Events in quadrant A | 2,428,339 | 717,902 |
| Events in quadrant B | 3,374,755 | 694,552 |
| Events in quadrant C | 2,695,730 | 726,801 |
| Events in quadrant D | 6,644,641 | 636,756 |
| Mode M0 | |||
|---|---|---|---|
| Quadrant | BADHDUFLAG | Total packets | Discarded packets |
| A | 0 | 10506 | 3 |
| B | 0 | 13298 | 2 |
| C | 0 | 11295 | 2 |
| D | 0 | 23276 | 2 |
| Mode SS | |||
|---|---|---|---|
| Quadrant | BADHDUFLAG | Total packets | Discarded packets |
| A | 0 | 106 | 0 |
| B | 0 | 106 | 0 |
| C | 0 | 106 | 0 |
| D | 0 | 106 | 0 |
| Mode M9 | |||
|---|---|---|---|
| Quadrant | BADHDUFLAG | Total packets | Discarded packets |
| A | 0 | 22 | 0 |
| B | 0 | 22 | 0 |
| C | 0 | 22 | 0 |
| D | 0 | 23 | 0 |
| Quadrant | Total seconds | Saturated seconds | Saturation percentage |
|---|---|---|---|
| A | 5147 | 2 | 0.038858% |
| B | 5147 | 377 | 7.324655% |
| C | 5147 | 79 | 1.534875% |
| D | 5147 | 805 | 15.640179% |
Noise dominated data is calculated using 1-second bins in cleaned event files. If a bin has >2000 counts, and if more than 50% of those come from <1% of pixels, then it is considered to be noise-dominated and hence unusable.
| Quadrant | # 1 sec bins | Bins with >0 counts | Bins with >2000 counts | High rate bins dominated by noise | Noise dominated (total time) | Noise dominated (detector-on time) | Marked lightcurve |
|---|---|---|---|---|---|---|---|
| A | 7059 | 5148 | 0 | 0 | 0.00% | 0.00% | 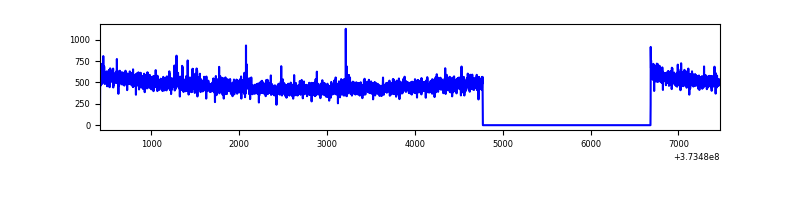 |
| B | 7059 | 5148 | 288 | 288 | 4.08% | 5.59% | 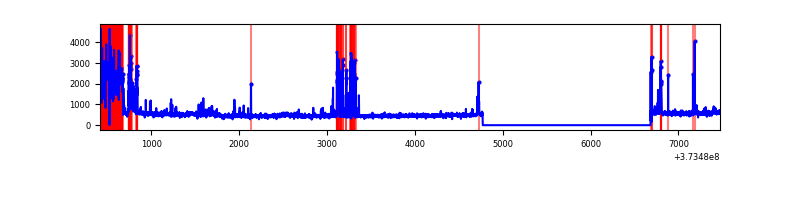 |
| C | 7059 | 5147 | 47 | 47 | 0.67% | 0.91% | 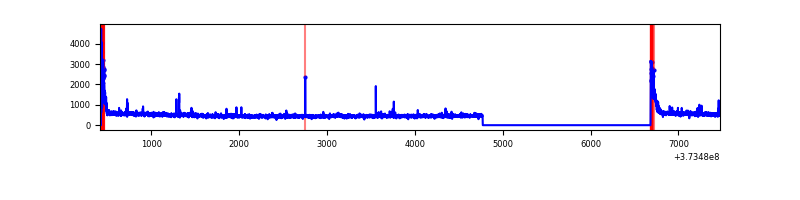 |
| D | 7059 | 5148 | 693 | 693 | 9.82% | 13.46% | 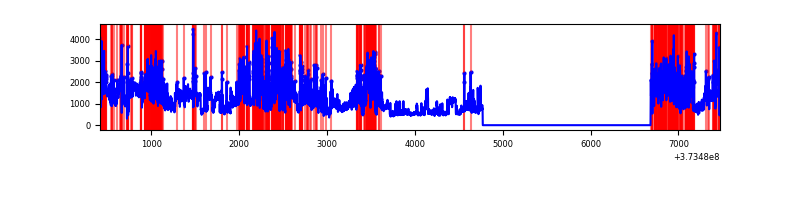 |
Top three noisy pixels from each quadrant. If the there are fewer than three noisy pixels in the level2.evt file, extra rows are filled as -1
| Pixel properties | Quadrant properties | ||||||
|---|---|---|---|---|---|---|---|
| Quadrant | DetID | PixID | Counts | Sigma | Mean | Median | Sigma |
| A | 13 | 6 | 13160 | 101.73 | 618 | 606 | 123.4 |
| A | 0 | 159 | 10788 | 82.51 | 618 | 606 | 123.4 |
| A | 13 | 254 | 8658 | 65.25 | 618 | 606 | 123.4 |
| B | 5 | 172 | 903840 | 8206.17 | 595 | 580 | 110.1 |
| B | 0 | 219 | 64090 | 576.99 | 595 | 580 | 110.1 |
| B | 0 | 229 | 18712 | 164.73 | 595 | 580 | 110.1 |
| C | 0 | 10 | 218996 | 1545.72 | 615 | 622 | 141.3 |
| C | 1 | 241 | 29662 | 205.55 | 615 | 622 | 141.3 |
| C | 3 | 233 | 18141 | 124.0 | 615 | 622 | 141.3 |
| D | 8 | 195 | 1954822 | 13257.55 | 579 | 568 | 147.4 |
| D | 2 | 250 | 1194062 | 8096.59 | 579 | 568 | 147.4 |
| D | 12 | 218 | 416728 | 2823.21 | 579 | 568 | 147.4 |
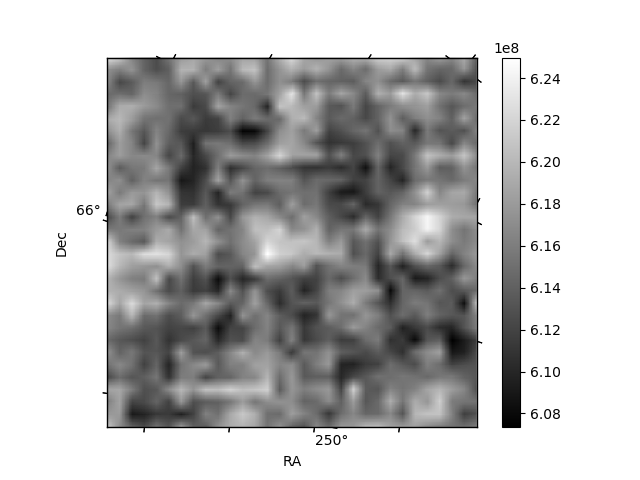
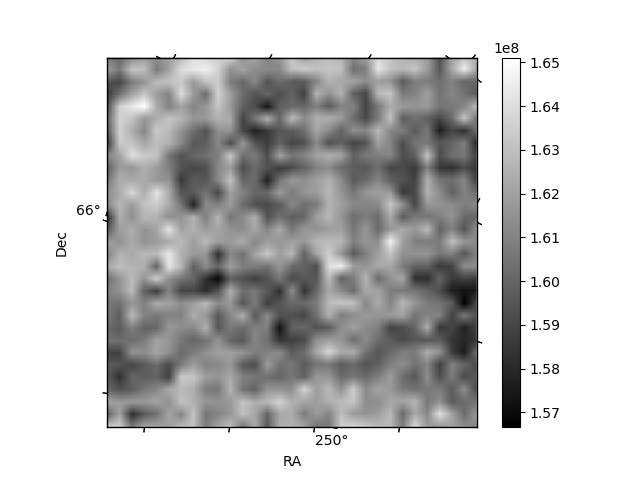
Histogram calculated using DETX and DETY for each event in the final _common_clean file
| Quadrant A | 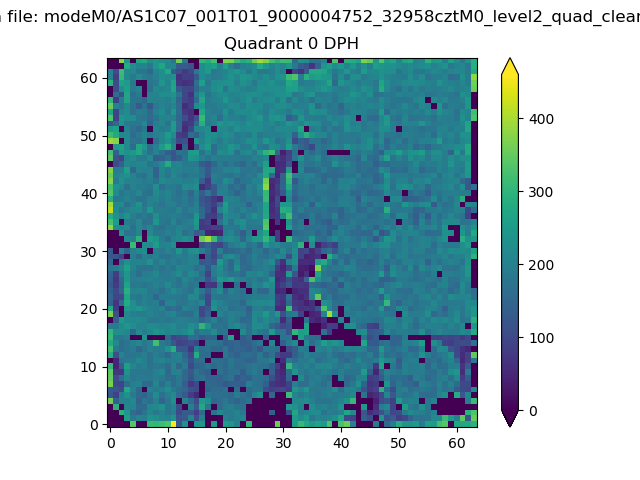 |
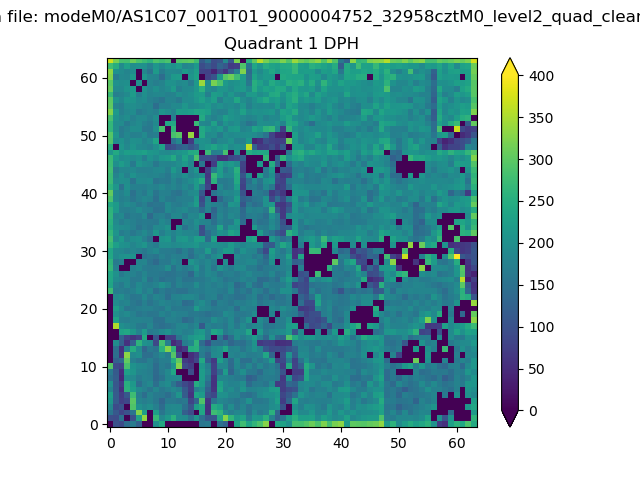 |
Quadrant B |
|---|---|---|---|
| Quadrant D | 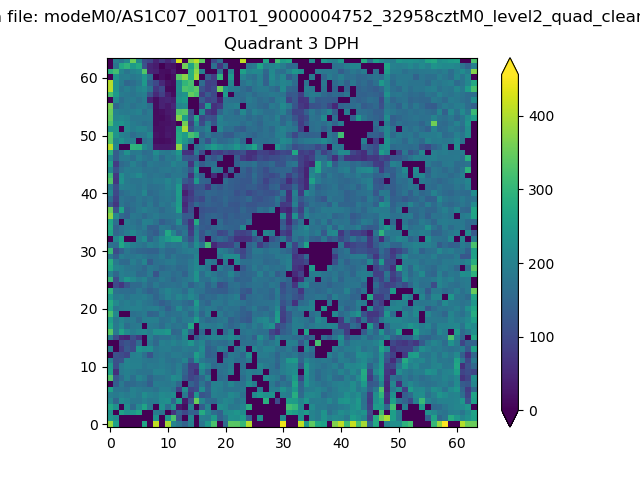 |
 |
Quadrant C |
| Plot type | Count rate plots | Images |
|---|---|---|
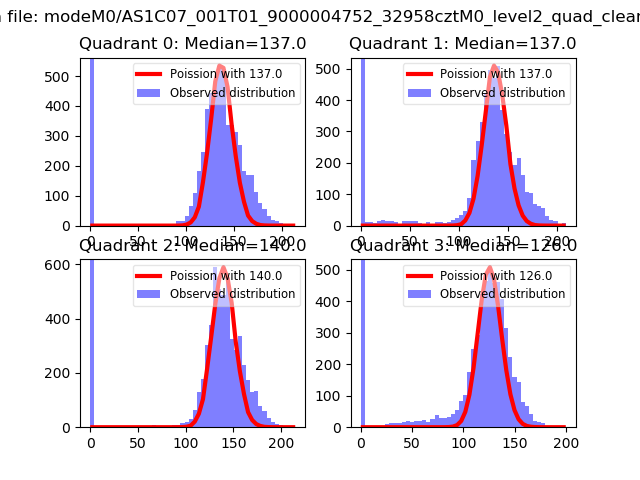
| Comparison with Poisson distribution Blue bars denote a histogram of data divided into 1 sec bins. Red curve is a Poisson curve with rate = median count rate of data. |
 |
 |
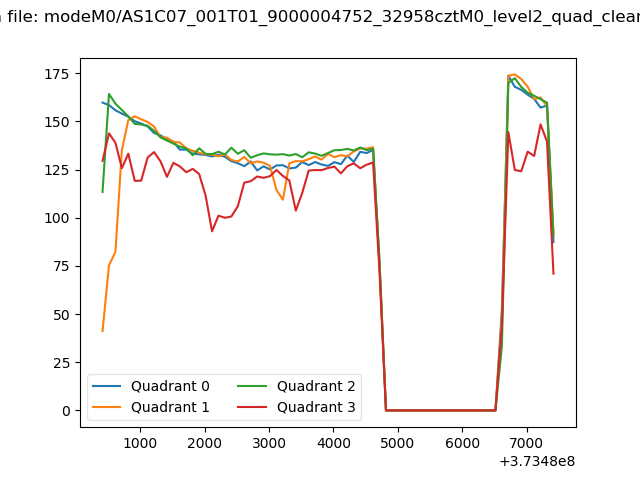
| Quadrant-wise count rates Data is divided into 100 sec bins |
 |
|
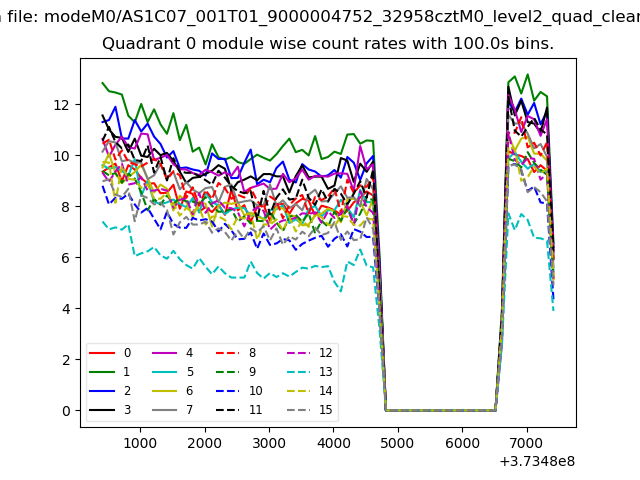
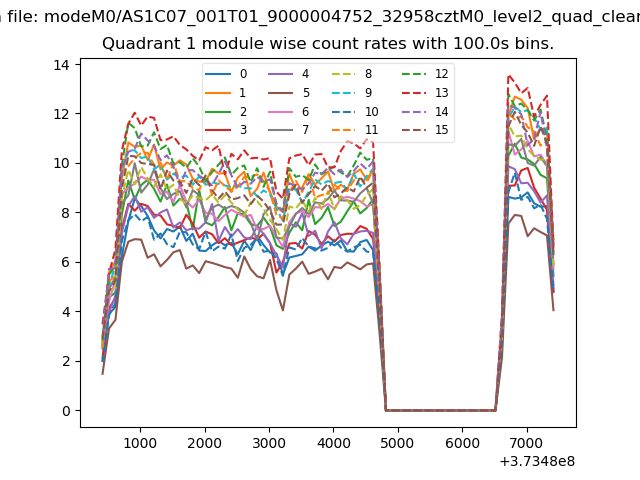
| Module-wise count rates for Quadrant A Data is divided into 100 sec bins |
 |
 |
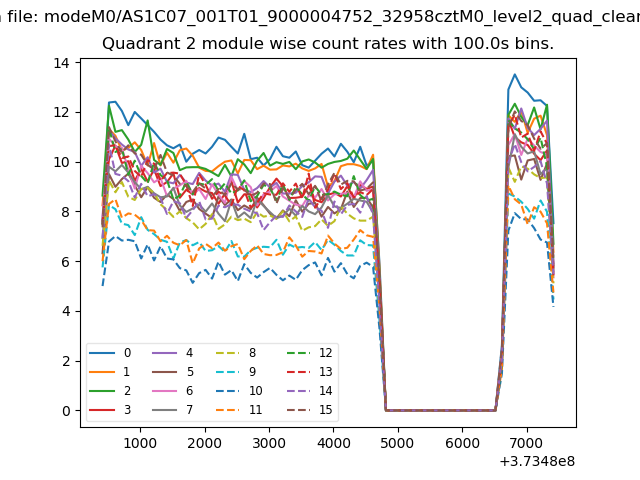
| Module-wise count rates for Quadrant B Data is divided into 100 sec bins |
 |
 |
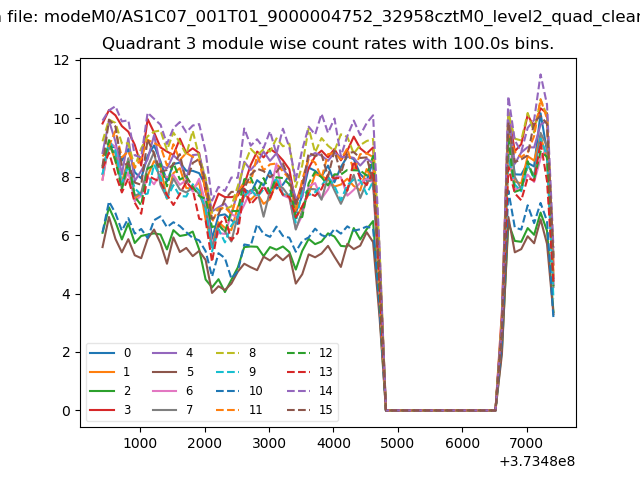
| Module-wise count rates for Quadrant C Data is divided into 100 sec bins |
 |
 |
| Module-wise count rates for Quadrant D Data is divided into 100 sec bins |
 |
 |
| Parameter | Plot |
|---|---|
| CZT HV Monitor | 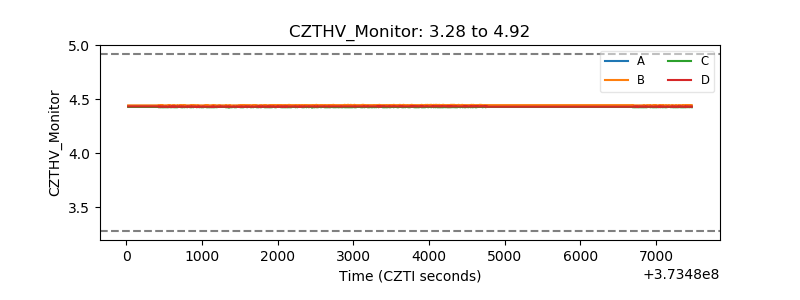 |
| D_VDD | 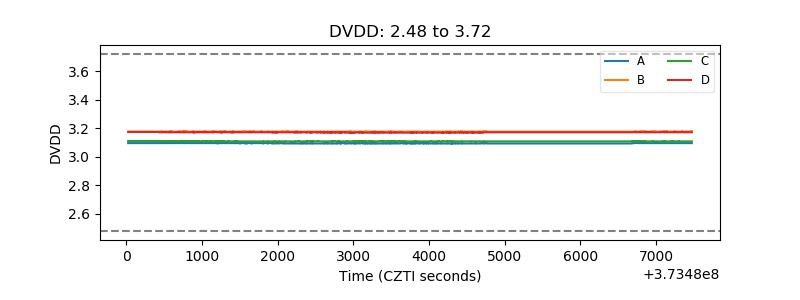 |
| Temperature 1 | 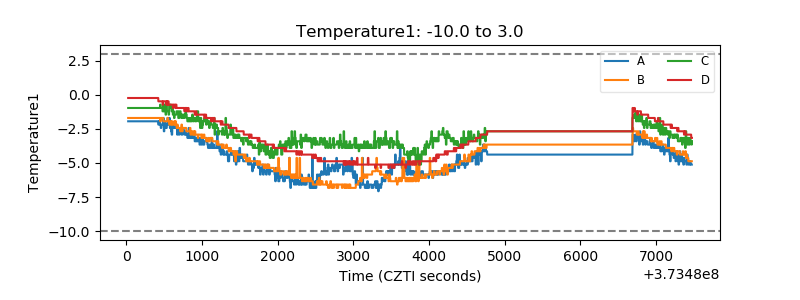 |
| Veto HV Monitor | 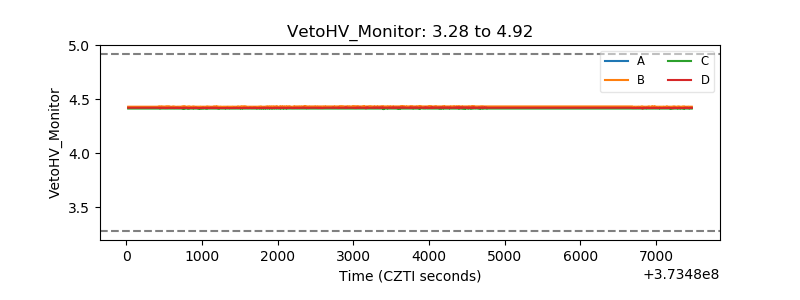 |
| Veto LLD | 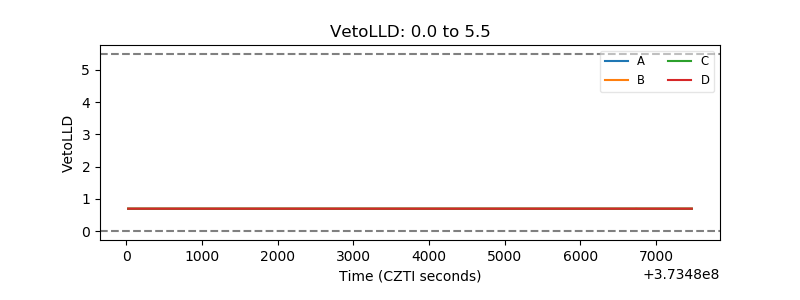 |
| Alpha Counter | 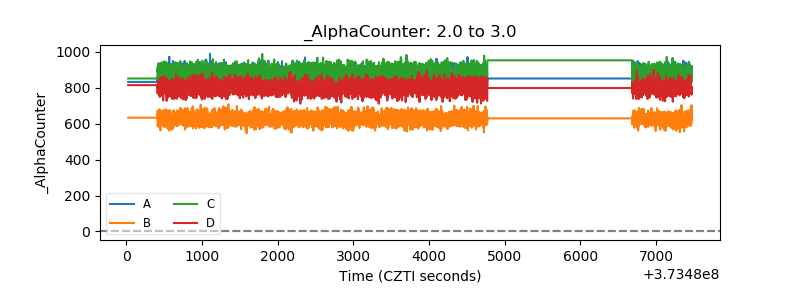 |
| _CPM_Rate | 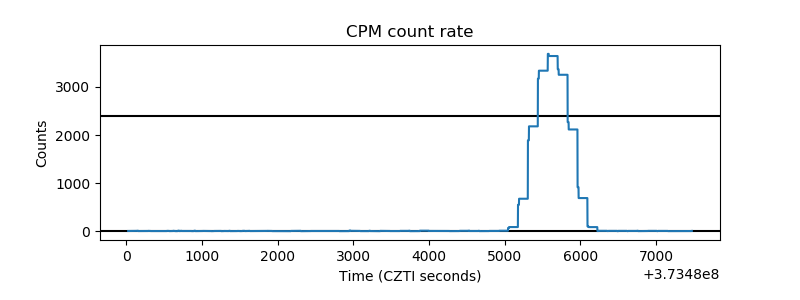 |
| CZT Counter |  |
| +2.5 Volts monitor |  |
| +5 Volts monitor | 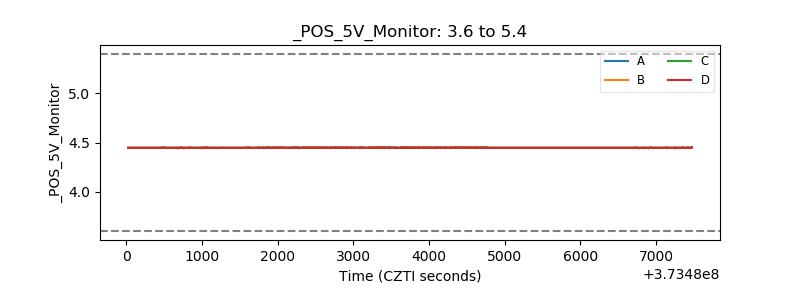 |
| _ROLL_ROT | 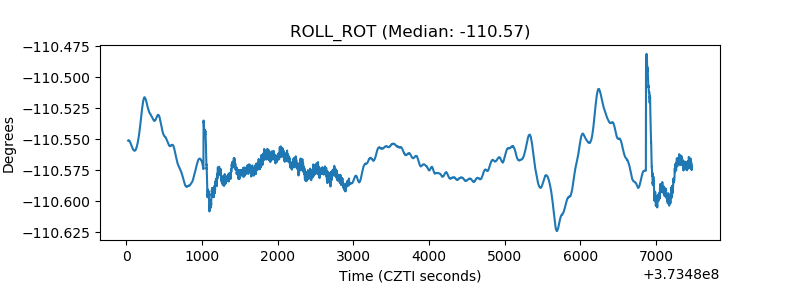 |
| _Roll_DEC | 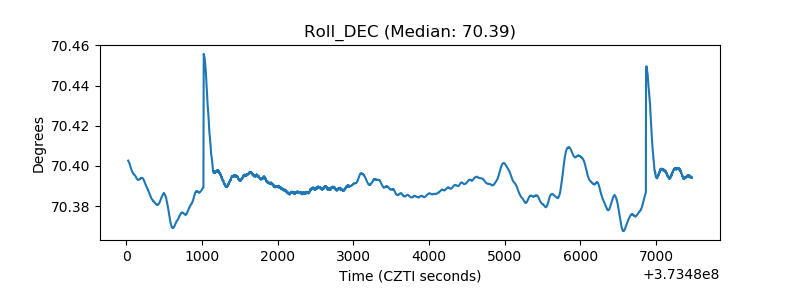 |
| _Roll_RA | 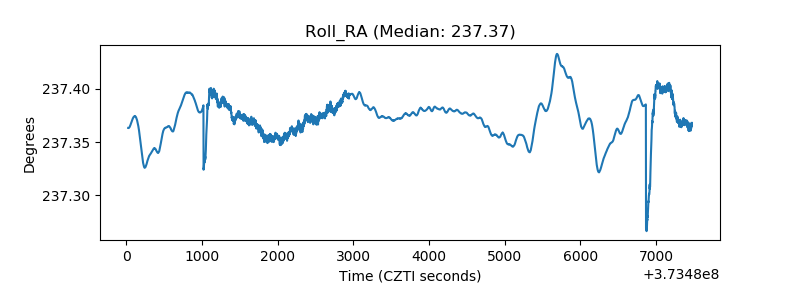 |
| Veto Counter | 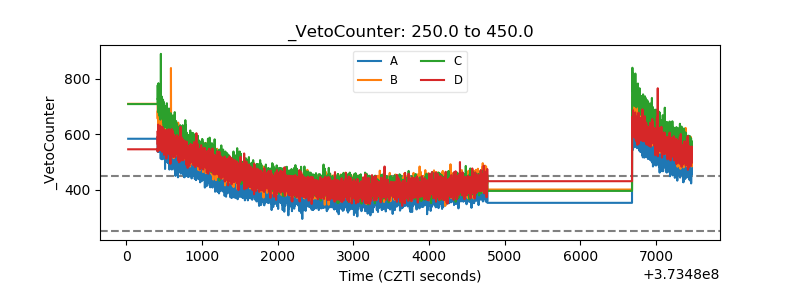 |