| Param | Original file | Final file |
|---|---|---|
| Filename | modeM0/AS1C07_001T01_9000004752_32959cztM0_level2.evt | modeM0/AS1C07_001T01_9000004752_32959cztM0_level2_quad_clean.evt |
| Size (bytes) | 496,097,280 | 106,519,680 |
| Size | 473.1 MB | 101.6 MB |
| Events in quadrant A | 2,466,165 | 729,844 |
| Events in quadrant B | 3,220,117 | 734,556 |
| Events in quadrant C | 2,725,789 | 750,816 |
| Events in quadrant D | 6,269,752 | 656,212 |
| Mode M0 | |||
|---|---|---|---|
| Quadrant | BADHDUFLAG | Total packets | Discarded packets |
| A | 0 | 10457 | 3 |
| B | 0 | 12772 | 2 |
| C | 0 | 11170 | 2 |
| D | 0 | 22211 | 2 |
| Mode SS | |||
|---|---|---|---|
| Quadrant | BADHDUFLAG | Total packets | Discarded packets |
| A | 0 | 102 | 0 |
| B | 0 | 102 | 0 |
| C | 0 | 102 | 0 |
| D | 0 | 102 | 0 |
| Mode M9 | |||
|---|---|---|---|
| Quadrant | BADHDUFLAG | Total packets | Discarded packets |
| A | 0 | 29 | 0 |
| B | 0 | 29 | 0 |
| C | 0 | 29 | 0 |
| D | 0 | 30 | 0 |
| Quadrant | Total seconds | Saturated seconds | Saturation percentage |
|---|---|---|---|
| A | 5060 | 8 | 0.158103% |
| B | 5060 | 218 | 4.308300% |
| C | 5060 | 59 | 1.166008% |
| D | 5060 | 655 | 12.944664% |
Noise dominated data is calculated using 1-second bins in cleaned event files. If a bin has >2000 counts, and if more than 50% of those come from <1% of pixels, then it is considered to be noise-dominated and hence unusable.
| Quadrant | # 1 sec bins | Bins with >0 counts | Bins with >2000 counts | High rate bins dominated by noise | Noise dominated (total time) | Noise dominated (detector-on time) | Marked lightcurve |
|---|---|---|---|---|---|---|---|
| A | 7093 | 5061 | 2 | 2 | 0.03% | 0.04% | 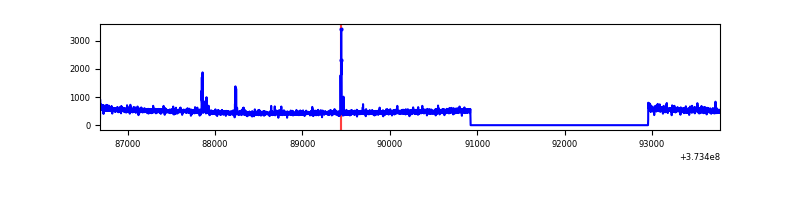 |
| B | 7093 | 5061 | 134 | 134 | 1.89% | 2.65% | 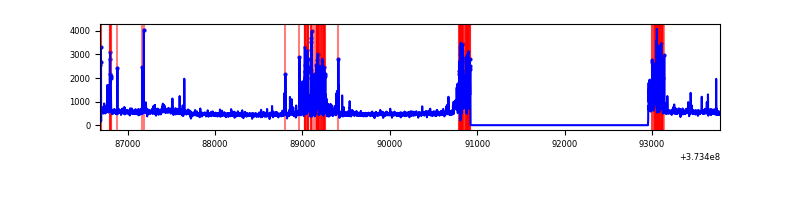 |
| C | 7093 | 5061 | 38 | 38 | 0.54% | 0.75% | 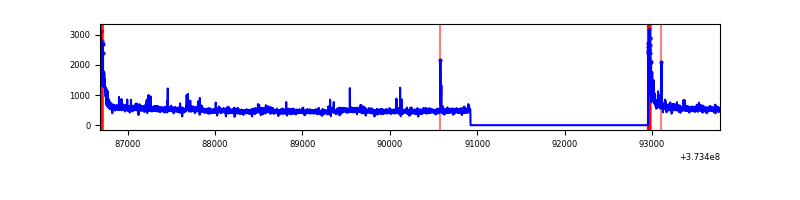 |
| D | 7093 | 5061 | 553 | 553 | 7.80% | 10.93% | 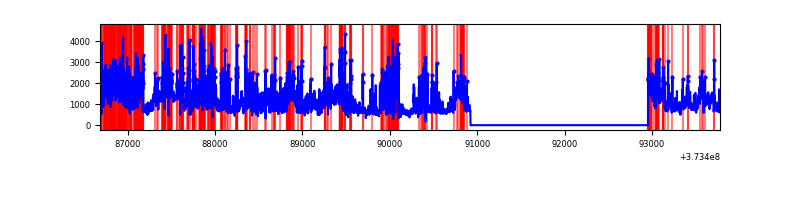 |
Top three noisy pixels from each quadrant. If the there are fewer than three noisy pixels in the level2.evt file, extra rows are filled as -1
| Pixel properties | Quadrant properties | ||||||
|---|---|---|---|---|---|---|---|
| Quadrant | DetID | PixID | Counts | Sigma | Mean | Median | Sigma |
| A | 12 | 227 | 23247 | 185.09 | 618 | 606 | 122.3 |
| A | 13 | 6 | 17753 | 140.18 | 618 | 606 | 122.3 |
| A | 0 | 254 | 12962 | 101.01 | 618 | 606 | 122.3 |
| B | 5 | 172 | 585924 | 5184.27 | 614 | 600 | 112.9 |
| B | 0 | 219 | 67951 | 596.53 | 614 | 600 | 112.9 |
| B | 0 | 229 | 61385 | 538.38 | 614 | 600 | 112.9 |
| C | 0 | 10 | 207224 | 1471.84 | 617 | 624 | 140.4 |
| C | 9 | 187 | 36831 | 257.94 | 617 | 624 | 140.4 |
| C | 1 | 241 | 16769 | 115.02 | 617 | 624 | 140.4 |
| D | 8 | 195 | 1667131 | 11198.76 | 581 | 572 | 148.8 |
| D | 7 | 223 | 615031 | 4128.97 | 581 | 572 | 148.8 |
| D | 2 | 250 | 604857 | 4060.61 | 581 | 572 | 148.8 |
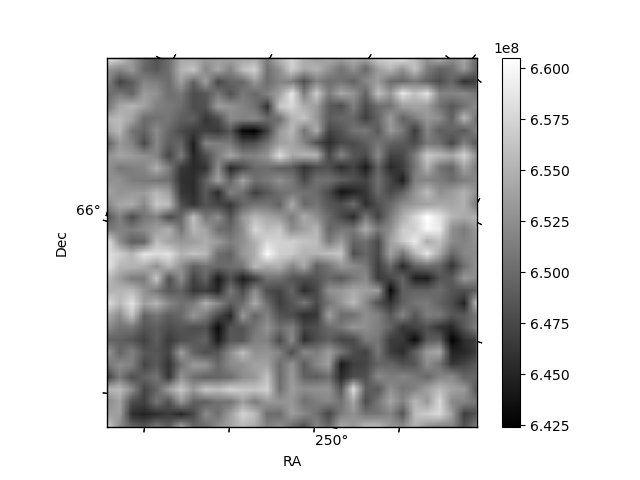
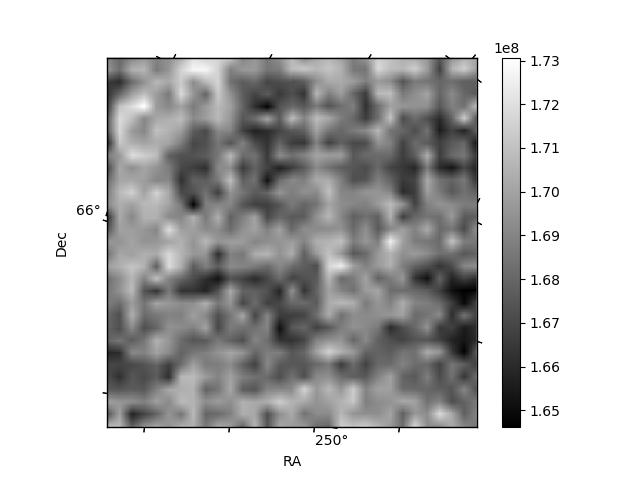
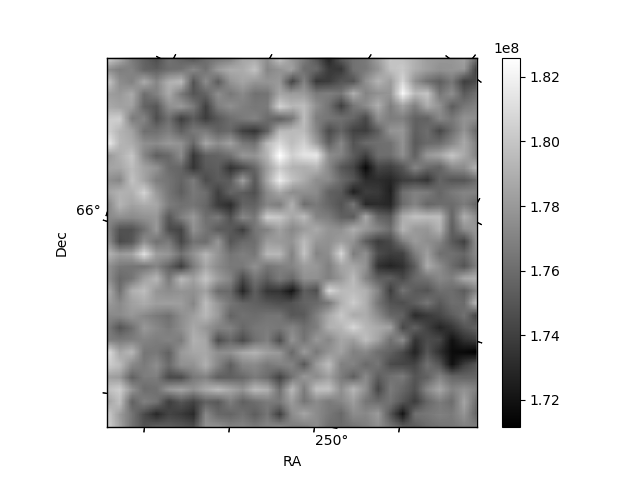
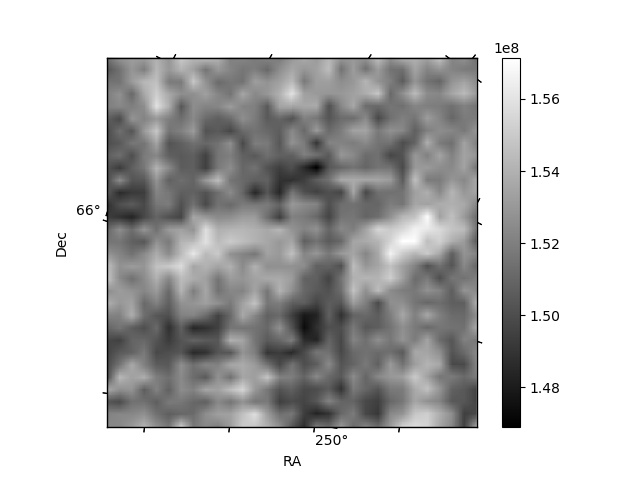
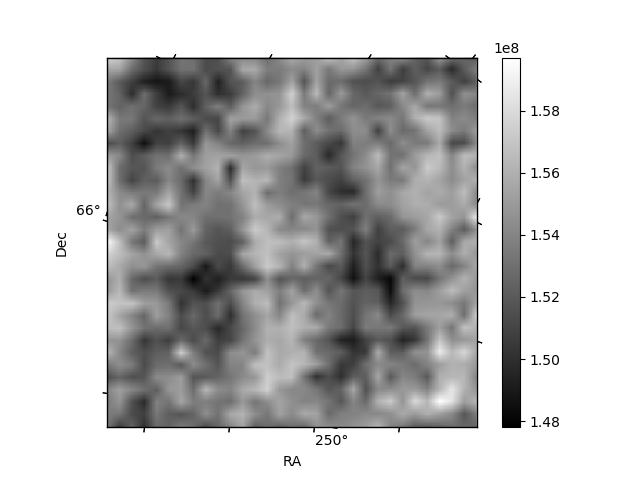
Histogram calculated using DETX and DETY for each event in the final _common_clean file
| Quadrant A | 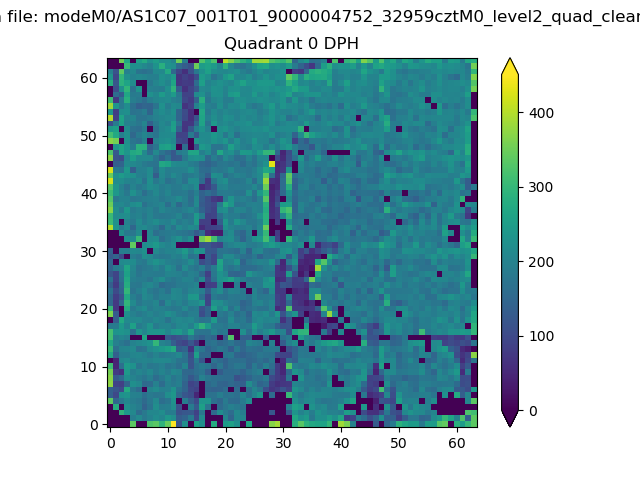 |
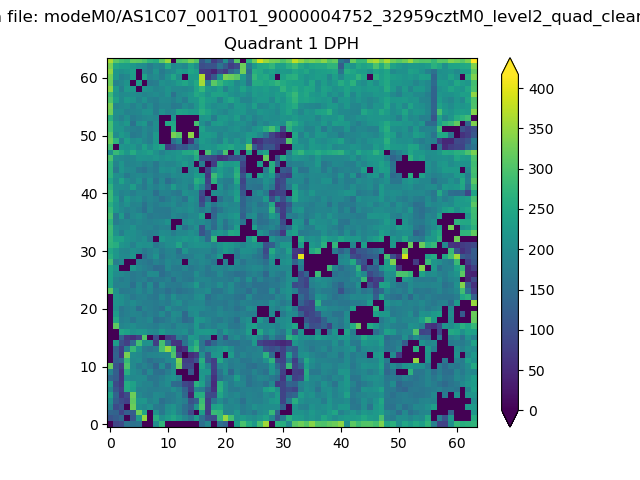 |
Quadrant B |
|---|---|---|---|
| Quadrant D |  |
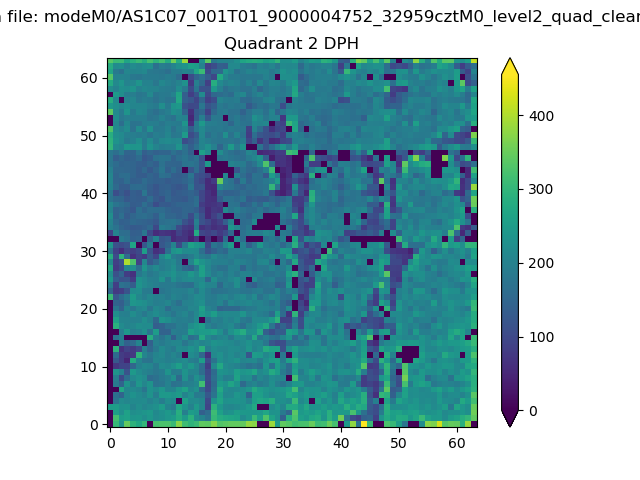 |
Quadrant C |
| Plot type | Count rate plots | Images |
|---|---|---|
| Comparison with Poisson distribution Blue bars denote a histogram of data divided into 1 sec bins. Red curve is a Poisson curve with rate = median count rate of data. |
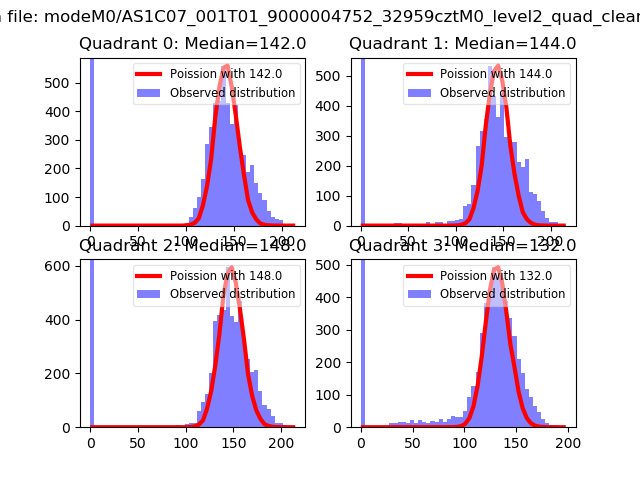 |
 |
| Quadrant-wise count rates Data is divided into 100 sec bins |
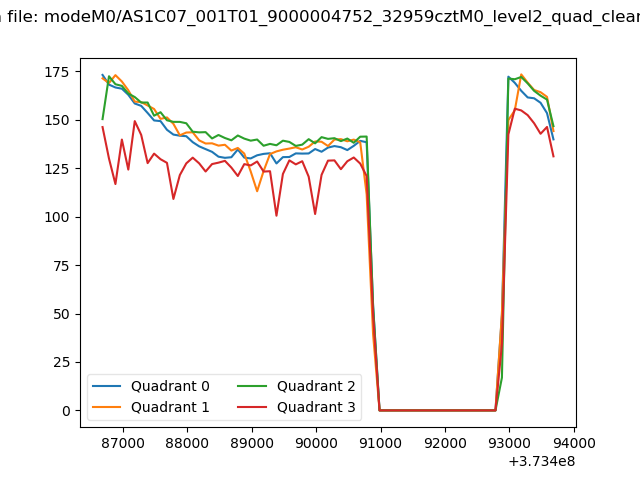 |
|
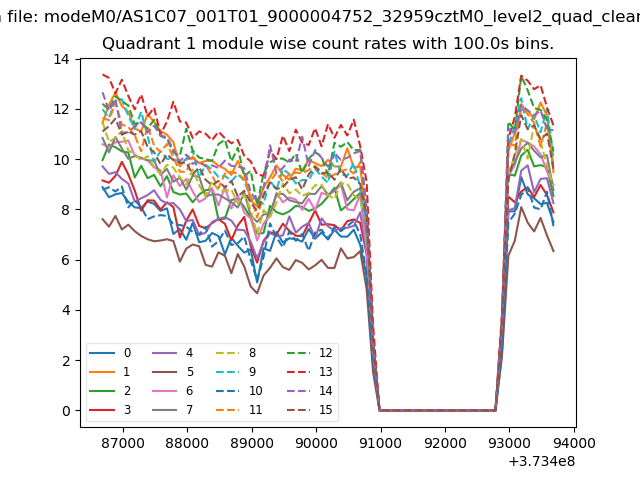
| Module-wise count rates for Quadrant A Data is divided into 100 sec bins |
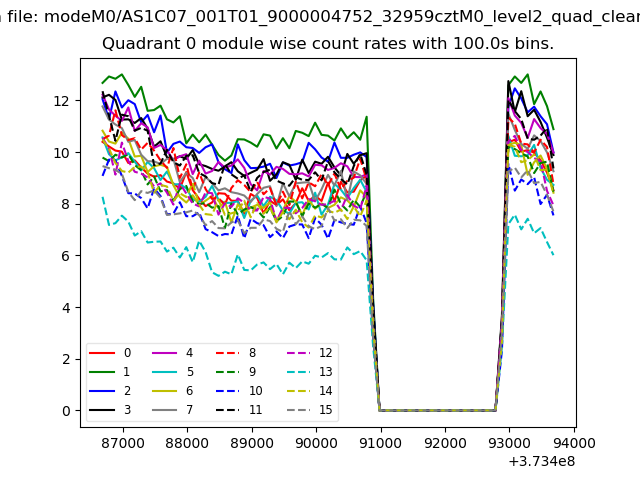 |
 |
| Module-wise count rates for Quadrant B Data is divided into 100 sec bins |
 |
 |
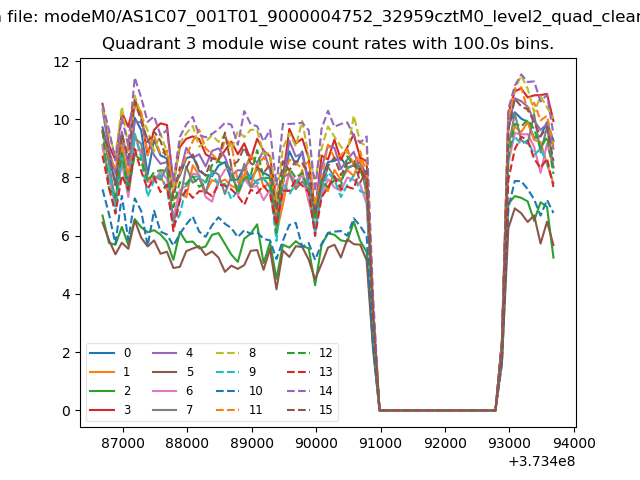
| Module-wise count rates for Quadrant C Data is divided into 100 sec bins |
 |
 |
| Module-wise count rates for Quadrant D Data is divided into 100 sec bins |
 |
 |
| Parameter | Plot |
|---|---|
| CZT HV Monitor | 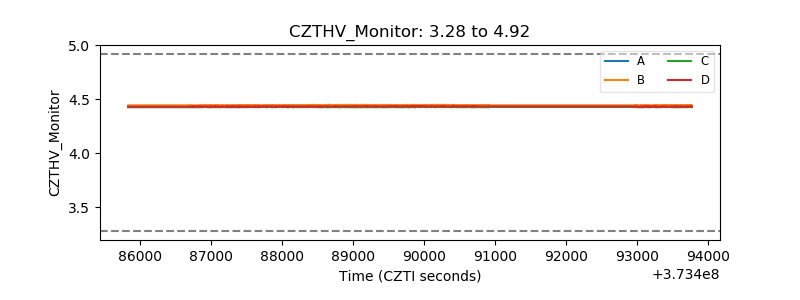 |
| D_VDD | 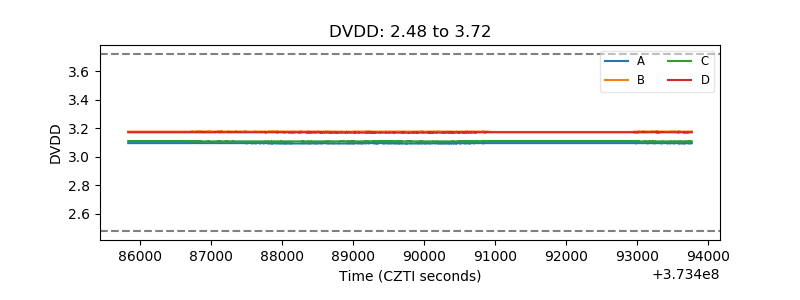 |
| Temperature 1 | 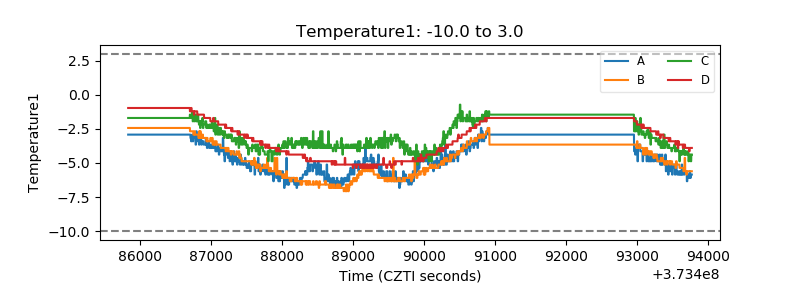 |
| Veto HV Monitor | 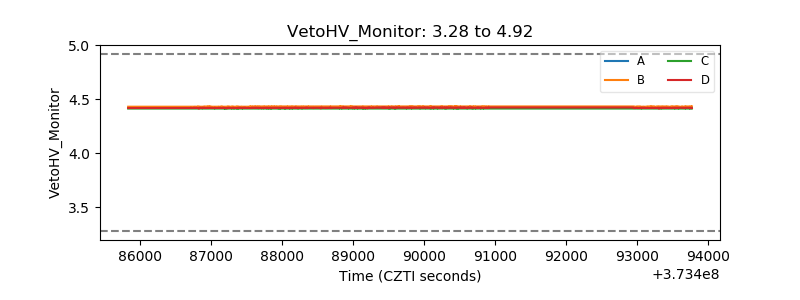 |
| Veto LLD |  |
| Alpha Counter | 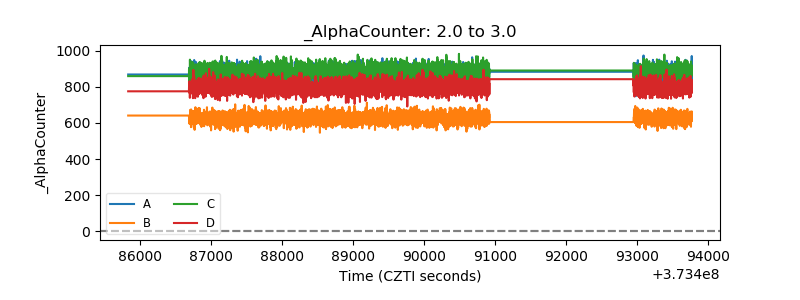 |
| _CPM_Rate | 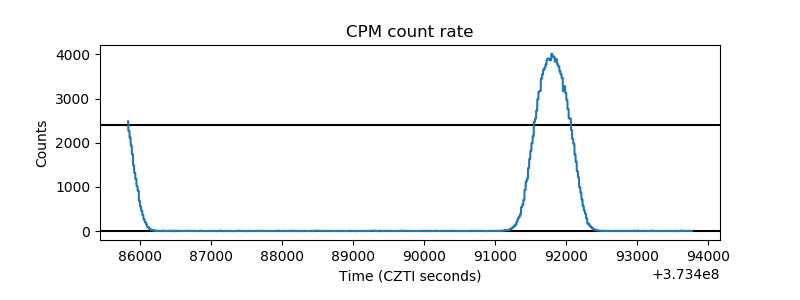 |
| CZT Counter | 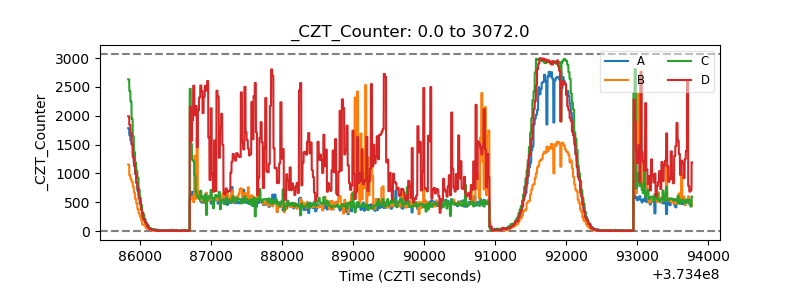 |
| +2.5 Volts monitor |  |
| +5 Volts monitor | 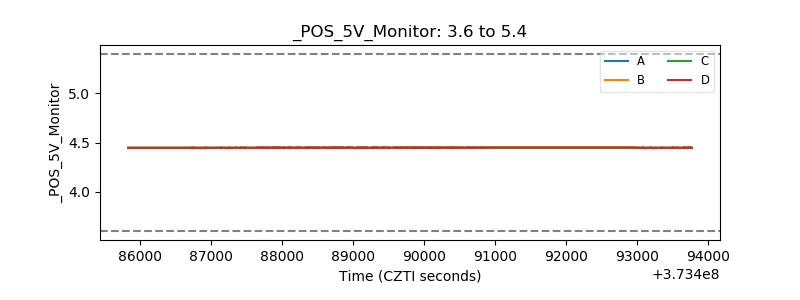 |
| _ROLL_ROT | 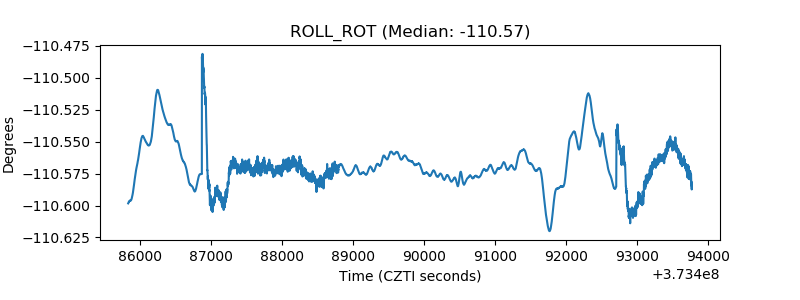 |
| _Roll_DEC | 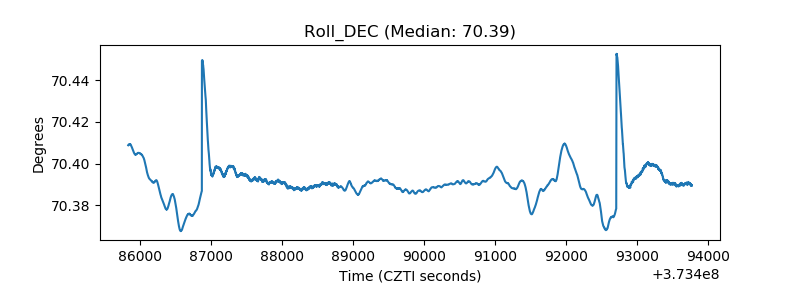 |
| _Roll_RA | 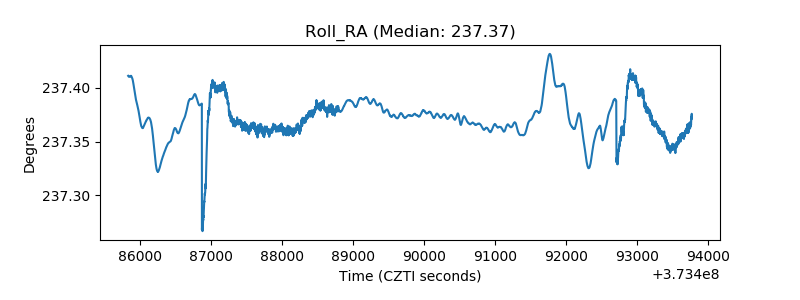 |
| Veto Counter |  |