| Param | Original file | Final file |
|---|---|---|
| Filename | modeM0/AS1C07_001T01_9000004752_32960cztM0_level2.evt | modeM0/AS1C07_001T01_9000004752_32960cztM0_level2_quad_clean.evt |
| Size (bytes) | 460,969,920 | 102,260,160 |
| Size | 439.6 MB | 97.5 MB |
| Events in quadrant A | 2,322,042 | 697,884 |
| Events in quadrant B | 3,007,021 | 707,158 |
| Events in quadrant C | 2,592,690 | 719,659 |
| Events in quadrant D | 5,710,368 | 632,280 |
| Mode M0 | |||
|---|---|---|---|
| Quadrant | BADHDUFLAG | Total packets | Discarded packets |
| A | 0 | 9923 | 3 |
| B | 0 | 12054 | 2 |
| C | 0 | 10705 | 2 |
| D | 0 | 20469 | 2 |
| Mode SS | |||
|---|---|---|---|
| Quadrant | BADHDUFLAG | Total packets | Discarded packets |
| A | 0 | 98 | 0 |
| B | 0 | 98 | 0 |
| C | 0 | 98 | 0 |
| D | 0 | 98 | 0 |
| Mode M9 | |||
|---|---|---|---|
| Quadrant | BADHDUFLAG | Total packets | Discarded packets |
| A | 0 | 33 | 0 |
| B | 0 | 33 | 0 |
| C | 0 | 33 | 0 |
| D | 0 | 34 | 0 |
| Quadrant | Total seconds | Saturated seconds | Saturation percentage |
|---|---|---|---|
| A | 4846 | 5 | 0.103178% |
| B | 4846 | 168 | 3.466777% |
| C | 4846 | 61 | 1.258770% |
| D | 4846 | 508 | 10.482872% |
Noise dominated data is calculated using 1-second bins in cleaned event files. If a bin has >2000 counts, and if more than 50% of those come from <1% of pixels, then it is considered to be noise-dominated and hence unusable.
| Quadrant | # 1 sec bins | Bins with >0 counts | Bins with >2000 counts | High rate bins dominated by noise | Noise dominated (total time) | Noise dominated (detector-on time) | Marked lightcurve |
|---|---|---|---|---|---|---|---|
| A | 6968 | 4846 | 4 | 4 | 0.06% | 0.08% | 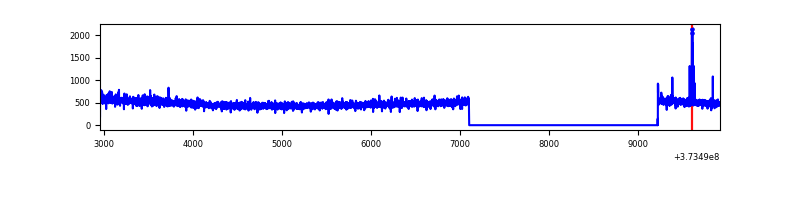 |
| B | 6968 | 4847 | 118 | 118 | 1.69% | 2.43% | 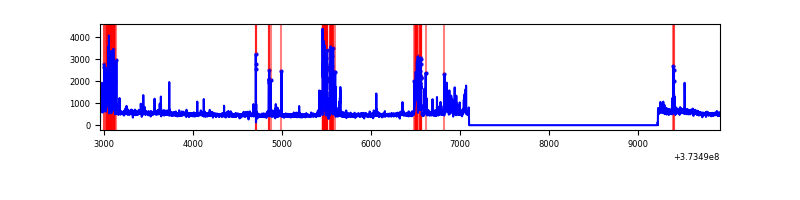 |
| C | 6968 | 4847 | 39 | 39 | 0.56% | 0.80% | 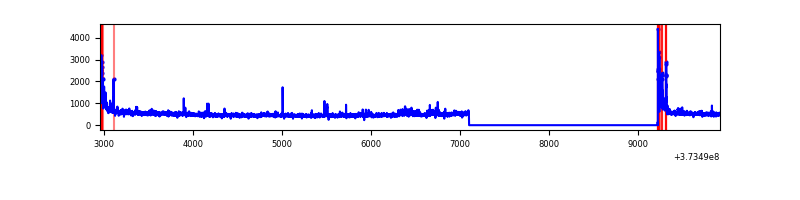 |
| D | 6968 | 4845 | 455 | 455 | 6.53% | 9.39% | 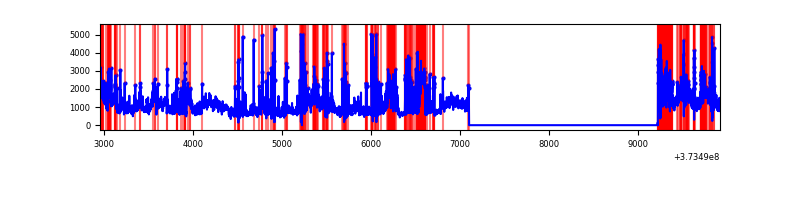 |
Top three noisy pixels from each quadrant. If the there are fewer than three noisy pixels in the level2.evt file, extra rows are filled as -1
| Pixel properties | Quadrant properties | ||||||
|---|---|---|---|---|---|---|---|
| Quadrant | DetID | PixID | Counts | Sigma | Mean | Median | Sigma |
| A | 0 | 254 | 22915 | 193.15 | 587 | 577 | 115.6 |
| A | 13 | 6 | 13581 | 112.44 | 587 | 577 | 115.6 |
| A | 13 | 254 | 7680 | 61.42 | 587 | 577 | 115.6 |
| B | 5 | 172 | 509103 | 4717.74 | 586 | 574 | 107.8 |
| B | 0 | 219 | 60256 | 553.68 | 586 | 574 | 107.8 |
| B | 0 | 230 | 27528 | 250.06 | 586 | 574 | 107.8 |
| C | 0 | 10 | 245938 | 1842.79 | 586 | 593 | 133.1 |
| C | 14 | 67 | 16559 | 119.92 | 586 | 593 | 133.1 |
| C | 9 | 187 | 13404 | 96.22 | 586 | 593 | 133.1 |
| D | 8 | 195 | 1380734 | 9783.6 | 552 | 539 | 141.1 |
| D | 7 | 223 | 819802 | 5807.4 | 552 | 539 | 141.1 |
| D | 3 | 13 | 253091 | 1790.23 | 552 | 539 | 141.1 |
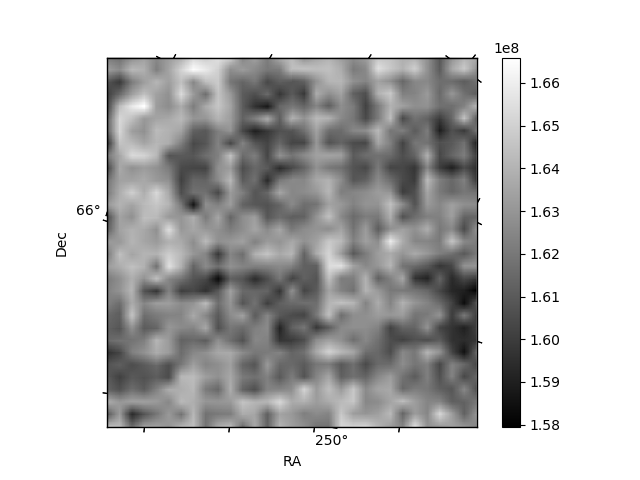
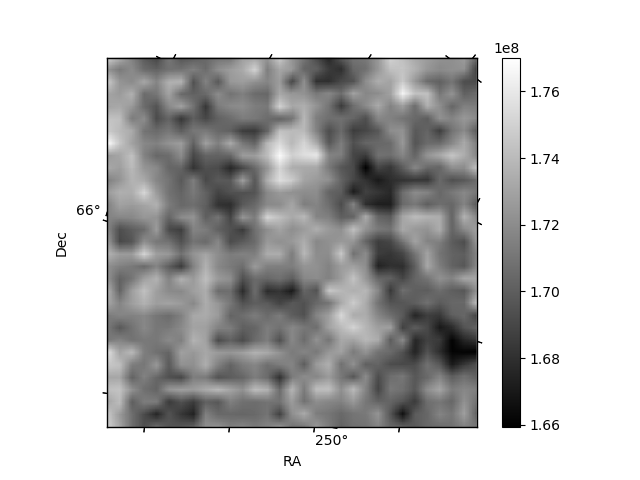
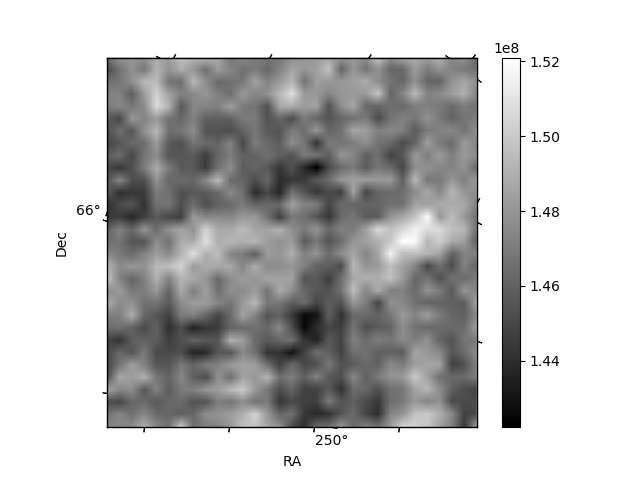
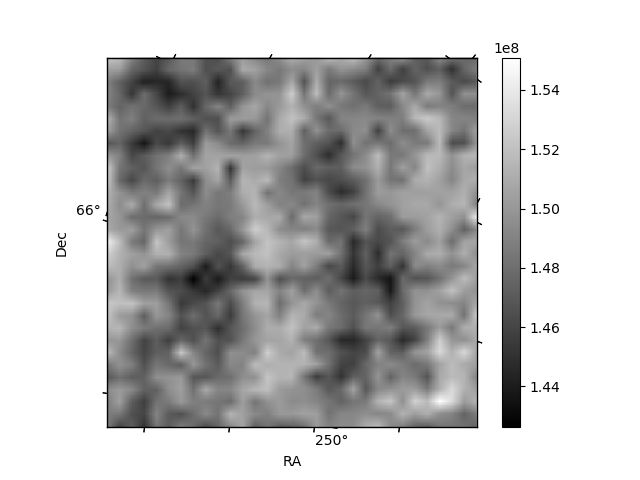
Histogram calculated using DETX and DETY for each event in the final _common_clean file
| Quadrant A |  |
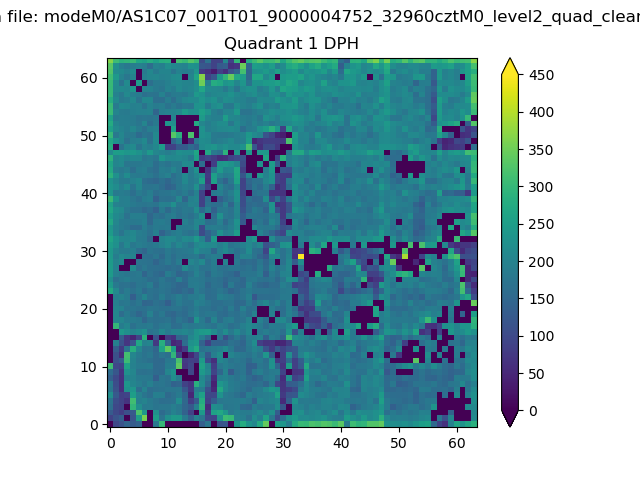 |
Quadrant B |
|---|---|---|---|
| Quadrant D | 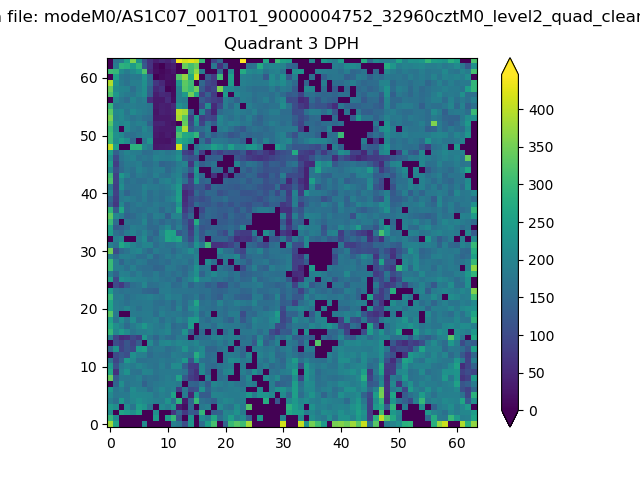 |
 |
Quadrant C |
| Plot type | Count rate plots | Images |
|---|---|---|
| Comparison with Poisson distribution Blue bars denote a histogram of data divided into 1 sec bins. Red curve is a Poisson curve with rate = median count rate of data. |
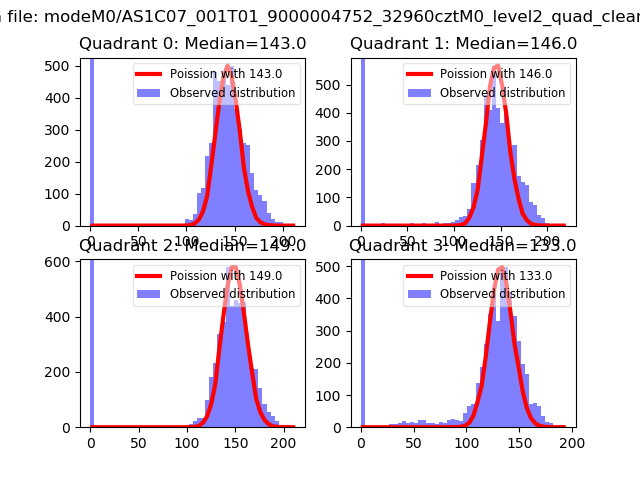 |
 |
| Quadrant-wise count rates Data is divided into 100 sec bins |
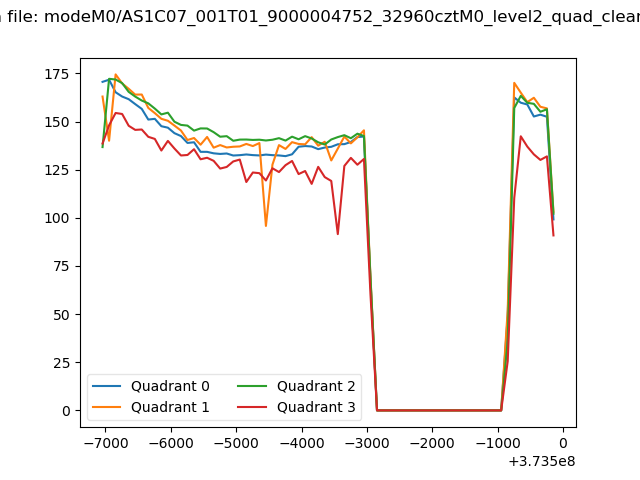 |
|
| Module-wise count rates for Quadrant A Data is divided into 100 sec bins |
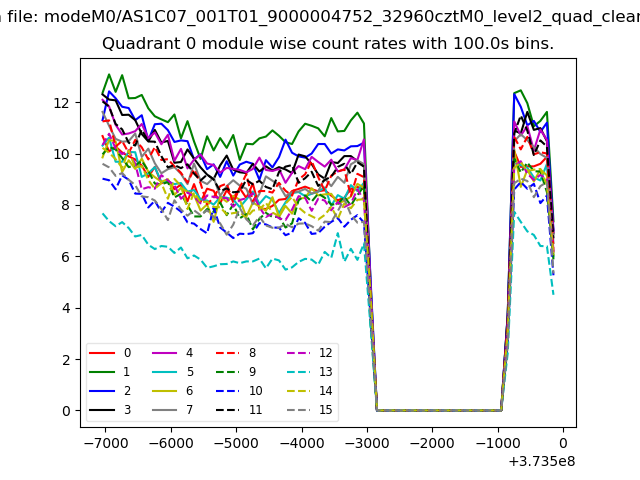 |
 |
| Module-wise count rates for Quadrant B Data is divided into 100 sec bins |
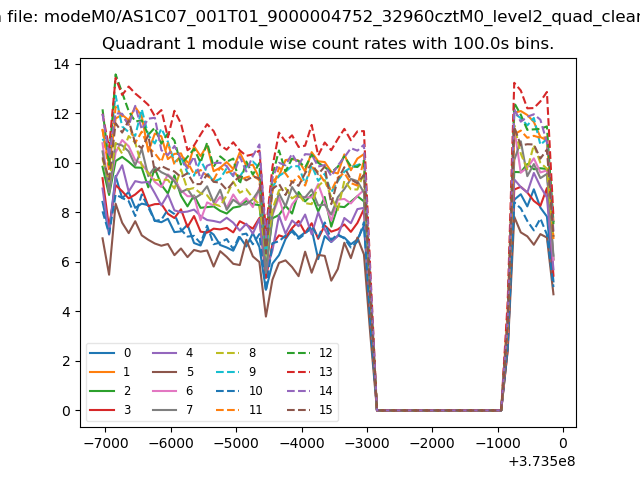 |
 |
| Module-wise count rates for Quadrant C Data is divided into 100 sec bins |
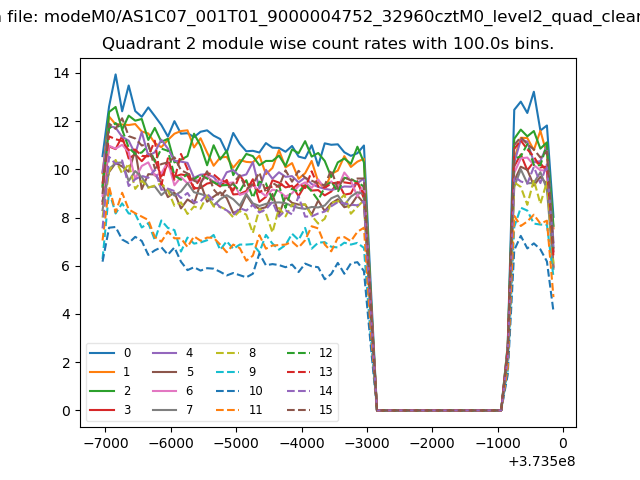 |
 |
| Module-wise count rates for Quadrant D Data is divided into 100 sec bins |
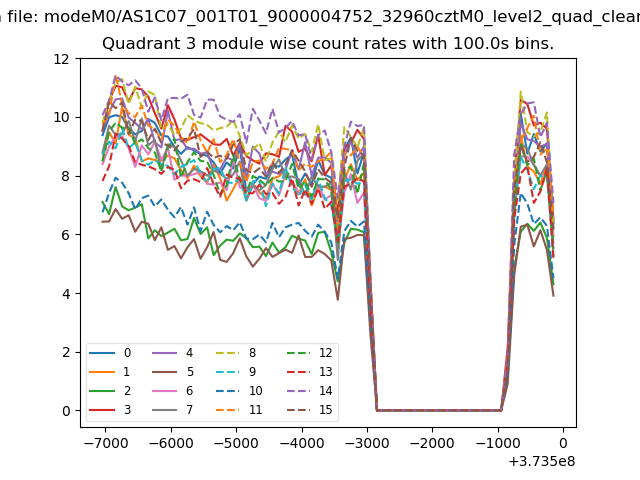 |
 |
| Parameter | Plot |
|---|---|
| CZT HV Monitor | 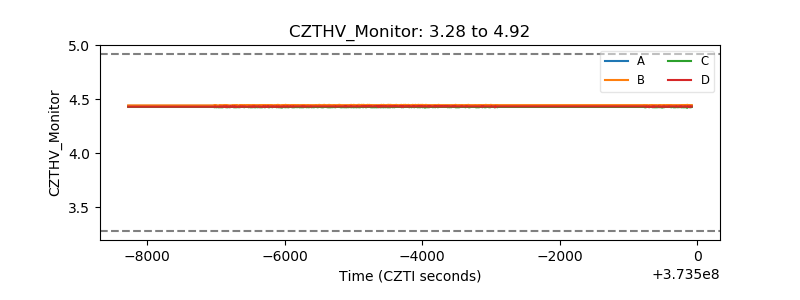 |
| D_VDD | 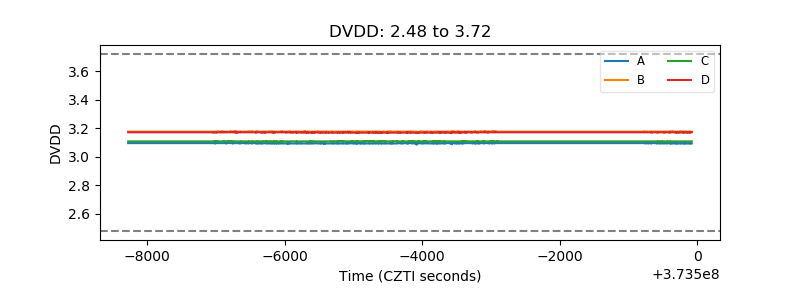 |
| Temperature 1 | 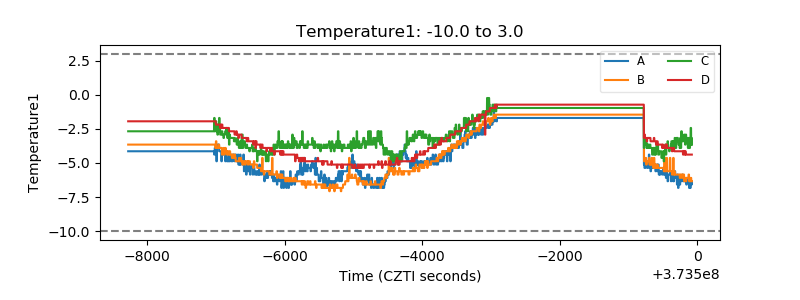 |
| Veto HV Monitor | 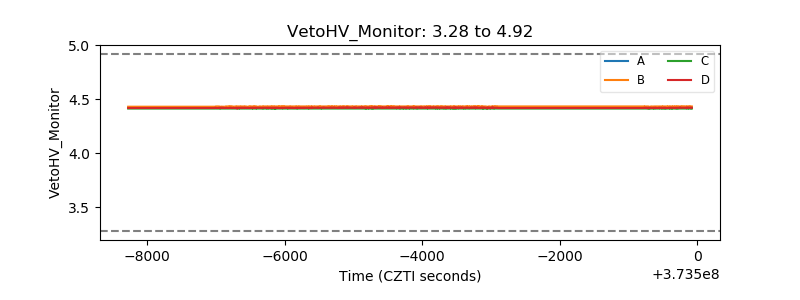 |
| Veto LLD | 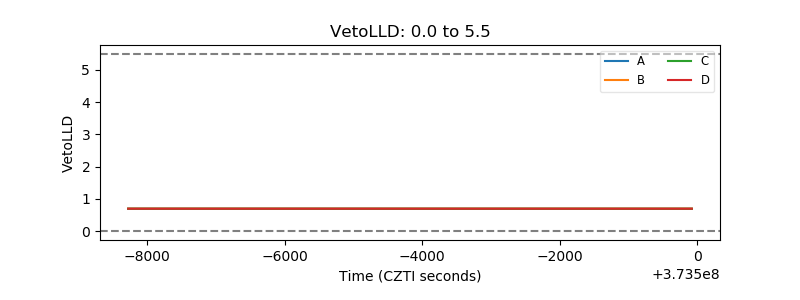 |
| Alpha Counter | 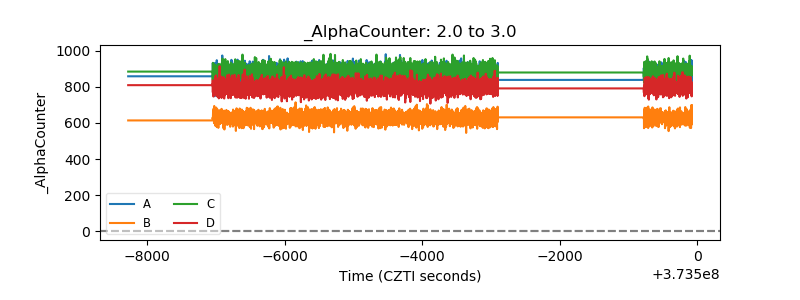 |
| _CPM_Rate | 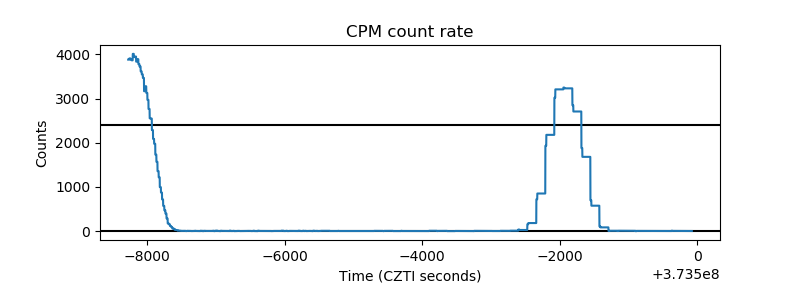 |
| CZT Counter |  |
| +2.5 Volts monitor |  |
| +5 Volts monitor |  |
| _ROLL_ROT | 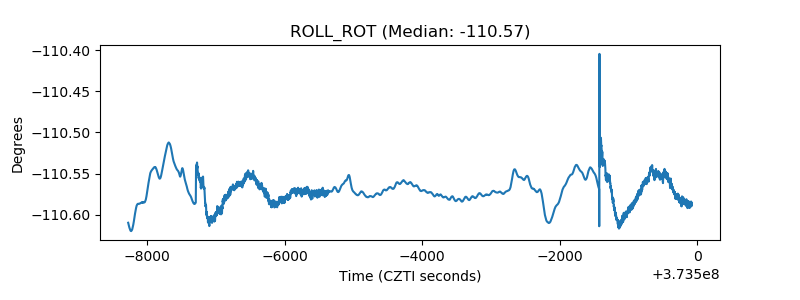 |
| _Roll_DEC | 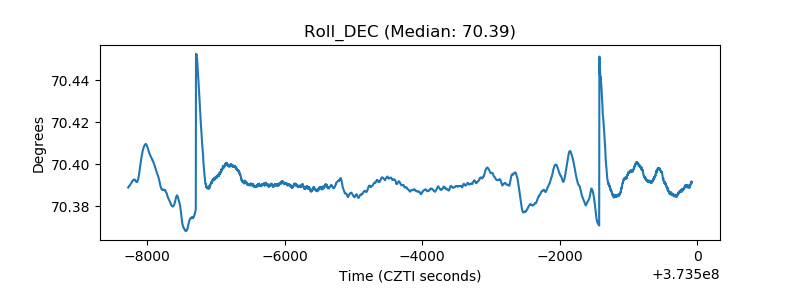 |
| _Roll_RA |  |
| Veto Counter | 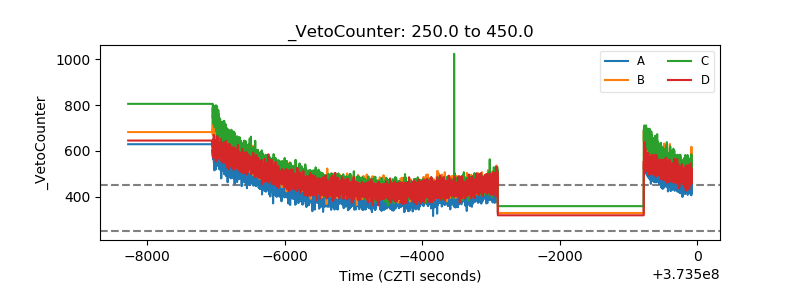 |