| Param | Original file | Final file |
|---|---|---|
| Filename | modeM0/AS1C07_001T01_9000004752_32961cztM0_level2.evt | modeM0/AS1C07_001T01_9000004752_32961cztM0_level2_quad_clean.evt |
| Size (bytes) | 545,028,480 | 104,762,880 |
| Size | 519.8 MB | 99.9 MB |
| Events in quadrant A | 2,416,117 | 721,945 |
| Events in quadrant B | 3,209,133 | 733,351 |
| Events in quadrant C | 2,566,846 | 743,046 |
| Events in quadrant D | 7,961,000 | 608,515 |
| Mode M0 | |||
|---|---|---|---|
| Quadrant | BADHDUFLAG | Total packets | Discarded packets |
| A | 0 | 10559 | 3 |
| B | 0 | 12918 | 2 |
| C | 0 | 10983 | 2 |
| D | 0 | 27290 | 2 |
| Mode SS | |||
|---|---|---|---|
| Quadrant | BADHDUFLAG | Total packets | Discarded packets |
| A | 0 | 108 | 0 |
| B | 0 | 108 | 0 |
| C | 0 | 108 | 0 |
| D | 0 | 108 | 0 |
| Mode M9 | |||
|---|---|---|---|
| Quadrant | BADHDUFLAG | Total packets | Discarded packets |
| A | 0 | 35 | 0 |
| B | 0 | 35 | 0 |
| C | 0 | 35 | 0 |
| D | 0 | 36 | 0 |
| Quadrant | Total seconds | Saturated seconds | Saturation percentage |
|---|---|---|---|
| A | 5212 | 5 | 0.095932% |
| B | 5212 | 141 | 2.705295% |
| C | 5212 | 46 | 0.882579% |
| D | 5212 | 1220 | 23.407521% |
Noise dominated data is calculated using 1-second bins in cleaned event files. If a bin has >2000 counts, and if more than 50% of those come from <1% of pixels, then it is considered to be noise-dominated and hence unusable.
| Quadrant | # 1 sec bins | Bins with >0 counts | Bins with >2000 counts | High rate bins dominated by noise | Noise dominated (total time) | Noise dominated (detector-on time) | Marked lightcurve |
|---|---|---|---|---|---|---|---|
| A | 7364 | 5212 | 4 | 4 | 0.05% | 0.08% | 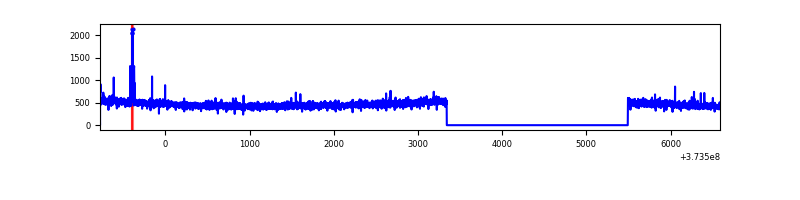 |
| B | 7364 | 5213 | 105 | 105 | 1.43% | 2.01% | 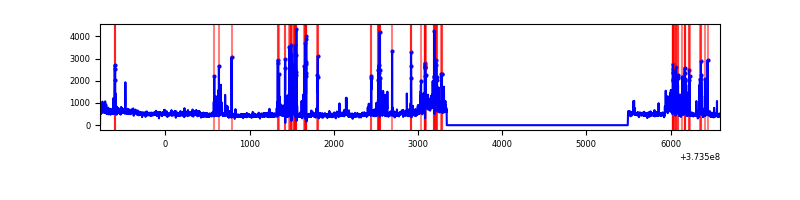 |
| C | 7364 | 5213 | 28 | 28 | 0.38% | 0.54% | 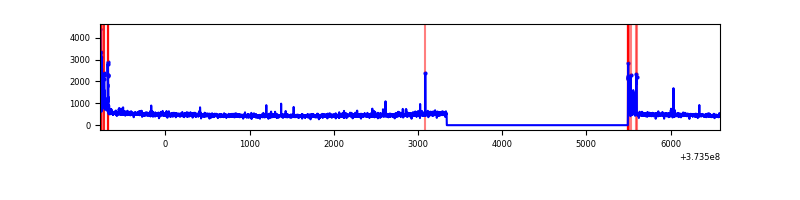 |
| D | 7364 | 5212 | 1205 | 1205 | 16.36% | 23.12% | 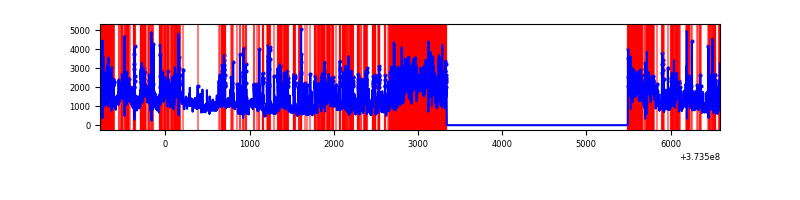 |
Top three noisy pixels from each quadrant. If the there are fewer than three noisy pixels in the level2.evt file, extra rows are filled as -1
| Pixel properties | Quadrant properties | ||||||
|---|---|---|---|---|---|---|---|
| Quadrant | DetID | PixID | Counts | Sigma | Mean | Median | Sigma |
| A | 0 | 254 | 24082 | 194.4 | 613 | 601 | 120.8 |
| A | 13 | 6 | 16467 | 131.35 | 613 | 601 | 120.8 |
| A | 13 | 254 | 9144 | 70.73 | 613 | 601 | 120.8 |
| B | 5 | 172 | 388841 | 3398.48 | 616 | 600 | 114.2 |
| B | 5 | 200 | 155661 | 1357.33 | 616 | 600 | 114.2 |
| B | 0 | 219 | 100072 | 870.73 | 616 | 600 | 114.2 |
| C | 0 | 10 | 135921 | 975.74 | 607 | 614 | 138.7 |
| C | 14 | 67 | 19943 | 139.39 | 607 | 614 | 138.7 |
| C | 1 | 241 | 19505 | 136.23 | 607 | 614 | 138.7 |
| D | 12 | 227 | 2313980 | 16281.2 | 544 | 529 | 142.1 |
| D | 8 | 195 | 1328176 | 9343.48 | 544 | 529 | 142.1 |
| D | 7 | 223 | 676762 | 4759.07 | 544 | 529 | 142.1 |
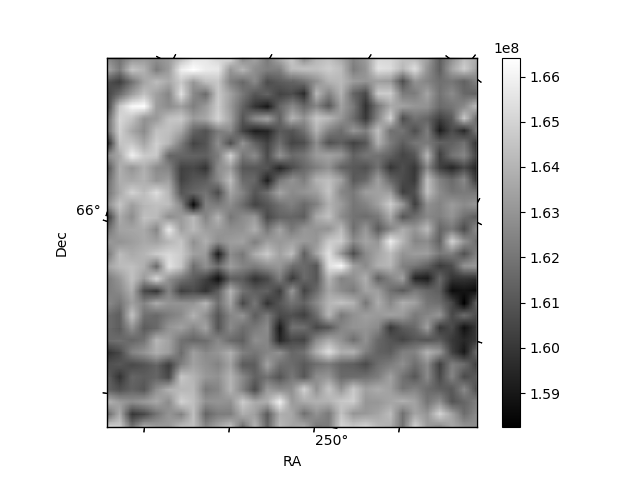
Histogram calculated using DETX and DETY for each event in the final _common_clean file
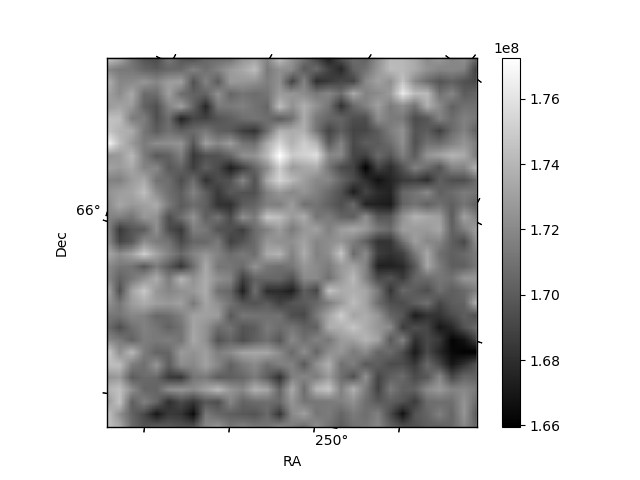
| Quadrant A |  |
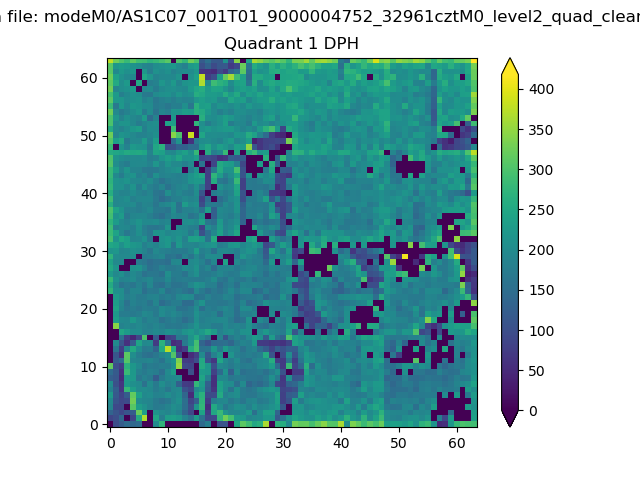 |
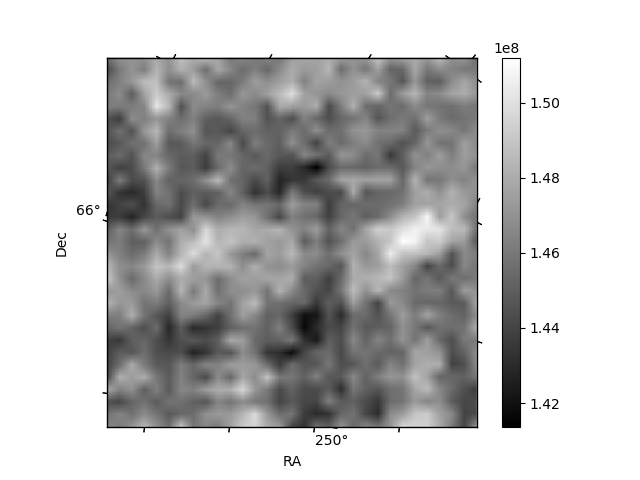
Quadrant B |
|---|---|---|---|
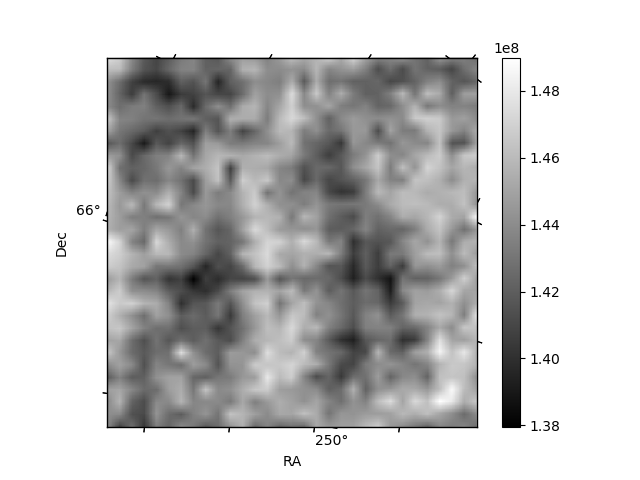
| Quadrant D |  |
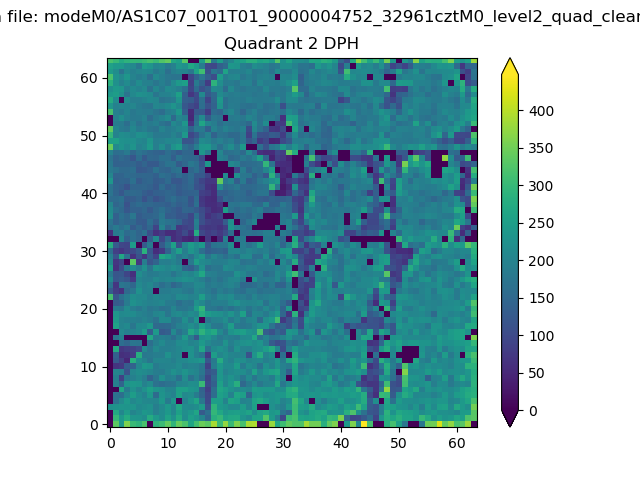 |
Quadrant C |
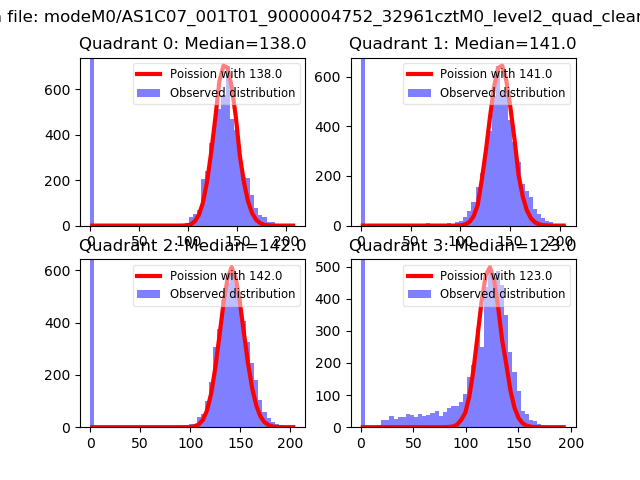
| Plot type | Count rate plots | Images |
|---|---|---|
| Comparison with Poisson distribution Blue bars denote a histogram of data divided into 1 sec bins. Red curve is a Poisson curve with rate = median count rate of data. |
 |
 |
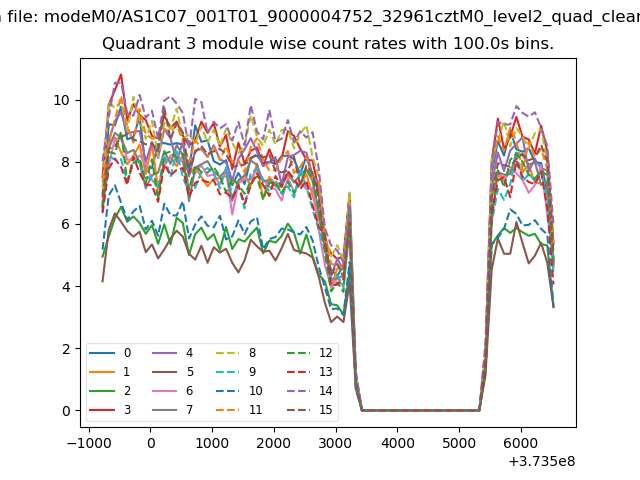
| Quadrant-wise count rates Data is divided into 100 sec bins |
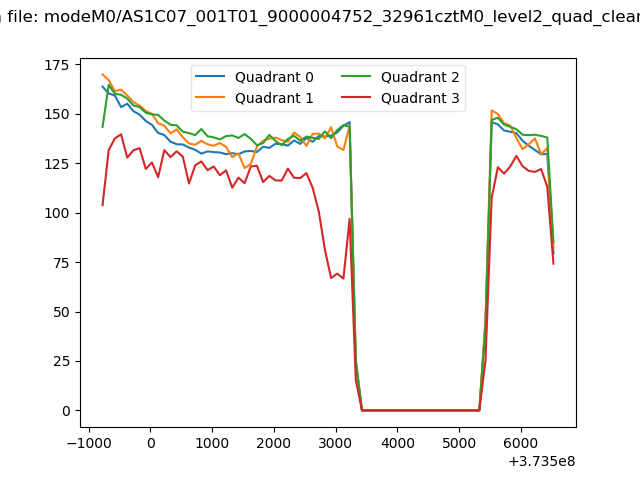 |
|
| Module-wise count rates for Quadrant A Data is divided into 100 sec bins |
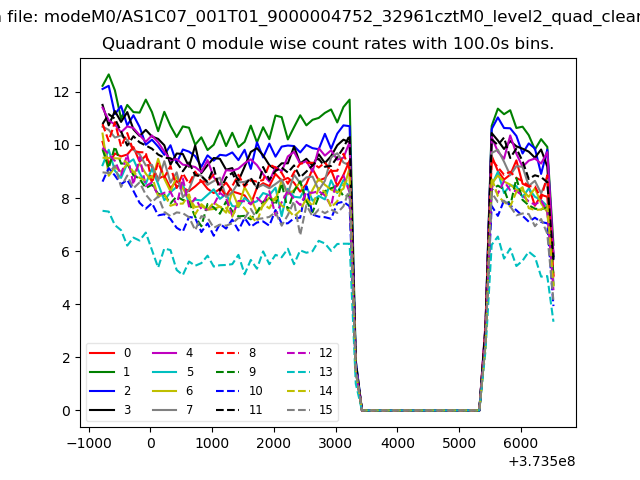 |
 |
| Module-wise count rates for Quadrant B Data is divided into 100 sec bins |
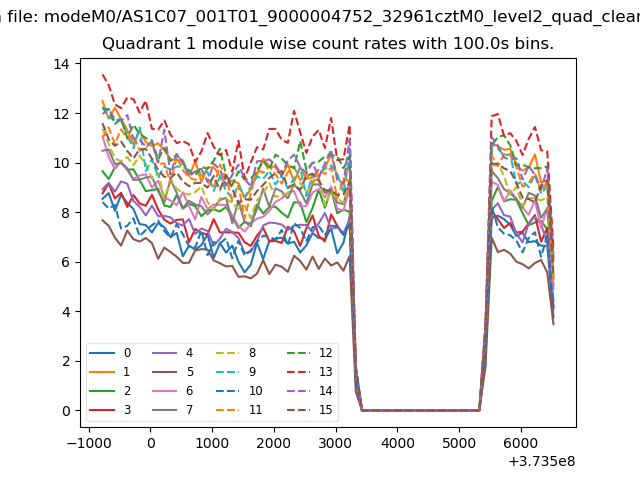 |
 |
| Module-wise count rates for Quadrant C Data is divided into 100 sec bins |
 |
 |
| Module-wise count rates for Quadrant D Data is divided into 100 sec bins |
 |
 |
| Parameter | Plot |
|---|---|
| CZT HV Monitor |  |
| D_VDD | 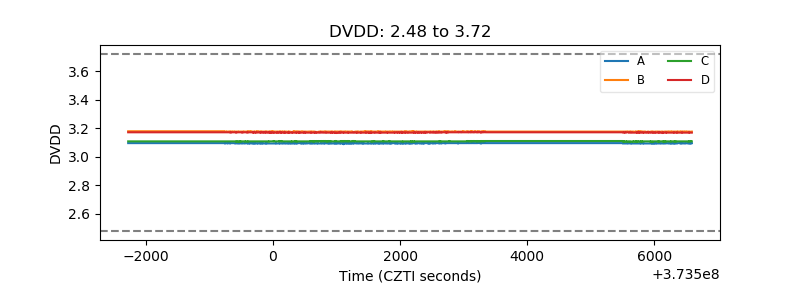 |
| Temperature 1 |  |
| Veto HV Monitor | 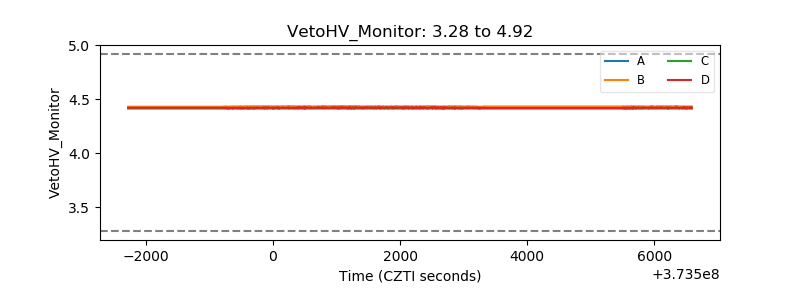 |
| Veto LLD | 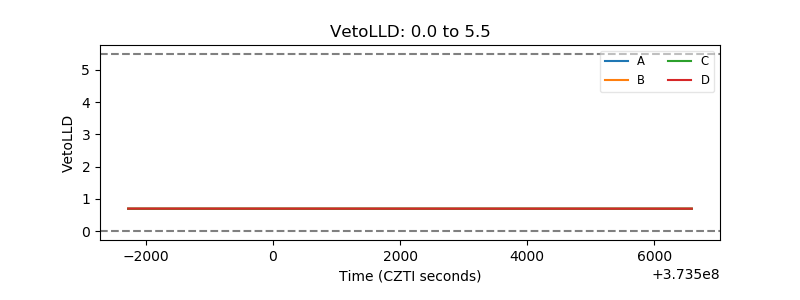 |
| Alpha Counter | 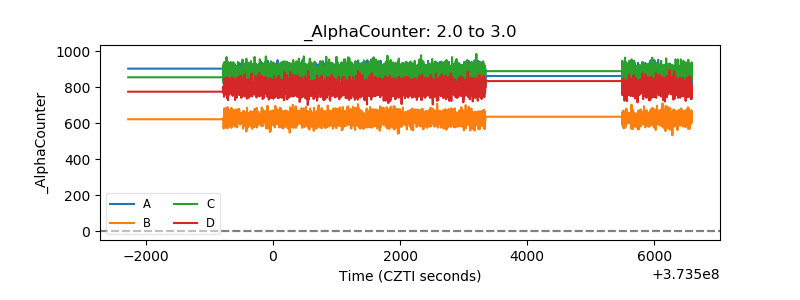 |
| _CPM_Rate | 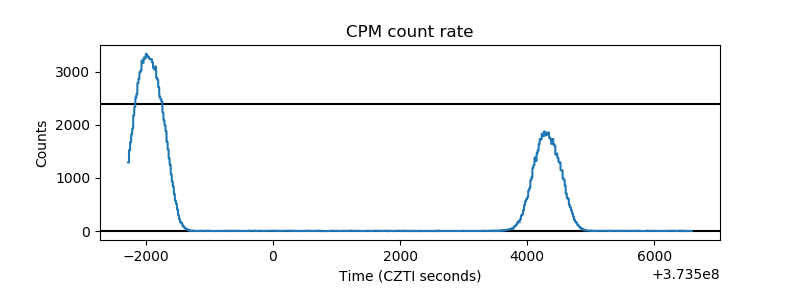 |
| CZT Counter | 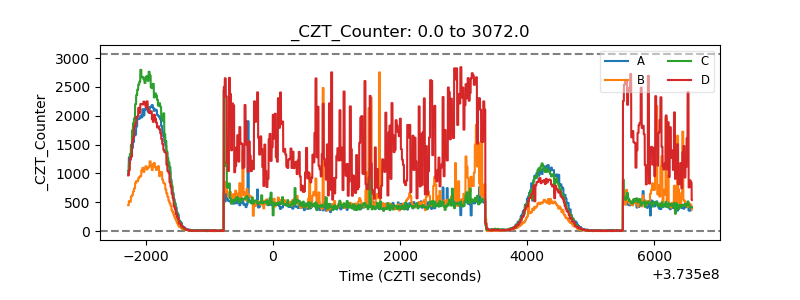 |
| +2.5 Volts monitor |  |
| +5 Volts monitor | 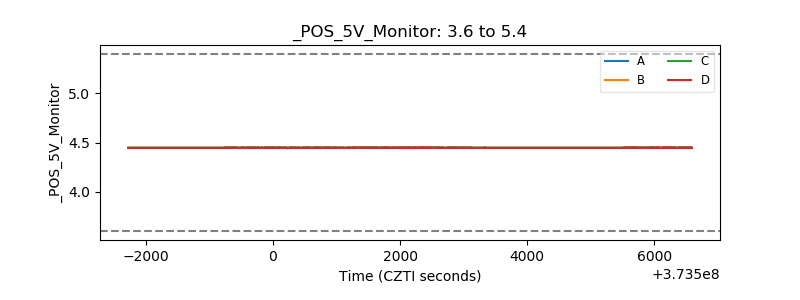 |
| _ROLL_ROT | 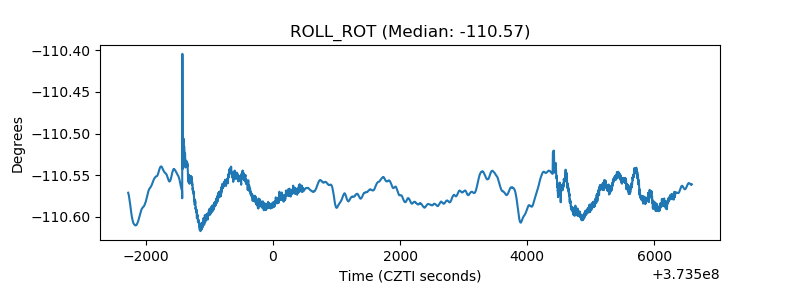 |
| _Roll_DEC | 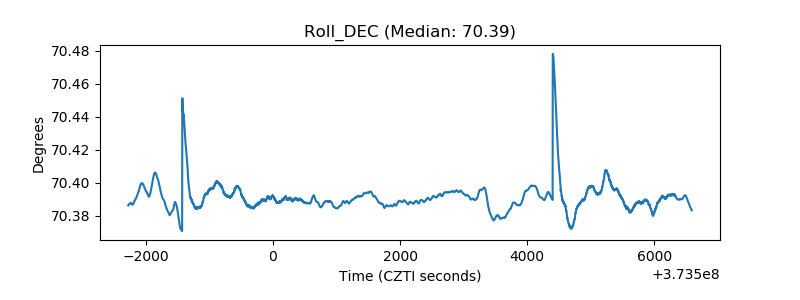 |
| _Roll_RA | 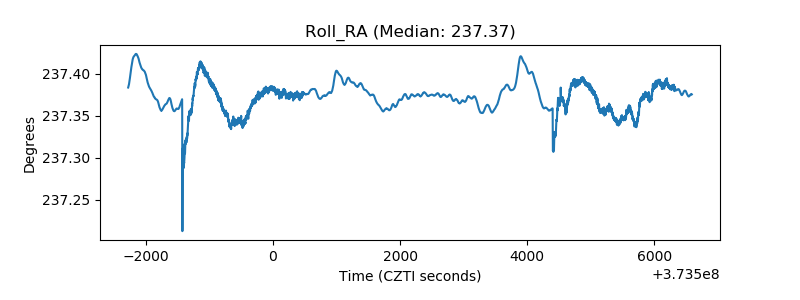 |
| Veto Counter | 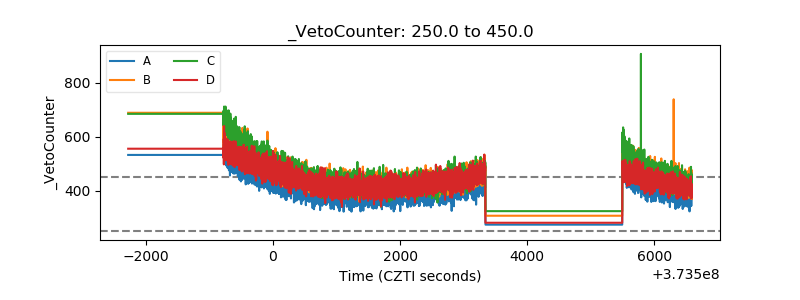 |