| Param | Original file | Final file |
|---|---|---|
| Filename | modeM0/AS1C07_001T01_9000004752_32962cztM0_level2.evt | modeM0/AS1C07_001T01_9000004752_32962cztM0_level2_quad_clean.evt |
| Size (bytes) | 521,418,240 | 99,561,600 |
| Size | 497.3 MB | 94.9 MB |
| Events in quadrant A | 2,322,612 | 682,576 |
| Events in quadrant B | 3,391,795 | 675,384 |
| Events in quadrant C | 2,541,131 | 696,295 |
| Events in quadrant D | 7,183,701 | 596,643 |
| Mode M0 | |||
|---|---|---|---|
| Quadrant | BADHDUFLAG | Total packets | Discarded packets |
| A | 0 | 10475 | 3 |
| B | 0 | 13565 | 2 |
| C | 0 | 11042 | 2 |
| D | 0 | 25024 | 2 |
| Mode SS | |||
|---|---|---|---|
| Quadrant | BADHDUFLAG | Total packets | Discarded packets |
| A | 0 | 106 | 0 |
| B | 0 | 106 | 0 |
| C | 0 | 106 | 0 |
| D | 0 | 106 | 0 |
| Mode M9 | |||
|---|---|---|---|
| Quadrant | BADHDUFLAG | Total packets | Discarded packets |
| A | 0 | 30 | 0 |
| B | 0 | 30 | 0 |
| C | 0 | 30 | 0 |
| D | 0 | 31 | 0 |
| Quadrant | Total seconds | Saturated seconds | Saturation percentage |
|---|---|---|---|
| A | 5196 | 9 | 0.173210% |
| B | 5196 | 290 | 5.581216% |
| C | 5196 | 42 | 0.808314% |
| D | 5196 | 855 | 16.454965% |
Noise dominated data is calculated using 1-second bins in cleaned event files. If a bin has >2000 counts, and if more than 50% of those come from <1% of pixels, then it is considered to be noise-dominated and hence unusable.
| Quadrant | # 1 sec bins | Bins with >0 counts | Bins with >2000 counts | High rate bins dominated by noise | Noise dominated (total time) | Noise dominated (detector-on time) | Marked lightcurve |
|---|---|---|---|---|---|---|---|
| A | 7258 | 5197 | 2 | 2 | 0.03% | 0.04% | 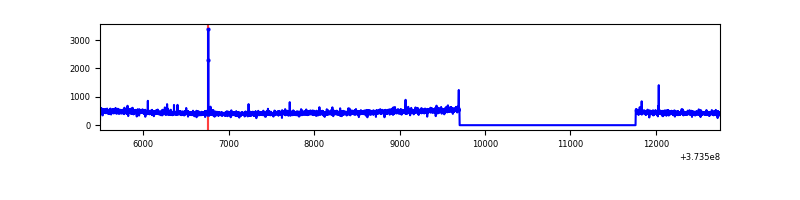 |
| B | 7258 | 5196 | 187 | 187 | 2.58% | 3.60% | 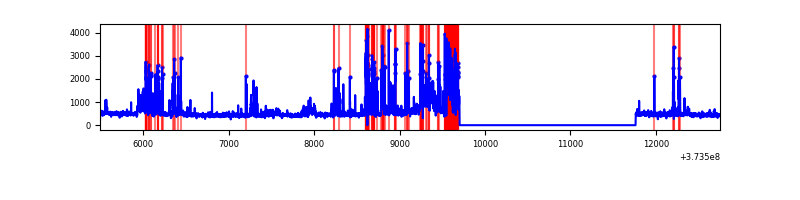 |
| C | 7258 | 5197 | 31 | 31 | 0.43% | 0.60% | 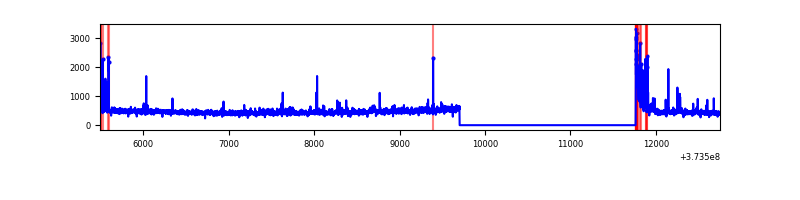 |
| D | 7258 | 5197 | 856 | 856 | 11.79% | 16.47% | 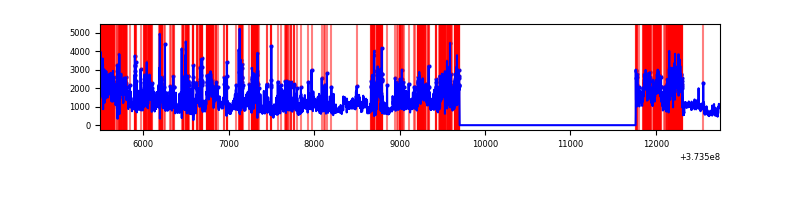 |
Top three noisy pixels from each quadrant. If the there are fewer than three noisy pixels in the level2.evt file, extra rows are filled as -1
| Pixel properties | Quadrant properties | ||||||
|---|---|---|---|---|---|---|---|
| Quadrant | DetID | PixID | Counts | Sigma | Mean | Median | Sigma |
| A | 13 | 6 | 10766 | 85.64 | 594 | 582 | 118.9 |
| A | 13 | 254 | 8782 | 68.96 | 594 | 582 | 118.9 |
| A | 0 | 254 | 8021 | 62.56 | 594 | 582 | 118.9 |
| B | 5 | 172 | 666980 | 6059.99 | 584 | 569 | 110.0 |
| B | 5 | 200 | 173066 | 1568.6 | 584 | 569 | 110.0 |
| B | 0 | 199 | 66635 | 600.77 | 584 | 569 | 110.0 |
| C | 0 | 10 | 164801 | 1226.18 | 582 | 587 | 133.9 |
| C | 14 | 67 | 46003 | 339.12 | 582 | 587 | 133.9 |
| C | 1 | 241 | 29381 | 215.0 | 582 | 587 | 133.9 |
| D | 12 | 227 | 1460478 | 10304.97 | 541 | 530 | 141.7 |
| D | 8 | 195 | 1451496 | 10241.57 | 541 | 530 | 141.7 |
| D | 7 | 223 | 512957 | 3616.94 | 541 | 530 | 141.7 |
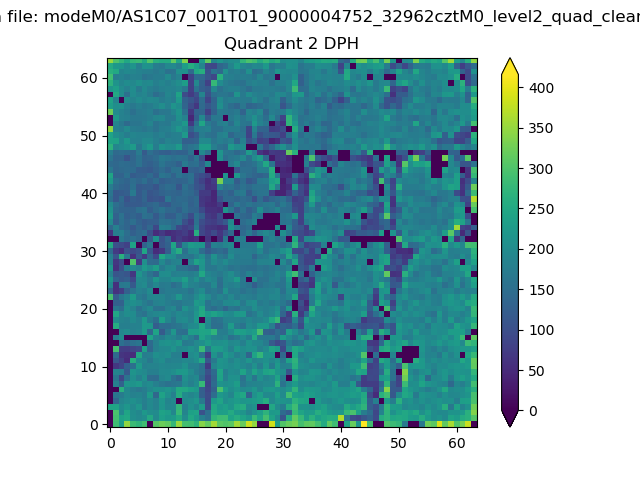
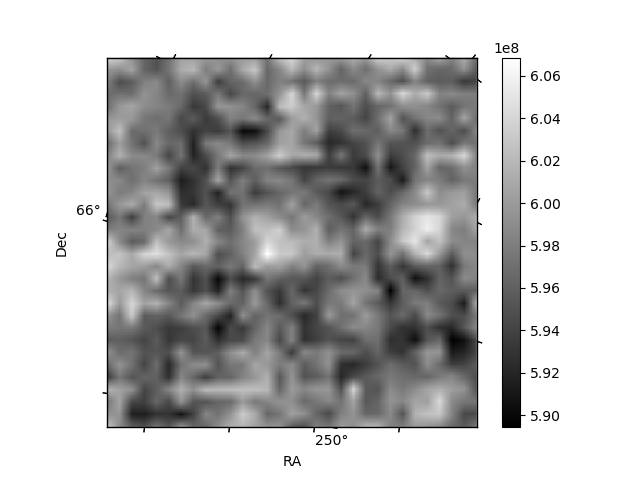
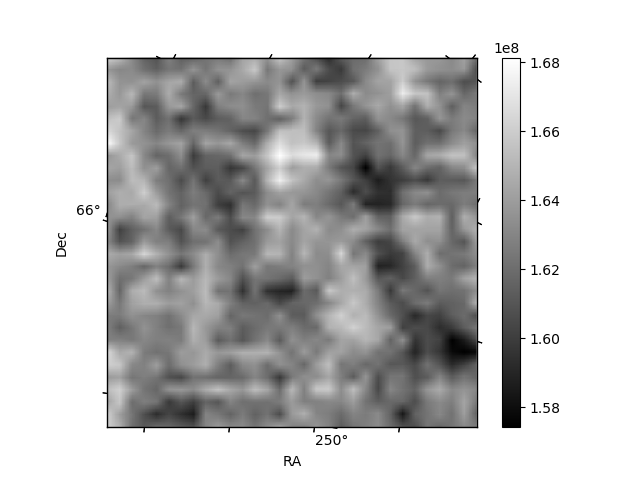
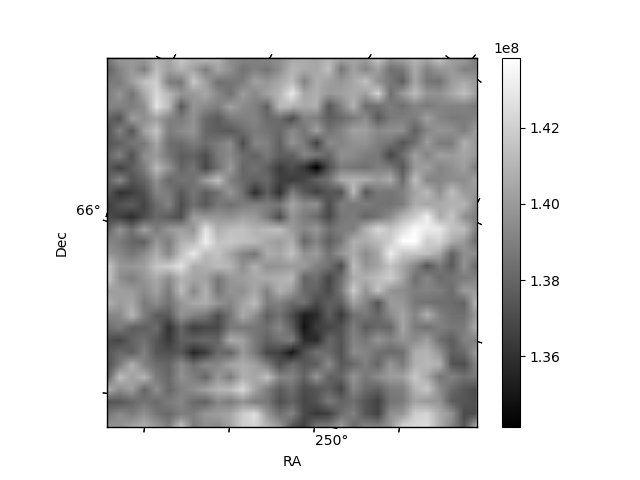
Histogram calculated using DETX and DETY for each event in the final _common_clean file
| Quadrant A | 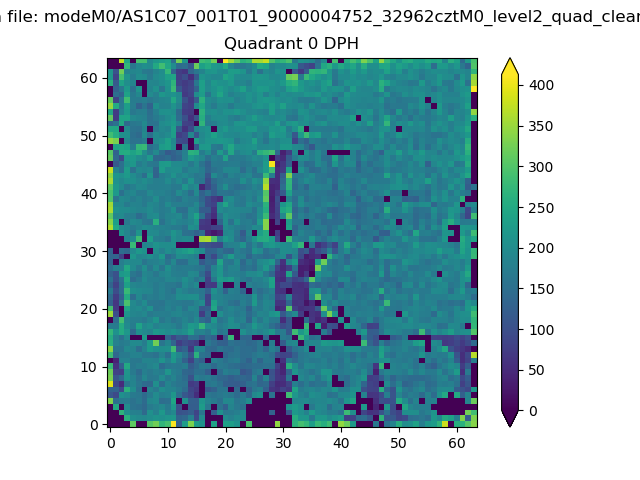 |
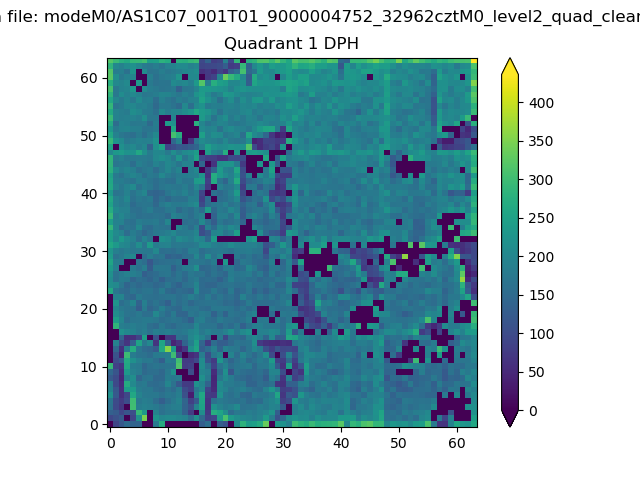 |
Quadrant B |
|---|---|---|---|
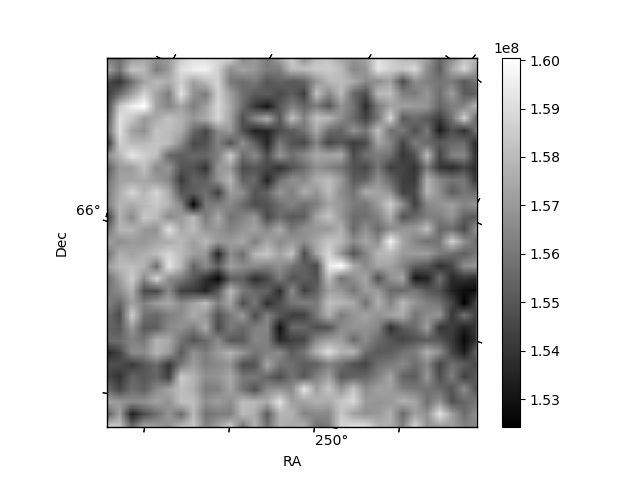
| Quadrant D | 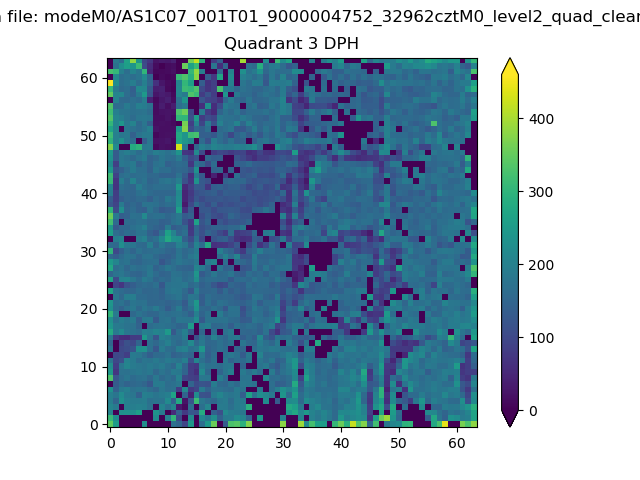 |
 |
Quadrant C |
| Plot type | Count rate plots | Images |
|---|---|---|
| Comparison with Poisson distribution Blue bars denote a histogram of data divided into 1 sec bins. Red curve is a Poisson curve with rate = median count rate of data. |
 |
 |
| Quadrant-wise count rates Data is divided into 100 sec bins |
 |
|
| Module-wise count rates for Quadrant A Data is divided into 100 sec bins |
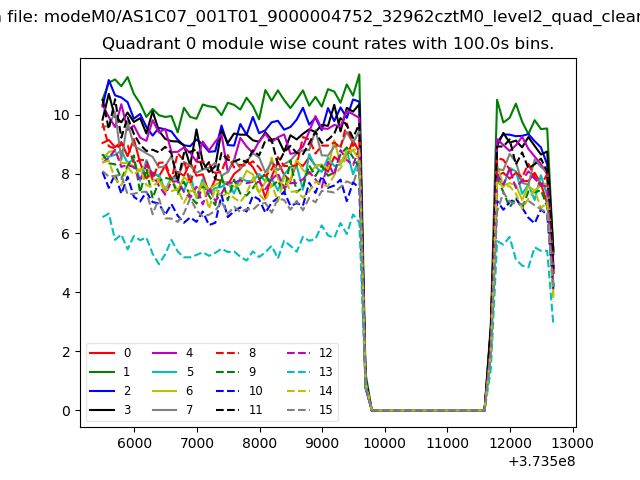 |
 |
| Module-wise count rates for Quadrant B Data is divided into 100 sec bins |
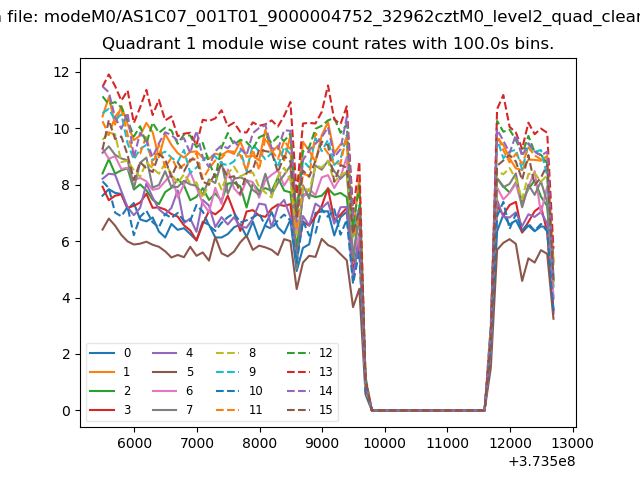 |
 |
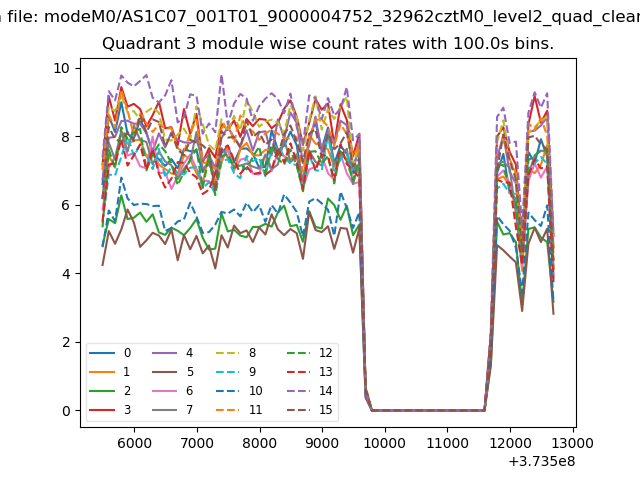
| Module-wise count rates for Quadrant C Data is divided into 100 sec bins |
 |
 |
| Module-wise count rates for Quadrant D Data is divided into 100 sec bins |
 |
 |
| Parameter | Plot |
|---|---|
| CZT HV Monitor |  |
| D_VDD | 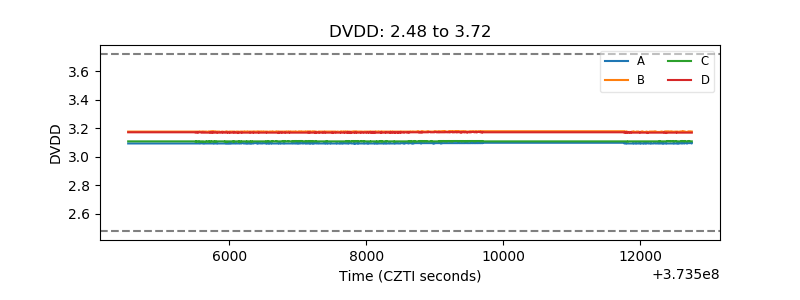 |
| Temperature 1 | 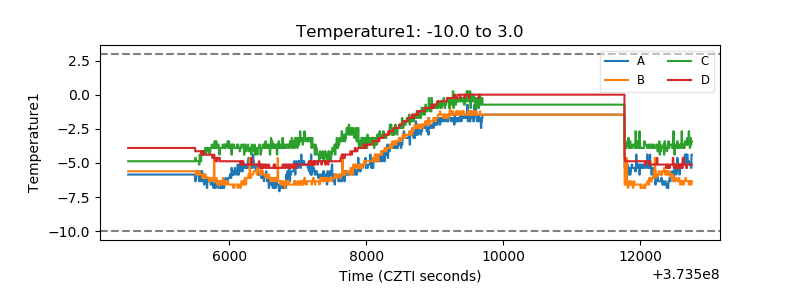 |
| Veto HV Monitor | 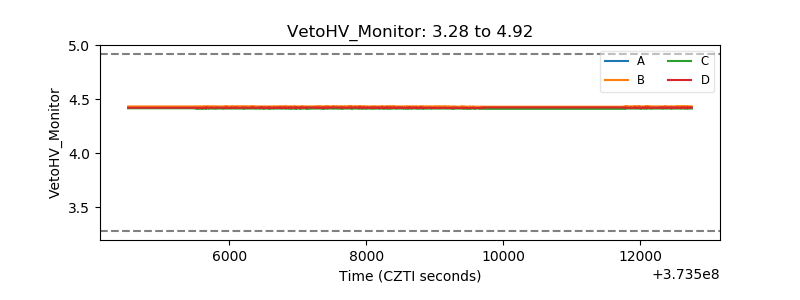 |
| Veto LLD | 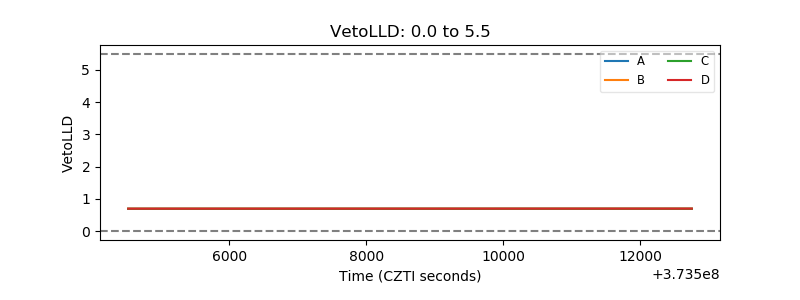 |
| Alpha Counter | 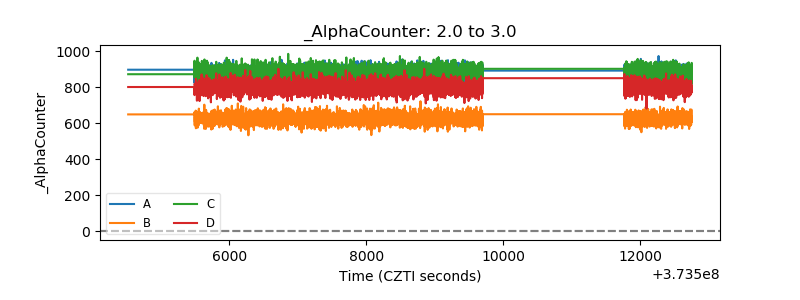 |
| _CPM_Rate | 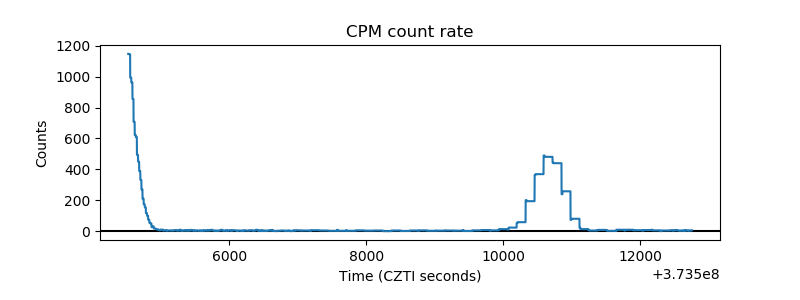 |
| CZT Counter | 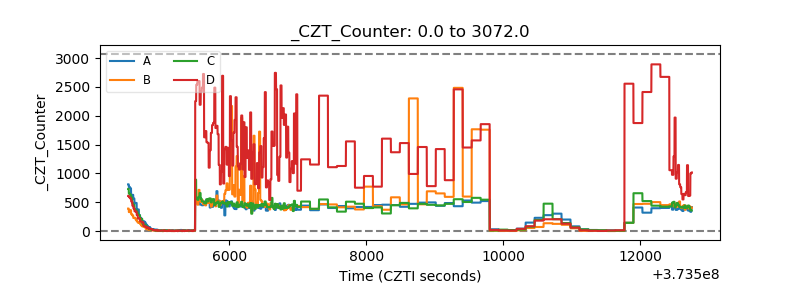 |
| +2.5 Volts monitor |  |
| +5 Volts monitor |  |
| _ROLL_ROT | 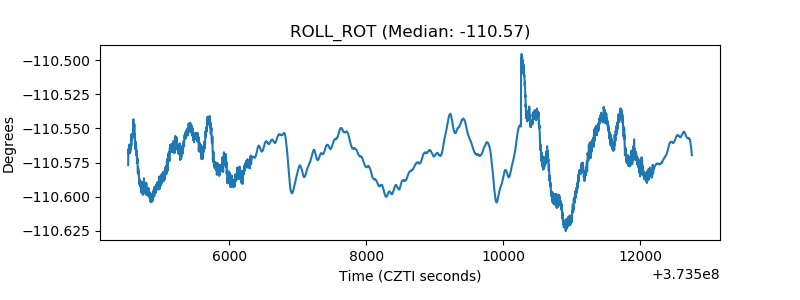 |
| _Roll_DEC | 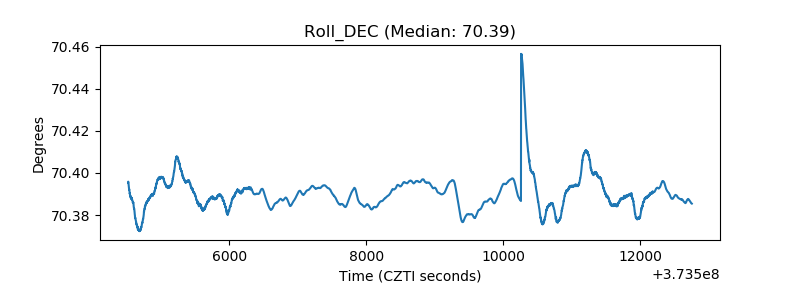 |
| _Roll_RA | 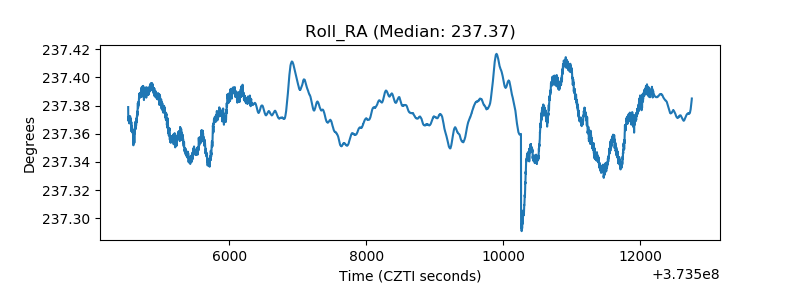 |
| Veto Counter | 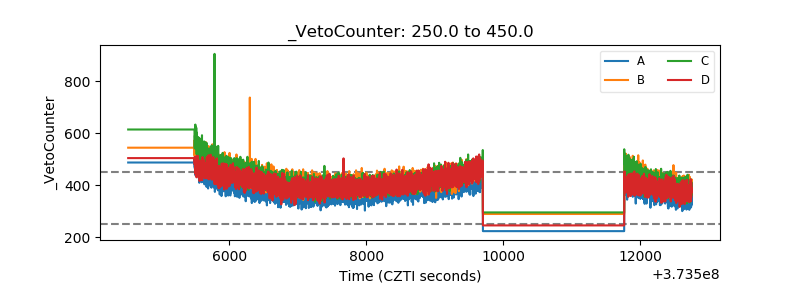 |