| Param | Original file | Final file |
|---|---|---|
| Filename | modeM0/AS1C07_001T01_9000004752_32963cztM0_level2.evt | modeM0/AS1C07_001T01_9000004752_32963cztM0_level2_quad_clean.evt |
| Size (bytes) | 544,501,440 | 98,300,160 |
| Size | 519.3 MB | 93.7 MB |
| Events in quadrant A | 2,359,731 | 678,026 |
| Events in quadrant B | 4,131,394 | 644,668 |
| Events in quadrant C | 2,696,088 | 685,329 |
| Events in quadrant D | 6,939,189 | 592,293 |
| Mode M0 | |||
|---|---|---|---|
| Quadrant | BADHDUFLAG | Total packets | Discarded packets |
| A | 0 | 10799 | 3 |
| B | 0 | 16028 | 2 |
| C | 0 | 11739 | 2 |
| D | 0 | 24494 | 2 |
| Mode SS | |||
|---|---|---|---|
| Quadrant | BADHDUFLAG | Total packets | Discarded packets |
| A | 0 | 108 | 0 |
| B | 0 | 108 | 0 |
| C | 0 | 108 | 0 |
| D | 0 | 108 | 0 |
| Mode M9 | |||
|---|---|---|---|
| Quadrant | BADHDUFLAG | Total packets | Discarded packets |
| A | 0 | 35 | 0 |
| B | 0 | 35 | 0 |
| C | 0 | 35 | 0 |
| D | 0 | 36 | 0 |
| Quadrant | Total seconds | Saturated seconds | Saturation percentage |
|---|---|---|---|
| A | 5380 | 6 | 0.111524% |
| B | 5380 | 650 | 12.081784% |
| C | 5380 | 58 | 1.078067% |
| D | 5380 | 849 | 15.780669% |
Noise dominated data is calculated using 1-second bins in cleaned event files. If a bin has >2000 counts, and if more than 50% of those come from <1% of pixels, then it is considered to be noise-dominated and hence unusable.
| Quadrant | # 1 sec bins | Bins with >0 counts | Bins with >2000 counts | High rate bins dominated by noise | Noise dominated (total time) | Noise dominated (detector-on time) | Marked lightcurve |
|---|---|---|---|---|---|---|---|
| A | 7203 | 5381 | 0 | 0 | 0.00% | 0.00% | 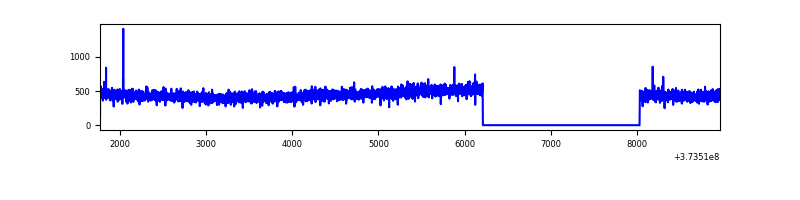 |
| B | 7203 | 5380 | 419 | 419 | 5.82% | 7.79% | 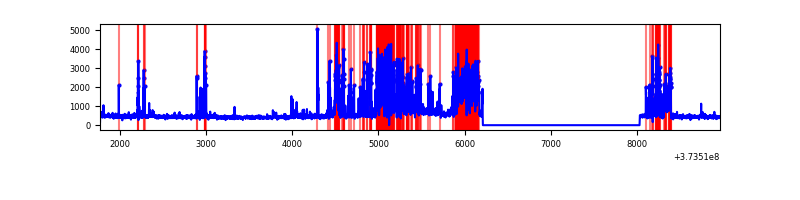 |
| C | 7203 | 5381 | 45 | 45 | 0.62% | 0.84% | 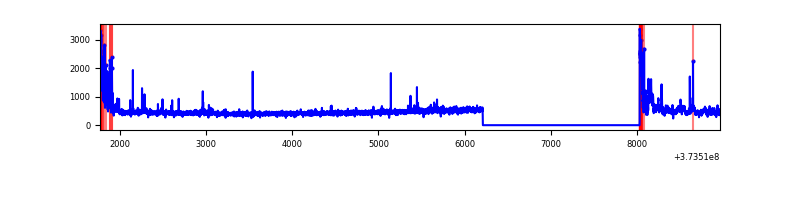 |
| D | 7203 | 5381 | 770 | 770 | 10.69% | 14.31% | 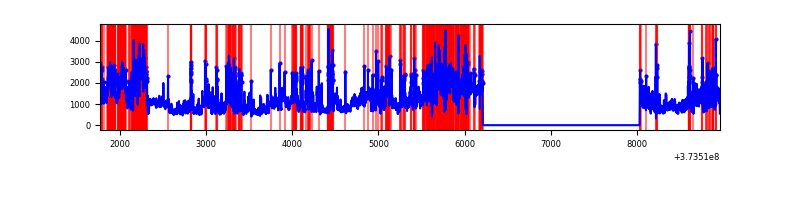 |
Top three noisy pixels from each quadrant. If the there are fewer than three noisy pixels in the level2.evt file, extra rows are filled as -1
| Pixel properties | Quadrant properties | ||||||
|---|---|---|---|---|---|---|---|
| Quadrant | DetID | PixID | Counts | Sigma | Mean | Median | Sigma |
| A | 13 | 6 | 15153 | 120.44 | 605 | 593 | 120.9 |
| A | 13 | 254 | 9148 | 70.77 | 605 | 593 | 120.9 |
| A | 3 | 137 | 5472 | 40.36 | 605 | 593 | 120.9 |
| B | 5 | 172 | 1466443 | 13444.6 | 572 | 558 | 109.0 |
| B | 0 | 219 | 107628 | 982.01 | 572 | 558 | 109.0 |
| B | 0 | 199 | 94660 | 863.07 | 572 | 558 | 109.0 |
| C | 0 | 10 | 303514 | 2227.02 | 587 | 592 | 136.0 |
| C | 1 | 241 | 32560 | 235.02 | 587 | 592 | 136.0 |
| C | 14 | 67 | 24072 | 172.62 | 587 | 592 | 136.0 |
| D | 8 | 195 | 1580959 | 11000.03 | 548 | 535 | 143.7 |
| D | 12 | 227 | 1403501 | 9764.89 | 548 | 535 | 143.7 |
| D | 7 | 223 | 371607 | 2582.73 | 548 | 535 | 143.7 |
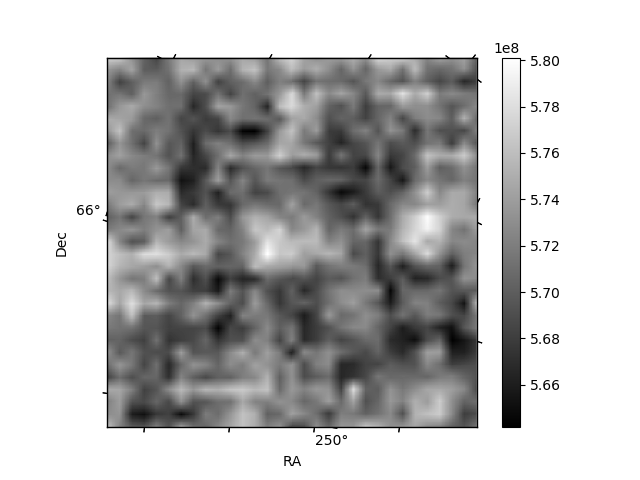
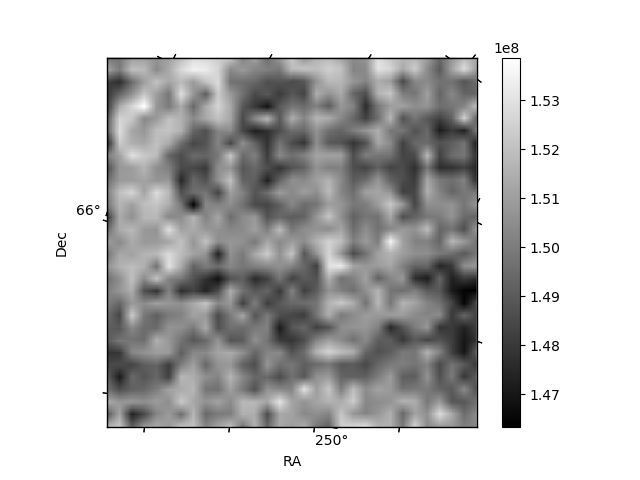
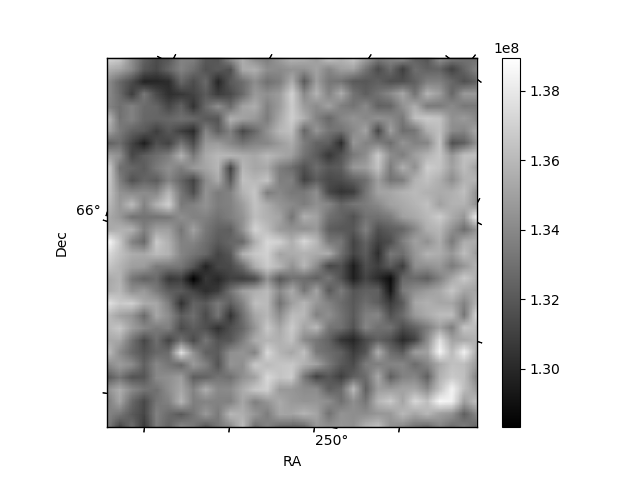
Histogram calculated using DETX and DETY for each event in the final _common_clean file
| Quadrant A | 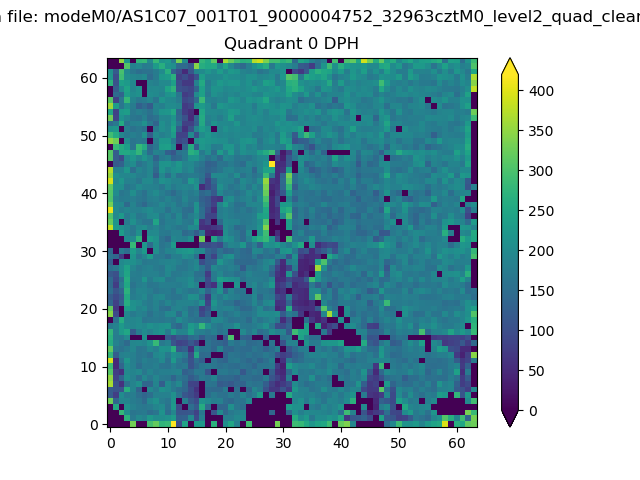 |
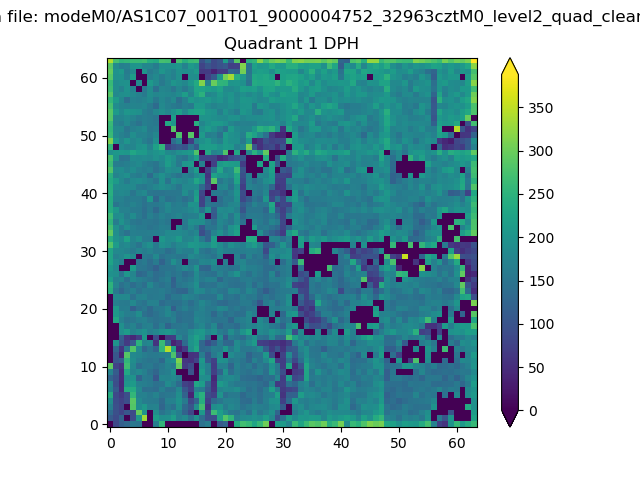 |
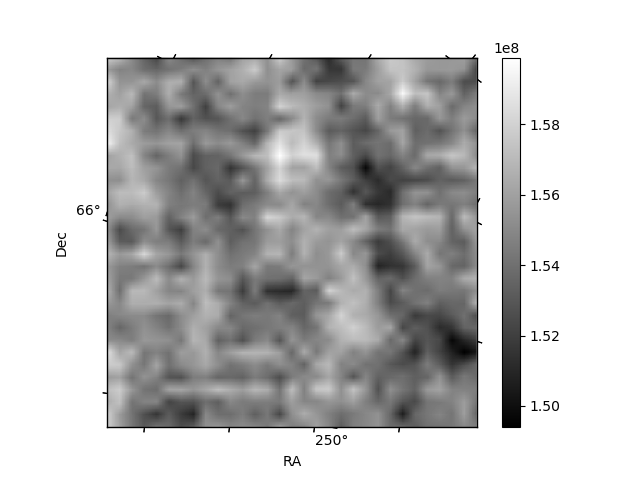
Quadrant B |
|---|---|---|---|
| Quadrant D | 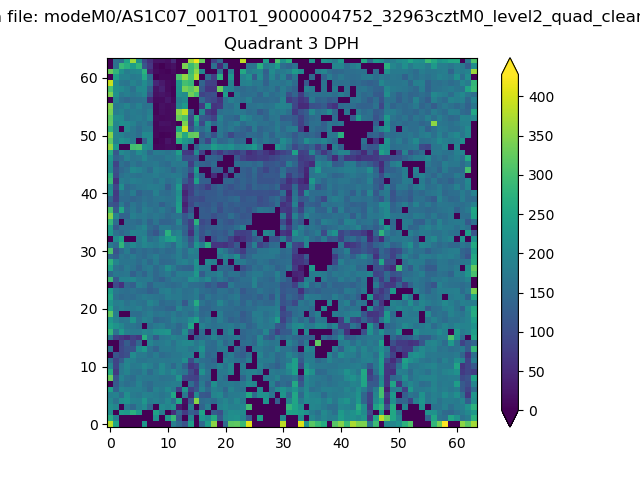 |
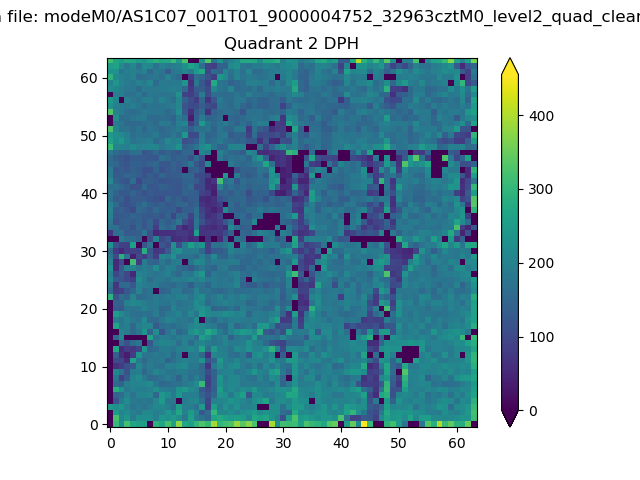 |
Quadrant C |
| Plot type | Count rate plots | Images |
|---|---|---|
| Comparison with Poisson distribution Blue bars denote a histogram of data divided into 1 sec bins. Red curve is a Poisson curve with rate = median count rate of data. |
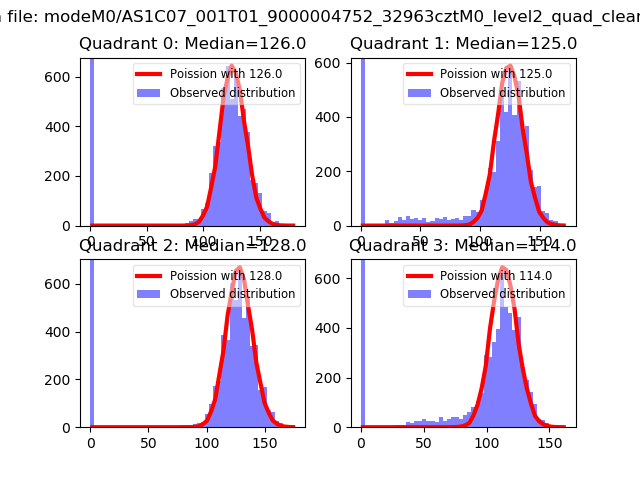 |
 |
| Quadrant-wise count rates Data is divided into 100 sec bins |
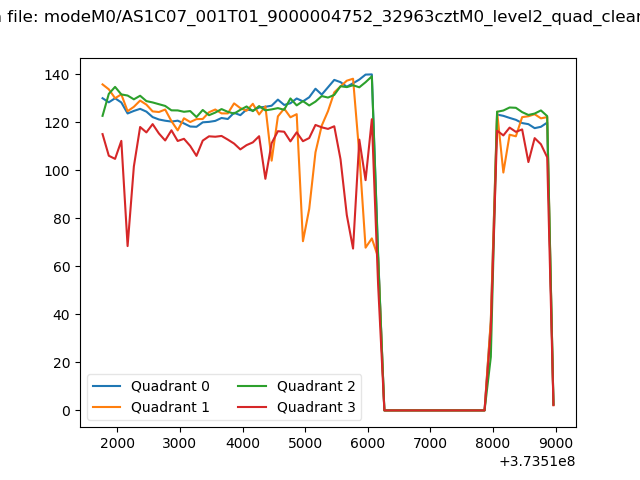 |
|
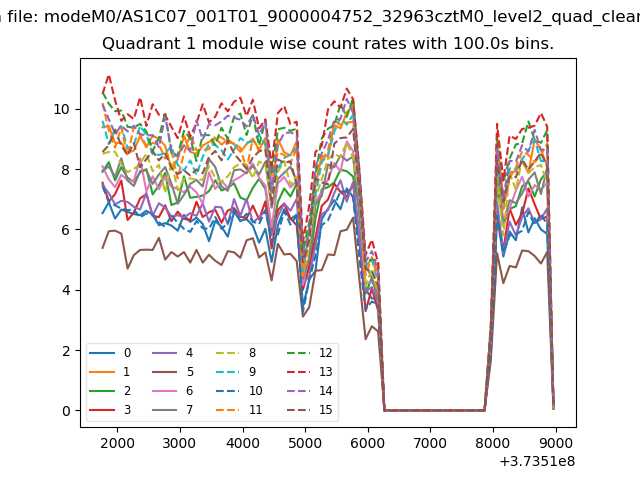
| Module-wise count rates for Quadrant A Data is divided into 100 sec bins |
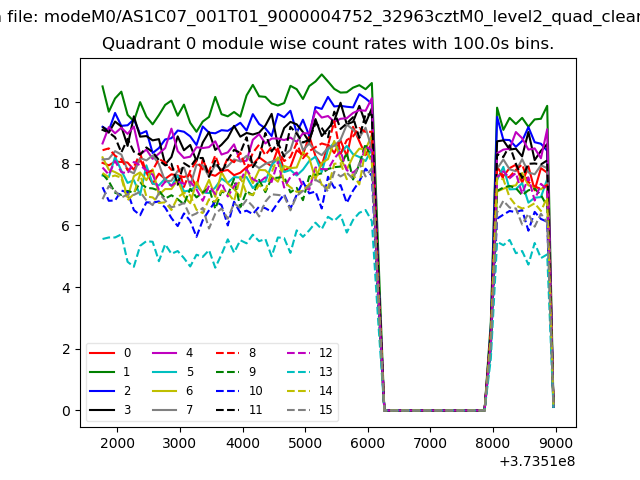 |
 |
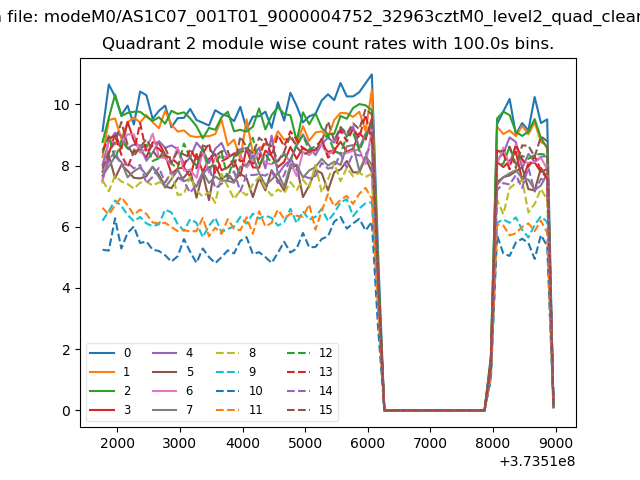
| Module-wise count rates for Quadrant B Data is divided into 100 sec bins |
 |
 |
| Module-wise count rates for Quadrant C Data is divided into 100 sec bins |
 |
 |
| Module-wise count rates for Quadrant D Data is divided into 100 sec bins |
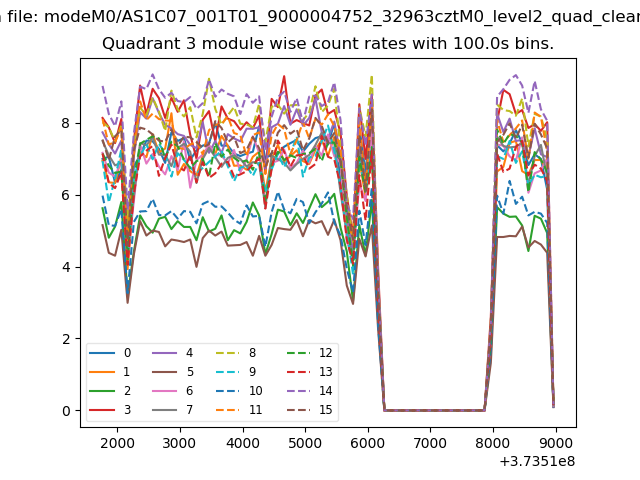 |
 |
| Parameter | Plot |
|---|---|
| CZT HV Monitor | 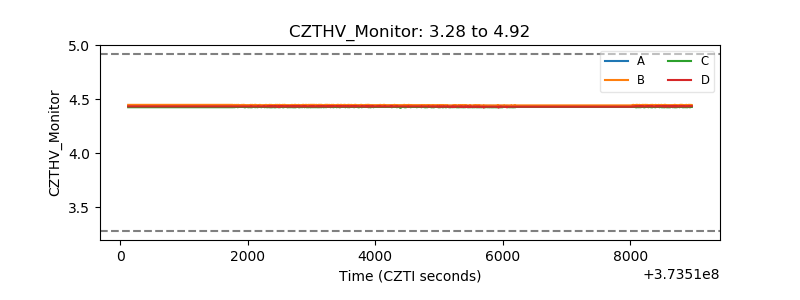 |
| D_VDD | 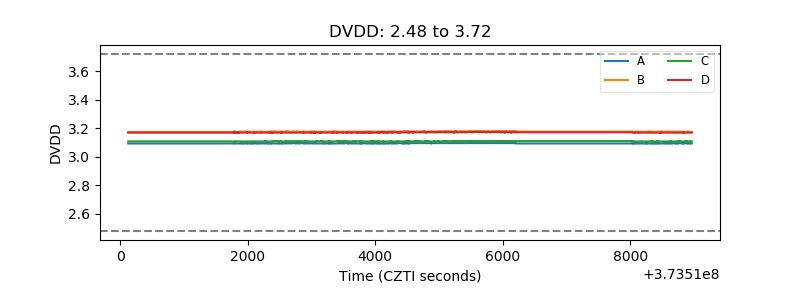 |
| Temperature 1 | 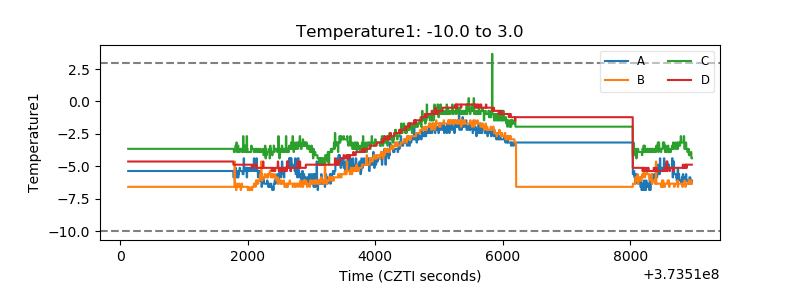 |
| Veto HV Monitor | 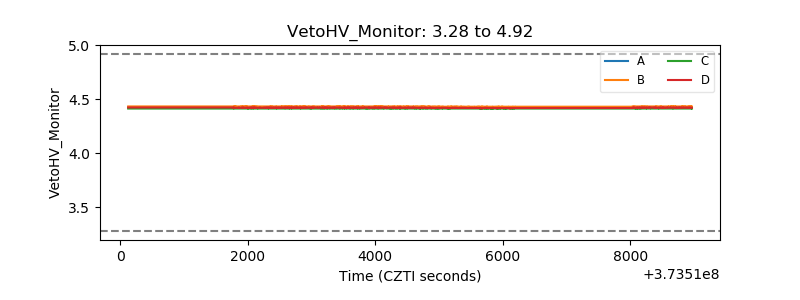 |
| Veto LLD | 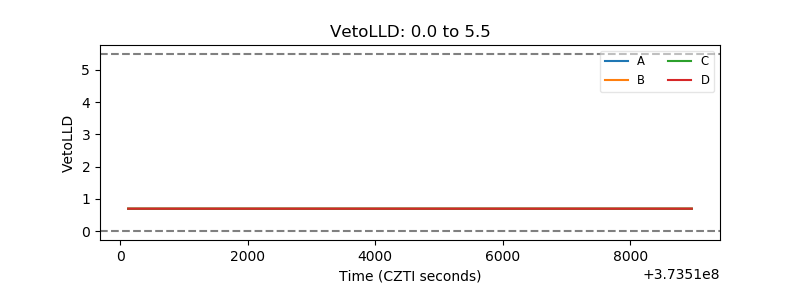 |
| Alpha Counter | 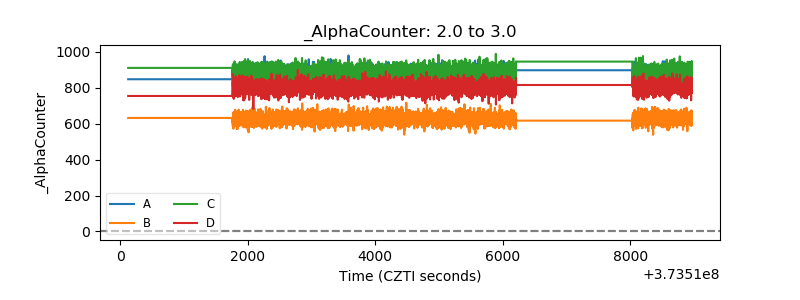 |
| _CPM_Rate | 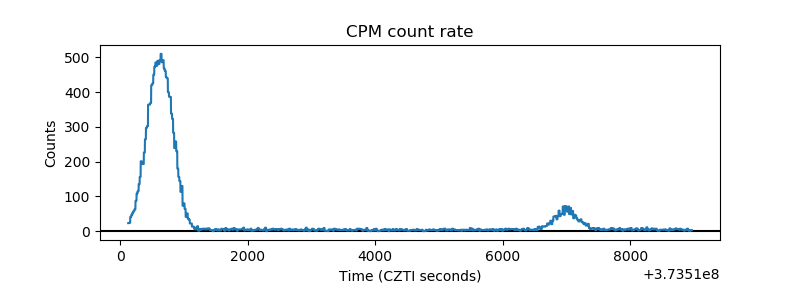 |
| CZT Counter | 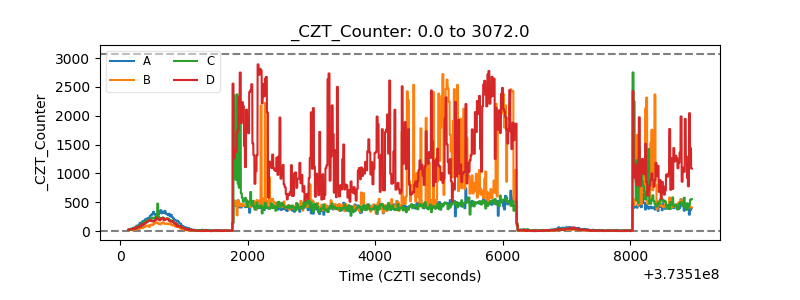 |
| +2.5 Volts monitor | 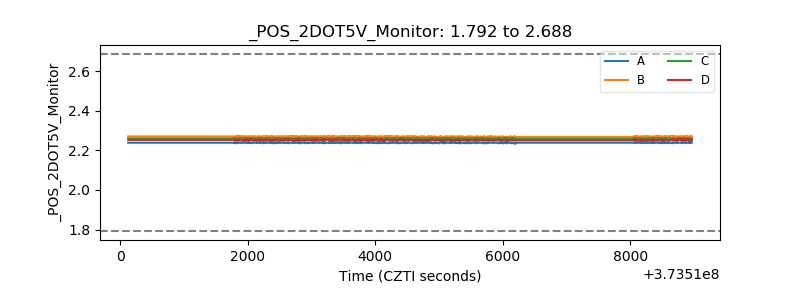 |
| +5 Volts monitor | 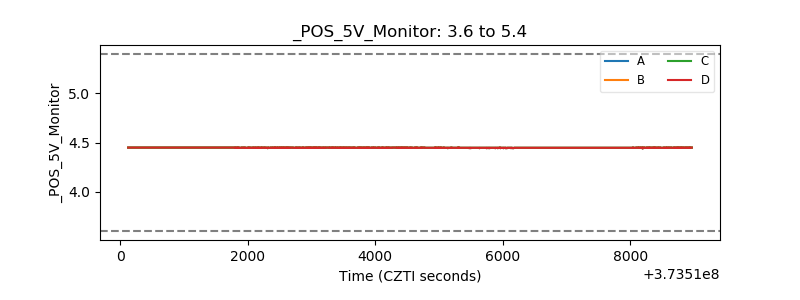 |
| _ROLL_ROT | 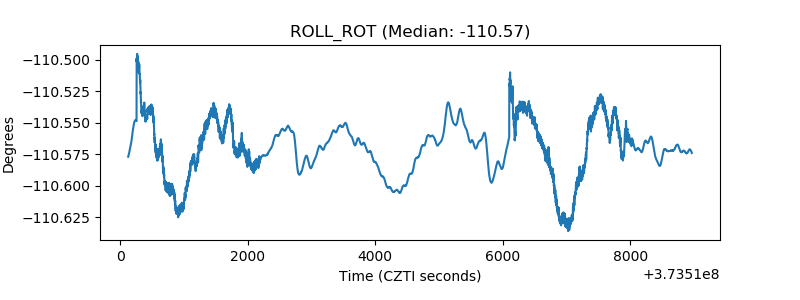 |
| _Roll_DEC | 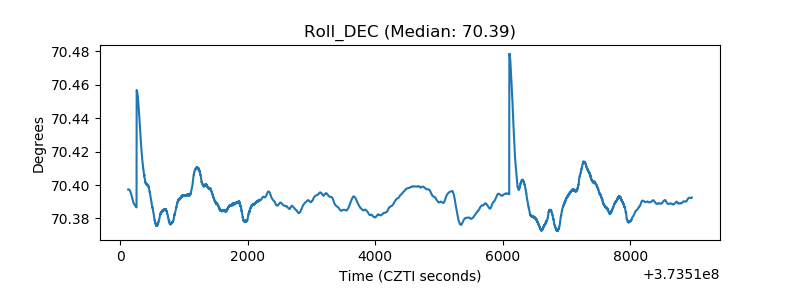 |
| _Roll_RA | 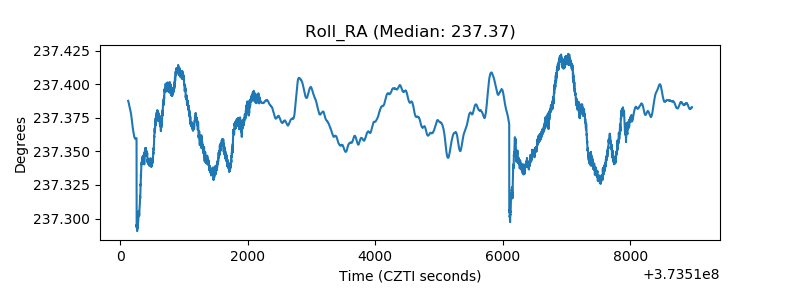 |
| Veto Counter | 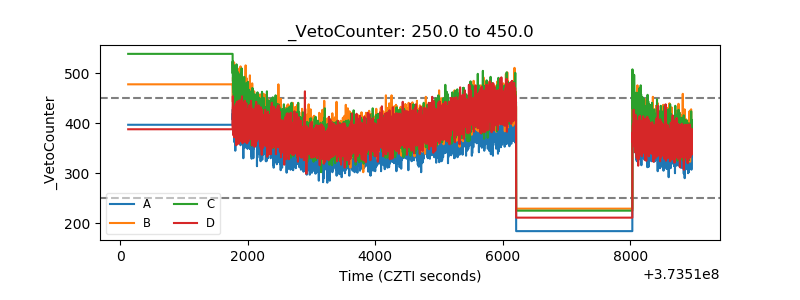 |