| Param | Original file | Final file |
|---|---|---|
| Filename | modeM0/AS1C07_001T01_9000004752_32965cztM0_level2.evt | modeM0/AS1C07_001T01_9000004752_32965cztM0_level2_quad_clean.evt |
| Size (bytes) | 552,047,040 | 106,058,880 |
| Size | 526.5 MB | 101.1 MB |
| Events in quadrant A | 2,615,533 | 726,346 |
| Events in quadrant B | 3,733,246 | 721,640 |
| Events in quadrant C | 3,436,998 | 708,465 |
| Events in quadrant D | 6,535,213 | 644,829 |
| Mode M0 | |||
|---|---|---|---|
| Quadrant | BADHDUFLAG | Total packets | Discarded packets |
| A | 0 | 11847 | 3 |
| B | 0 | 15091 | 2 |
| C | 0 | 14285 | 2 |
| D | 0 | 23649 | 2 |
| Mode SS | |||
|---|---|---|---|
| Quadrant | BADHDUFLAG | Total packets | Discarded packets |
| A | 0 | 120 | 0 |
| B | 0 | 120 | 0 |
| C | 0 | 120 | 0 |
| D | 0 | 120 | 0 |
| Mode M9 | |||
|---|---|---|---|
| Quadrant | BADHDUFLAG | Total packets | Discarded packets |
| A | 0 | 26 | 0 |
| B | 0 | 26 | 0 |
| C | 0 | 26 | 0 |
| D | 0 | 27 | 0 |
| Quadrant | Total seconds | Saturated seconds | Saturation percentage |
|---|---|---|---|
| A | 5874 | 7 | 0.119169% |
| B | 5874 | 225 | 3.830439% |
| C | 5874 | 253 | 4.307116% |
| D | 5874 | 591 | 10.061287% |
Noise dominated data is calculated using 1-second bins in cleaned event files. If a bin has >2000 counts, and if more than 50% of those come from <1% of pixels, then it is considered to be noise-dominated and hence unusable.
| Quadrant | # 1 sec bins | Bins with >0 counts | Bins with >2000 counts | High rate bins dominated by noise | Noise dominated (total time) | Noise dominated (detector-on time) | Marked lightcurve |
|---|---|---|---|---|---|---|---|
| A | 7186 | 5875 | 2 | 2 | 0.03% | 0.03% | 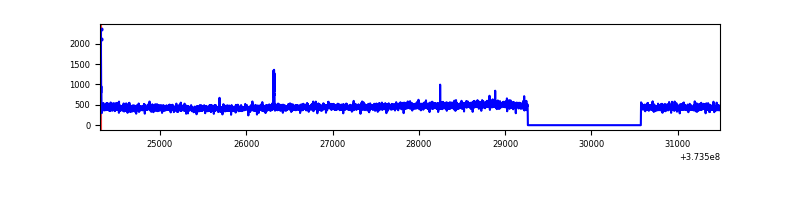 |
| B | 7186 | 5875 | 141 | 141 | 1.96% | 2.40% | 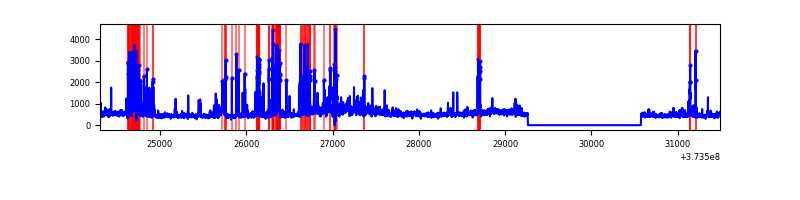 |
| C | 7186 | 5875 | 202 | 202 | 2.81% | 3.44% | 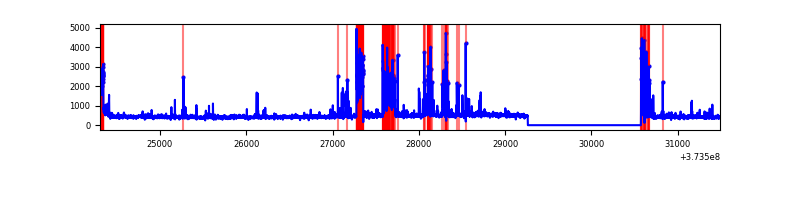 |
| D | 7186 | 5875 | 485 | 485 | 6.75% | 8.26% | 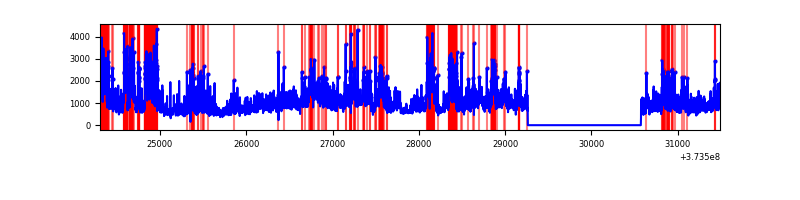 |
Top three noisy pixels from each quadrant. If the there are fewer than three noisy pixels in the level2.evt file, extra rows are filled as -1
| Pixel properties | Quadrant properties | ||||||
|---|---|---|---|---|---|---|---|
| Quadrant | DetID | PixID | Counts | Sigma | Mean | Median | Sigma |
| A | 14 | 238 | 17913 | 129.85 | 665 | 652 | 132.9 |
| A | 12 | 227 | 13268 | 94.91 | 665 | 652 | 132.9 |
| A | 13 | 254 | 10556 | 74.5 | 665 | 652 | 132.9 |
| B | 5 | 172 | 602486 | 4882.1 | 654 | 638 | 123.3 |
| B | 0 | 219 | 220274 | 1781.65 | 654 | 638 | 123.3 |
| B | 5 | 200 | 93362 | 752.16 | 654 | 638 | 123.3 |
| C | 1 | 241 | 600347 | 4115.49 | 631 | 634 | 145.7 |
| C | 0 | 10 | 318381 | 2180.52 | 631 | 634 | 145.7 |
| C | 3 | 233 | 21474 | 143.01 | 631 | 634 | 145.7 |
| D | 8 | 195 | 1226177 | 7671.41 | 616 | 603 | 159.8 |
| D | 2 | 250 | 673215 | 4210.18 | 616 | 603 | 159.8 |
| D | 7 | 223 | 634453 | 3967.55 | 616 | 603 | 159.8 |
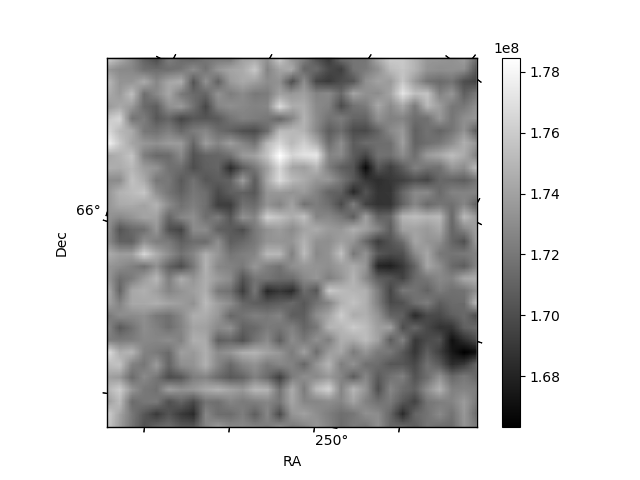
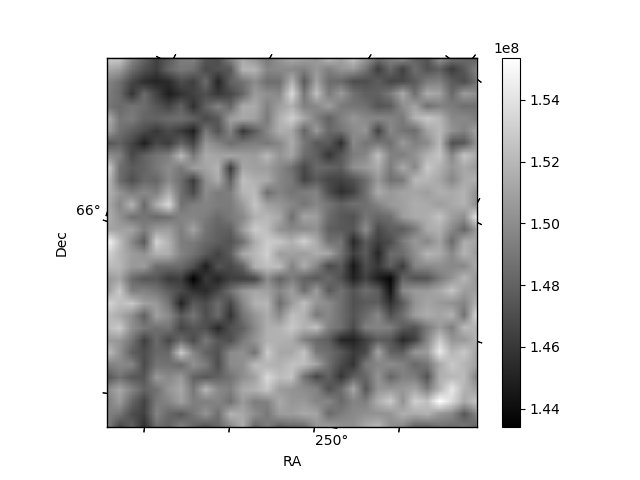
Histogram calculated using DETX and DETY for each event in the final _common_clean file
| Quadrant A | 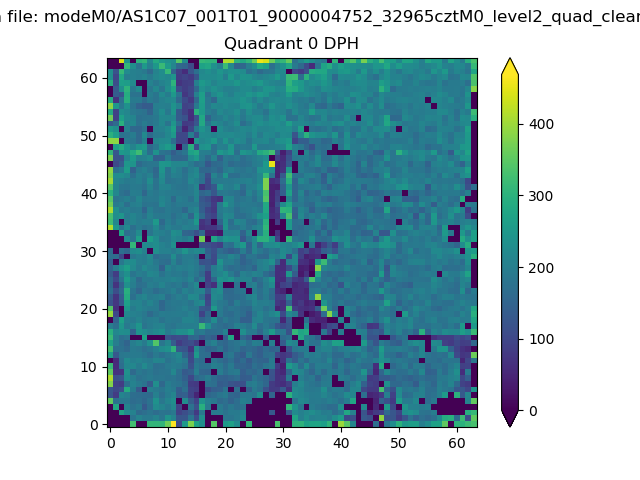 |
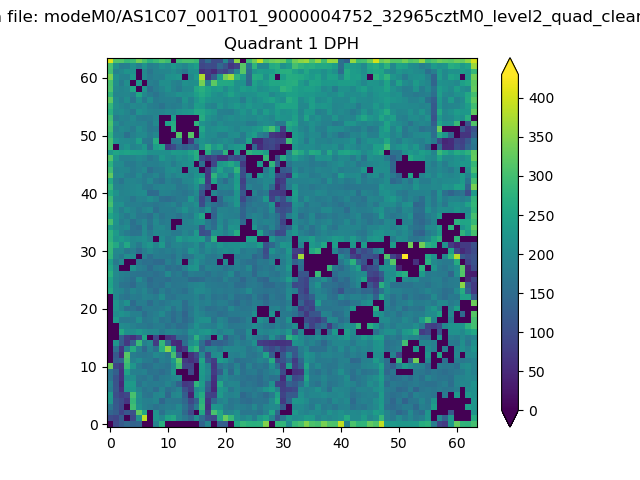 |
Quadrant B |
|---|---|---|---|
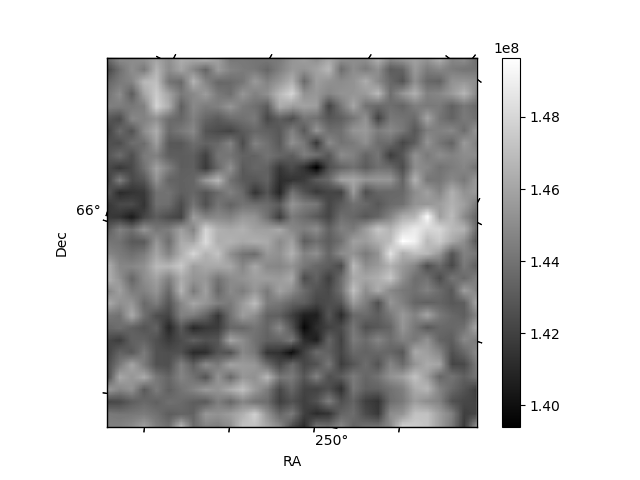
| Quadrant D | 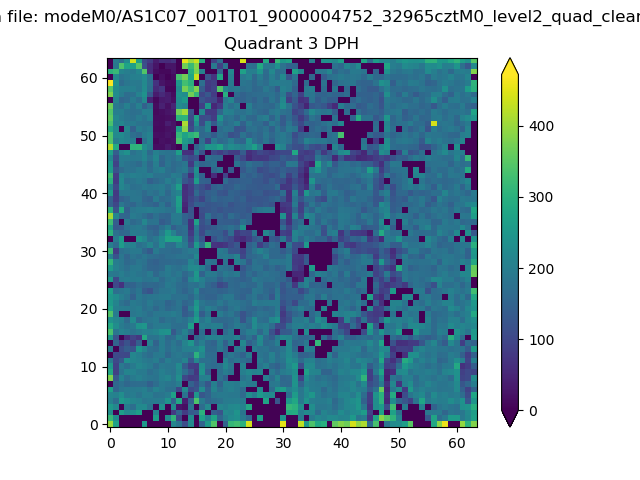 |
 |
Quadrant C |
| Plot type | Count rate plots | Images |
|---|---|---|
| Comparison with Poisson distribution Blue bars denote a histogram of data divided into 1 sec bins. Red curve is a Poisson curve with rate = median count rate of data. |
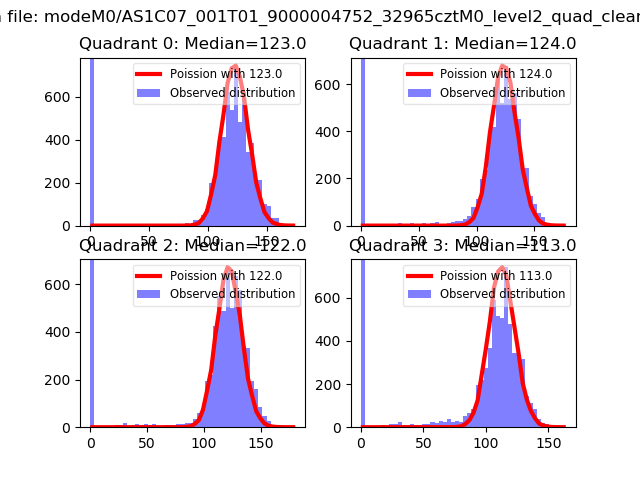 |
 |
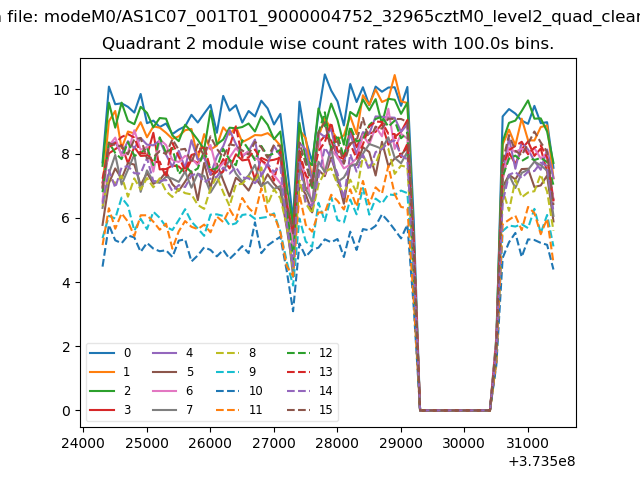
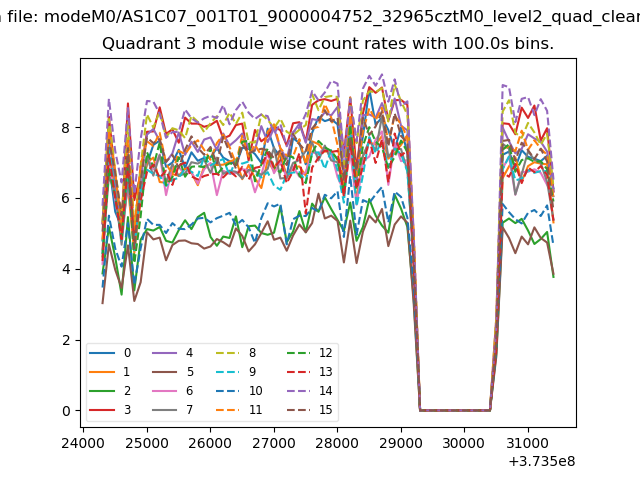
| Quadrant-wise count rates Data is divided into 100 sec bins |
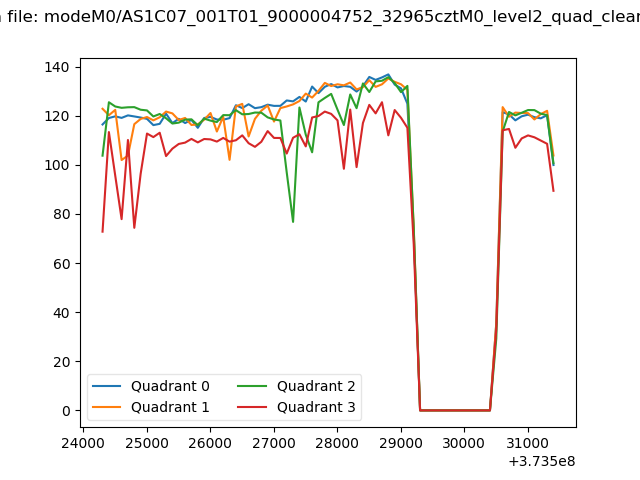 |
|
| Module-wise count rates for Quadrant A Data is divided into 100 sec bins |
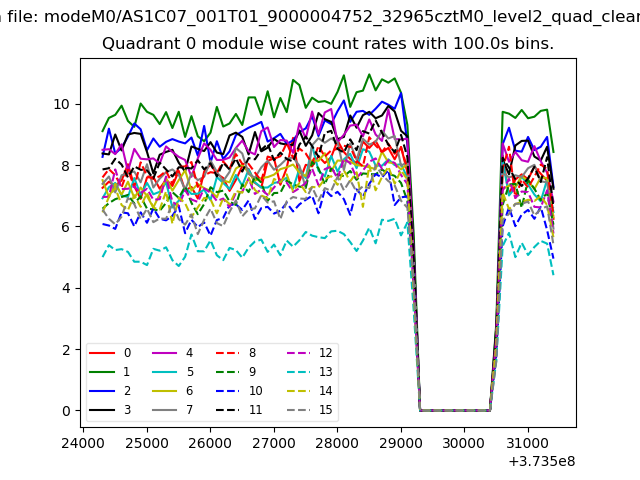 |
 |
| Module-wise count rates for Quadrant B Data is divided into 100 sec bins |
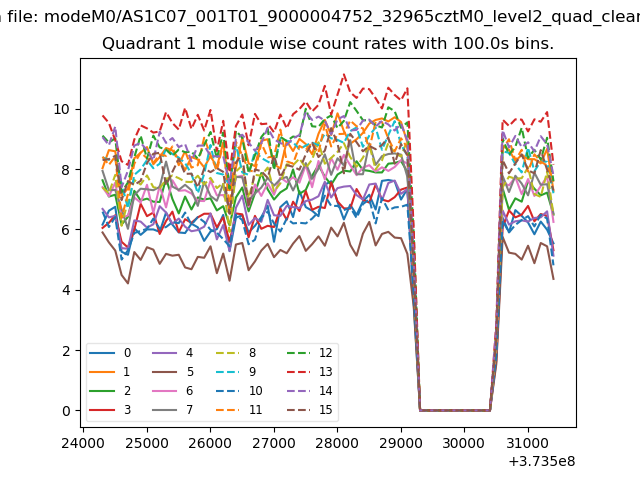 |
 |
| Module-wise count rates for Quadrant C Data is divided into 100 sec bins |
 |
 |
| Module-wise count rates for Quadrant D Data is divided into 100 sec bins |
 |
 |
| Parameter | Plot |
|---|---|
| CZT HV Monitor | 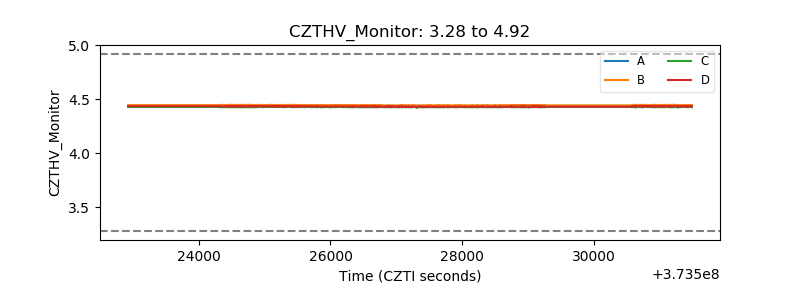 |
| D_VDD | 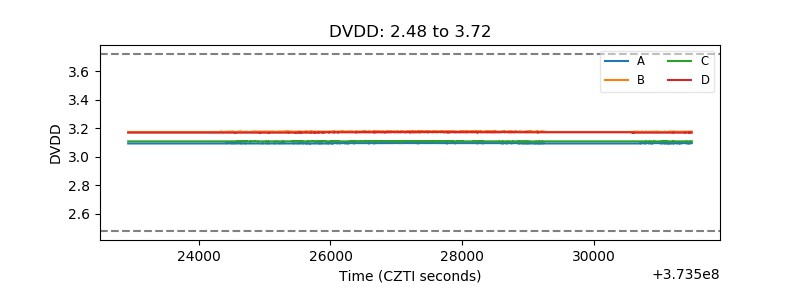 |
| Temperature 1 |  |
| Veto HV Monitor | 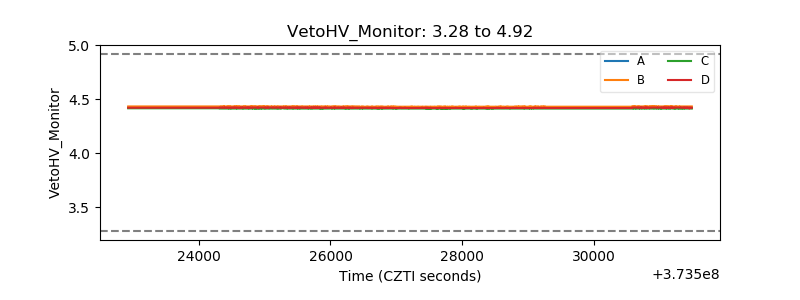 |
| Veto LLD | 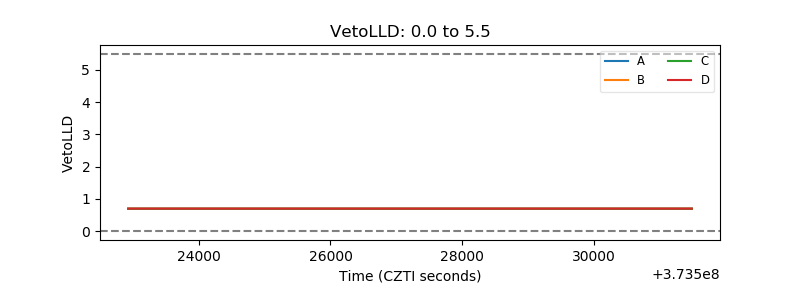 |
| Alpha Counter | 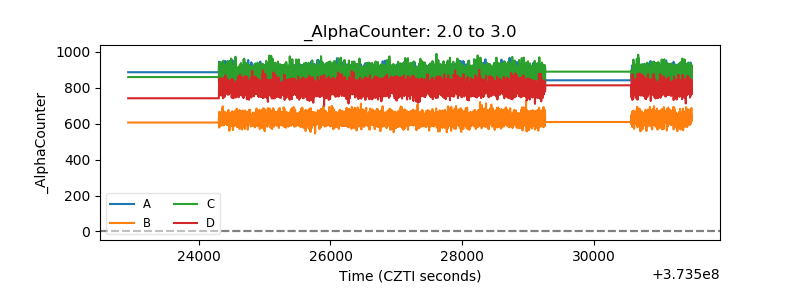 |
| _CPM_Rate |  |
| CZT Counter | 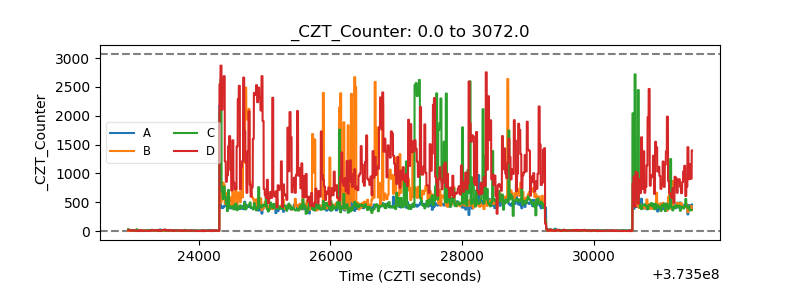 |
| +2.5 Volts monitor |  |
| +5 Volts monitor |  |
| _ROLL_ROT | 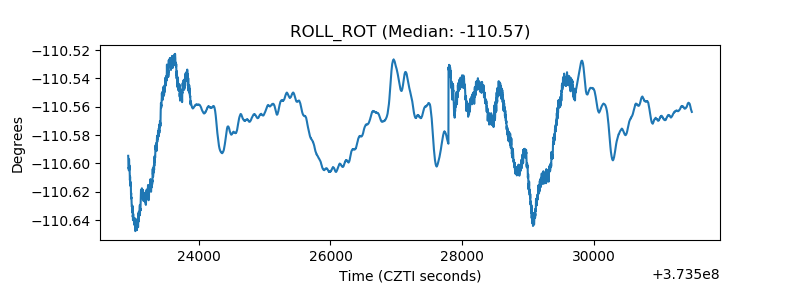 |
| _Roll_DEC | 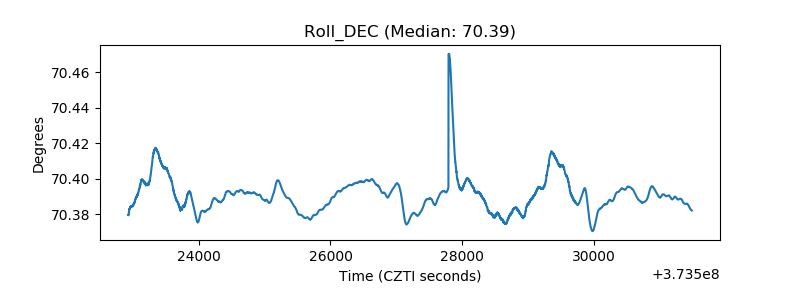 |
| _Roll_RA |  |
| Veto Counter | 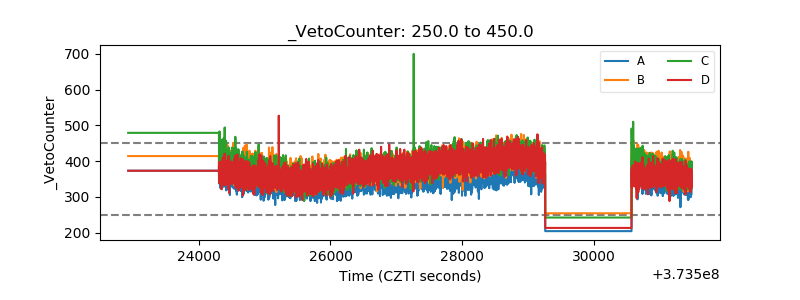 |