| Param | Original file | Final file |
|---|---|---|
| Filename | modeM0/AS1C07_001T01_9000004752_32968cztM0_level2.evt | modeM0/AS1C07_001T01_9000004752_32968cztM0_level2_quad_clean.evt |
| Size (bytes) | 1,155,792,960 | 207,748,800 |
| Size | 1.1 GB | 198.1 MB |
| Events in quadrant A | 5,272,582 | 1,435,007 |
| Events in quadrant B | 9,732,345 | 1,342,306 |
| Events in quadrant C | 7,173,820 | 1,407,180 |
| Events in quadrant D | 12,038,885 | 1,300,408 |
| Mode M0 | |||
|---|---|---|---|
| Quadrant | BADHDUFLAG | Total packets | Discarded packets |
| A | 0 | 23690 | 3 |
| B | 0 | 36509 | 3 |
| C | 0 | 29351 | 3 |
| D | 0 | 44334 | 3 |
| Mode SS | |||
|---|---|---|---|
| Quadrant | BADHDUFLAG | Total packets | Discarded packets |
| A | 0 | 238 | 0 |
| B | 0 | 238 | 0 |
| C | 0 | 238 | 0 |
| D | 0 | 238 | 0 |
| Mode M9 | |||
|---|---|---|---|
| Quadrant | BADHDUFLAG | Total packets | Discarded packets |
| A | 0 | 29 | 0 |
| B | 0 | 29 | 0 |
| C | 0 | 29 | 0 |
| D | 0 | 30 | 0 |
| Quadrant | Total seconds | Saturated seconds | Saturation percentage |
|---|---|---|---|
| A | 11661 | 38 | 0.325873% |
| B | 11661 | 1563 | 13.403653% |
| C | 11661 | 298 | 2.555527% |
| D | 11661 | 632 | 5.419775% |
Noise dominated data is calculated using 1-second bins in cleaned event files. If a bin has >2000 counts, and if more than 50% of those come from <1% of pixels, then it is considered to be noise-dominated and hence unusable.
| Quadrant | # 1 sec bins | Bins with >0 counts | Bins with >2000 counts | High rate bins dominated by noise | Noise dominated (total time) | Noise dominated (detector-on time) | Marked lightcurve |
|---|---|---|---|---|---|---|---|
| A | 14346 | 11663 | 28 | 28 | 0.20% | 0.24% | 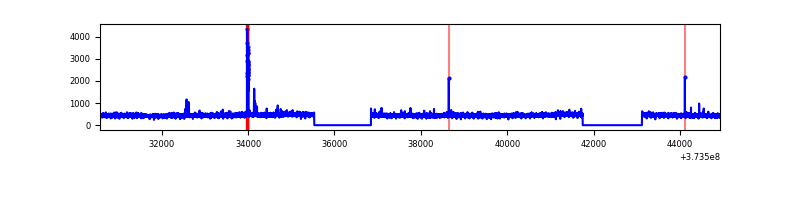 |
| B | 14345 | 11662 | 1188 | 1188 | 8.28% | 10.19% | 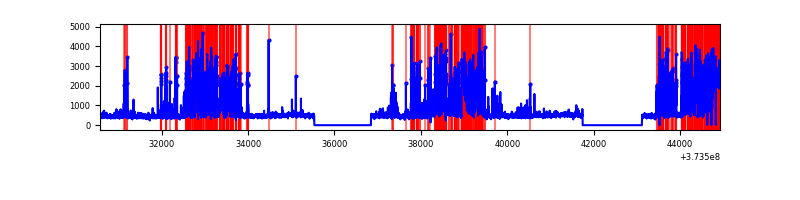 |
| C | 14346 | 11663 | 291 | 291 | 2.03% | 2.50% | 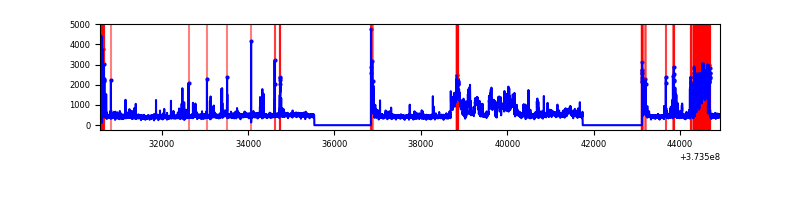 |
| D | 14346 | 11663 | 536 | 536 | 3.74% | 4.60% | 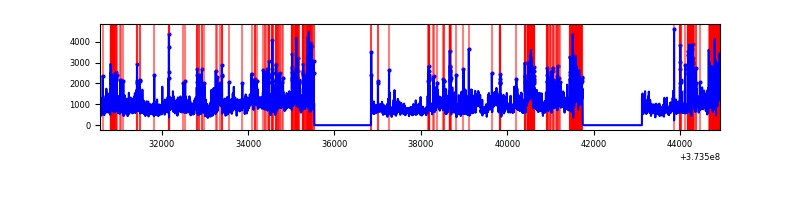 |
Top three noisy pixels from each quadrant. If the there are fewer than three noisy pixels in the level2.evt file, extra rows are filled as -1
| Pixel properties | Quadrant properties | ||||||
|---|---|---|---|---|---|---|---|
| Quadrant | DetID | PixID | Counts | Sigma | Mean | Median | Sigma |
| A | 15 | 174 | 84478 | 315.81 | 1323 | 1296 | 263.4 |
| A | 13 | 254 | 24557 | 88.31 | 1323 | 1296 | 263.4 |
| A | 9 | 143 | 24040 | 86.35 | 1323 | 1296 | 263.4 |
| B | 5 | 172 | 3895142 | 16594.81 | 1241 | 1210 | 234.6 |
| B | 4 | 171 | 287240 | 1218.98 | 1241 | 1210 | 234.6 |
| B | 5 | 200 | 221816 | 940.16 | 1241 | 1210 | 234.6 |
| C | 9 | 54 | 1669399 | 5619.23 | 1280 | 1287 | 296.9 |
| C | 0 | 10 | 287442 | 963.95 | 1280 | 1287 | 296.9 |
| C | 1 | 241 | 118767 | 395.74 | 1280 | 1287 | 296.9 |
| D | 8 | 195 | 3283349 | 10341.96 | 1253 | 1225 | 317.4 |
| D | 7 | 223 | 1075963 | 3386.49 | 1253 | 1225 | 317.4 |
| D | 13 | 153 | 947996 | 2983.27 | 1253 | 1225 | 317.4 |
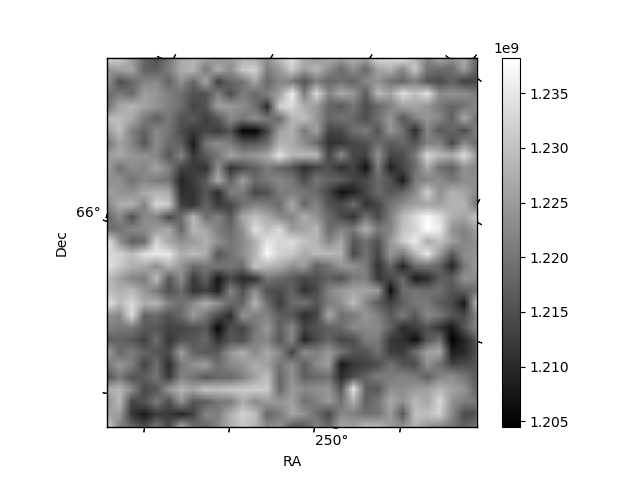
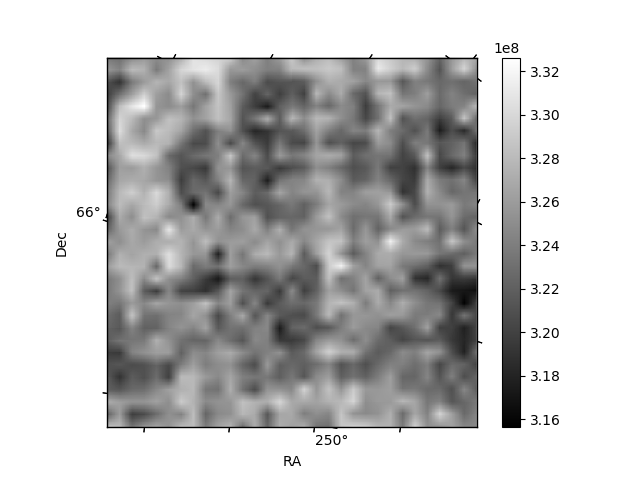
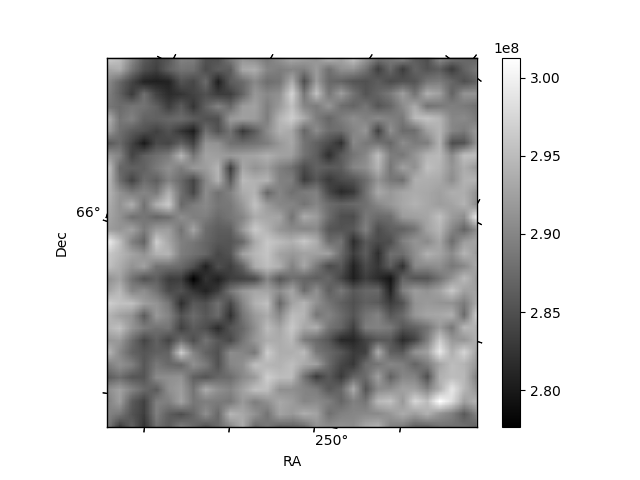
Histogram calculated using DETX and DETY for each event in the final _common_clean file
| Quadrant A | 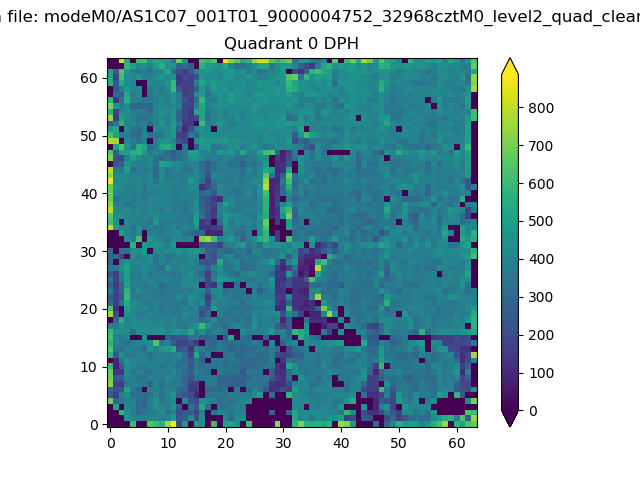 |
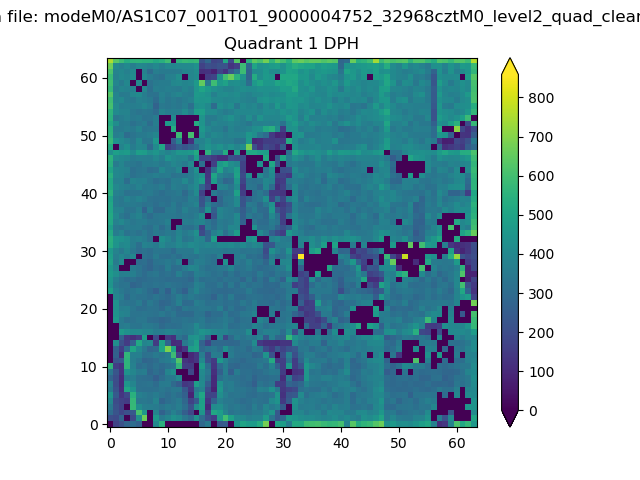 |
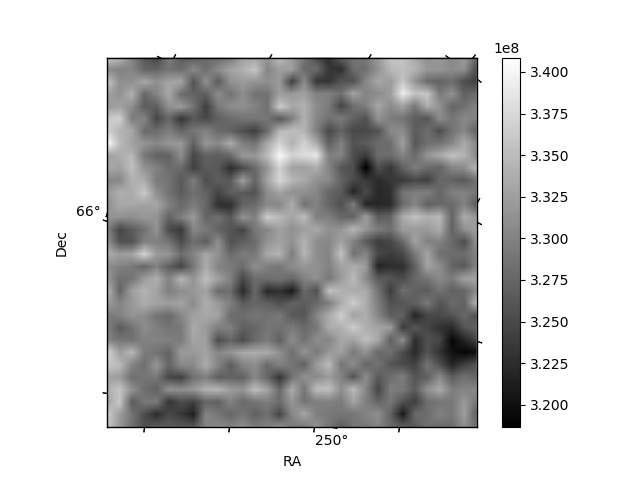
Quadrant B |
|---|---|---|---|
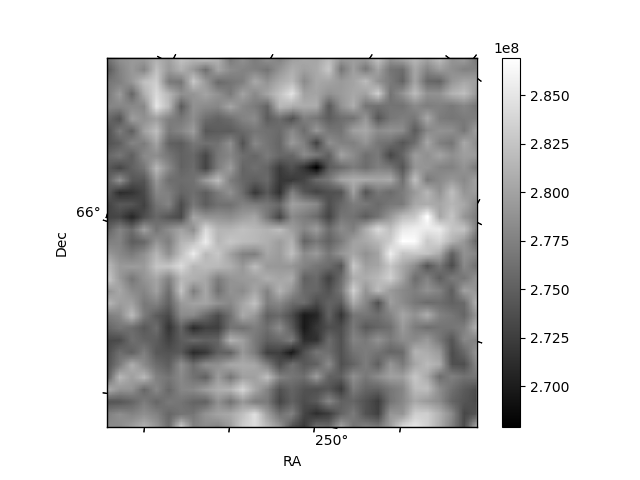
| Quadrant D | 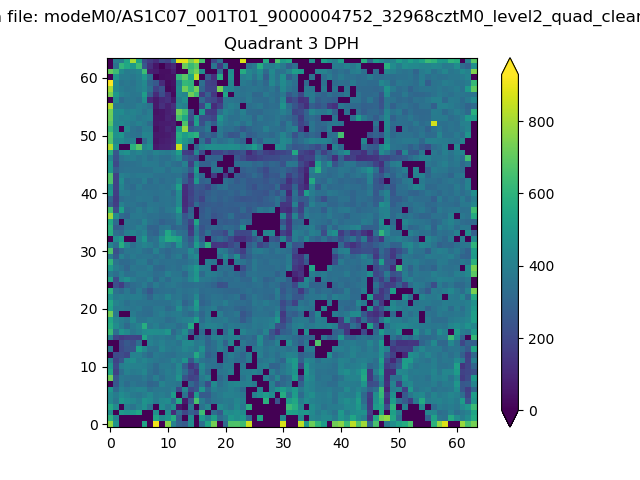 |
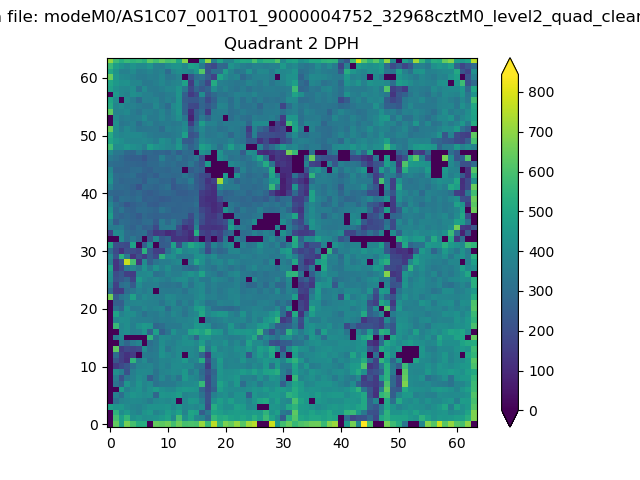 |
Quadrant C |
| Plot type | Count rate plots | Images |
|---|---|---|
| Comparison with Poisson distribution Blue bars denote a histogram of data divided into 1 sec bins. Red curve is a Poisson curve with rate = median count rate of data. |
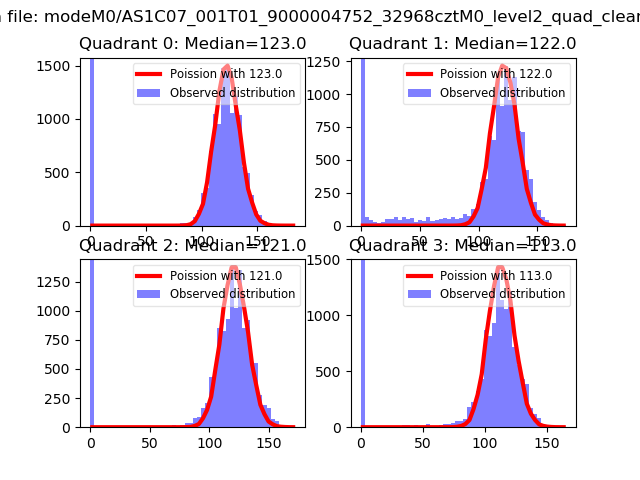 |
 |
| Quadrant-wise count rates Data is divided into 100 sec bins |
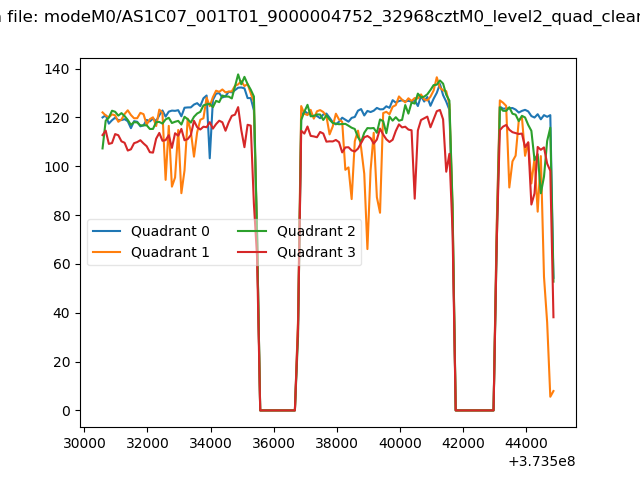 |
|
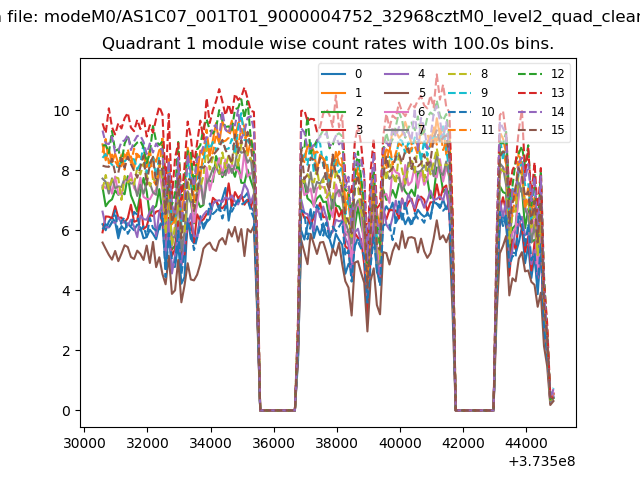
| Module-wise count rates for Quadrant A Data is divided into 100 sec bins |
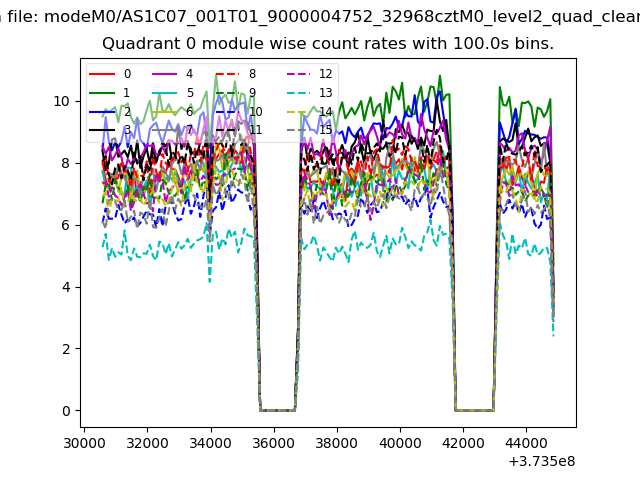 |
 |
| Module-wise count rates for Quadrant B Data is divided into 100 sec bins |
 |
 |
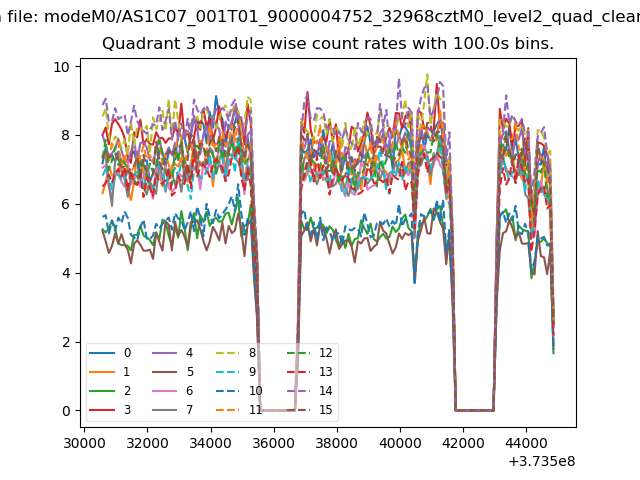
| Module-wise count rates for Quadrant C Data is divided into 100 sec bins |
 |
 |
| Module-wise count rates for Quadrant D Data is divided into 100 sec bins |
 |
 |
| Parameter | Plot |
|---|---|
| CZT HV Monitor | 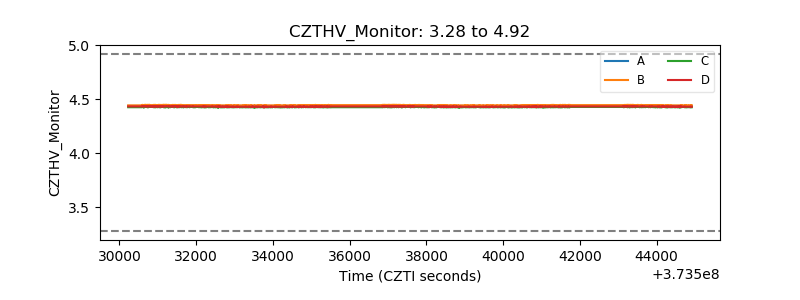 |
| D_VDD | 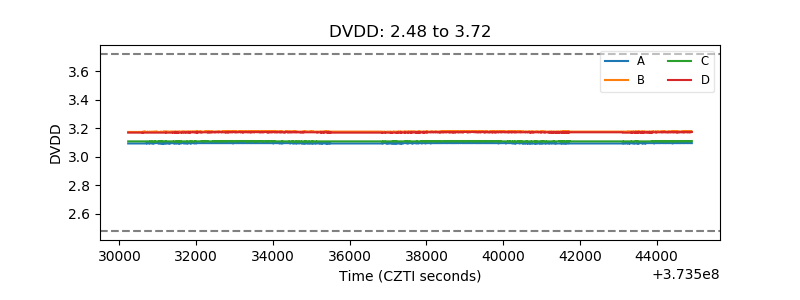 |
| Temperature 1 | 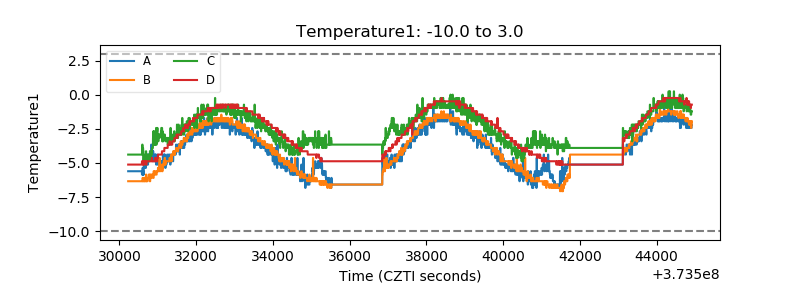 |
| Veto HV Monitor | 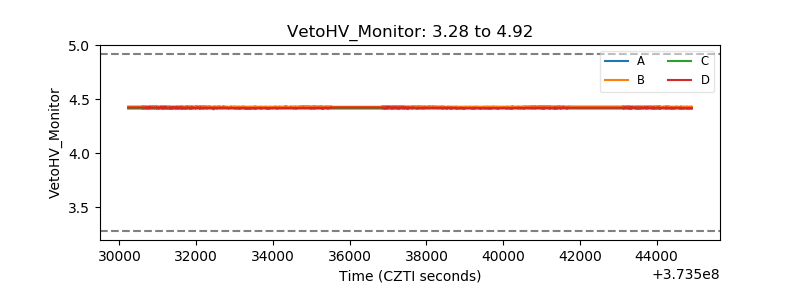 |
| Veto LLD | 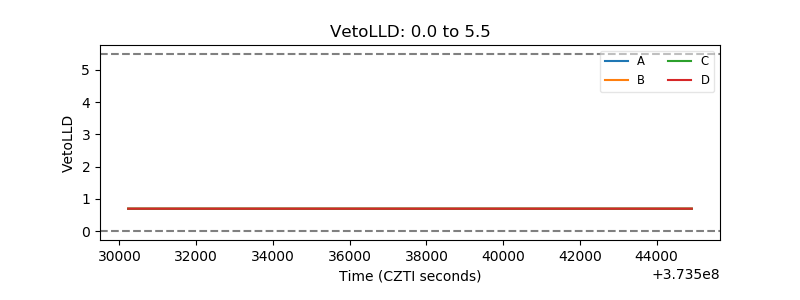 |
| Alpha Counter | 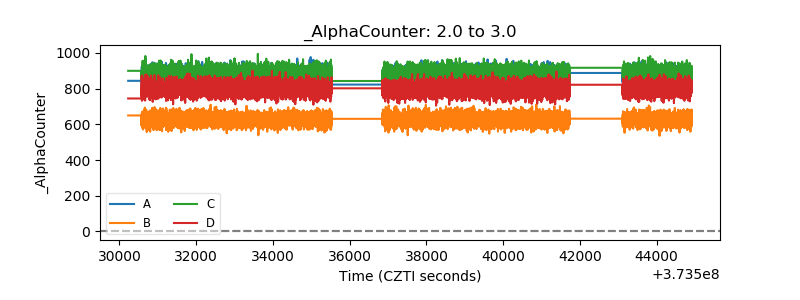 |
| _CPM_Rate | 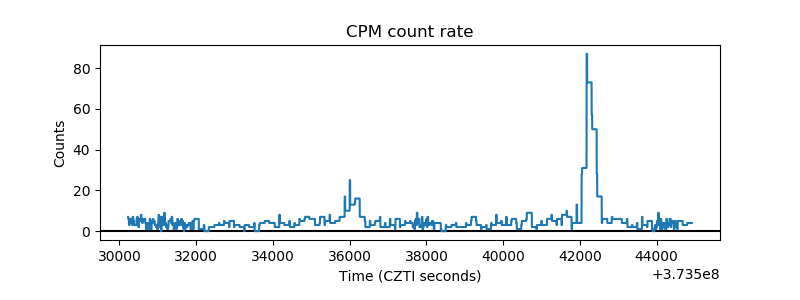 |
| CZT Counter | 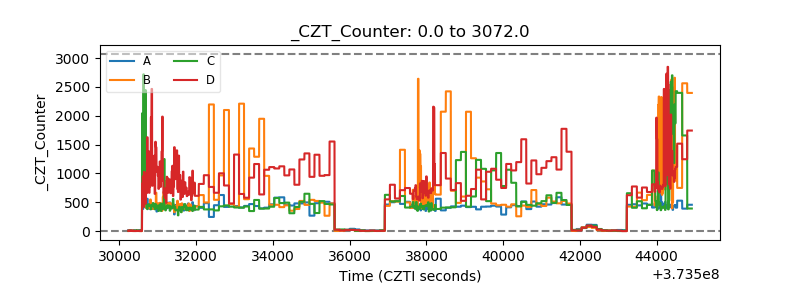 |
| +2.5 Volts monitor |  |
| +5 Volts monitor | 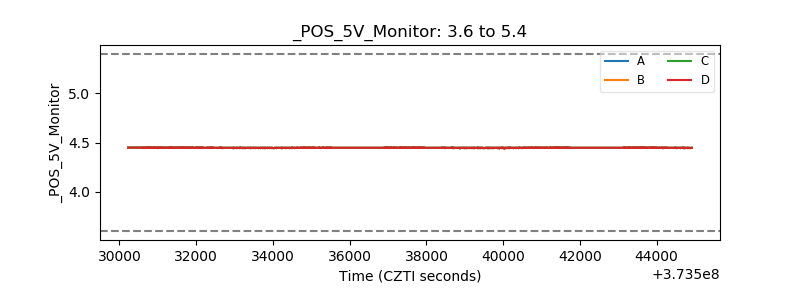 |
| _ROLL_ROT | 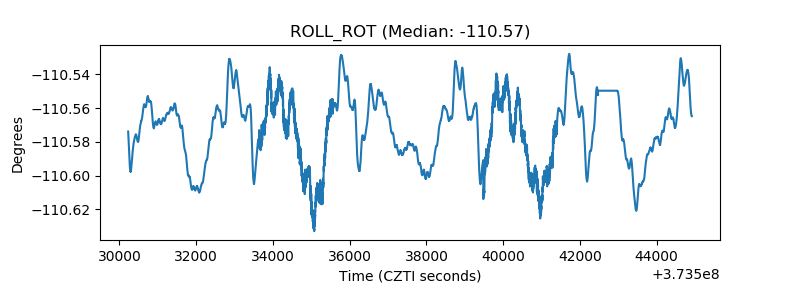 |
| _Roll_DEC | 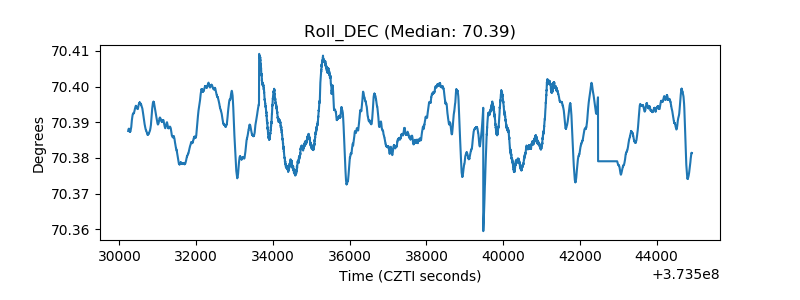 |
| _Roll_RA | 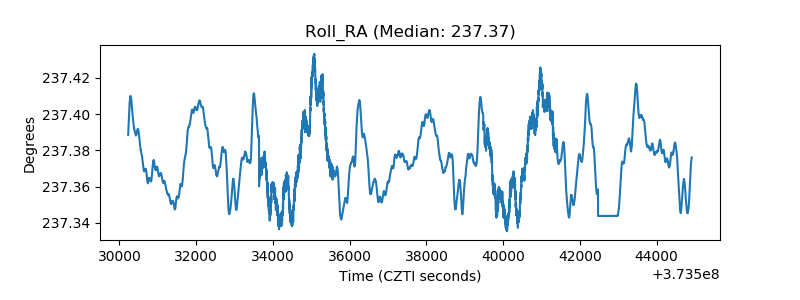 |
| Veto Counter | 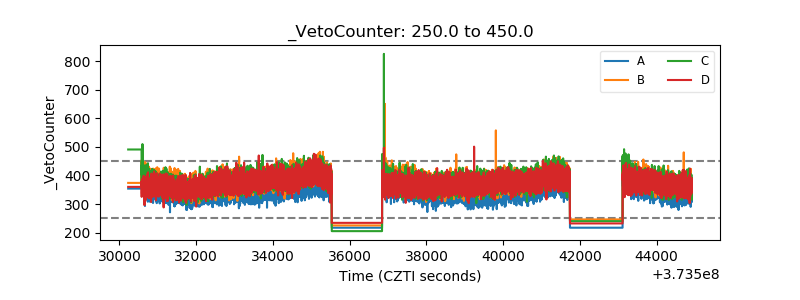 |