| Param | Original file | Final file |
|---|---|---|
| Filename | modeM0/AS1T04_065T01_9000004750cztM0_level2.fits | modeM0/AS1T04_065T01_9000004750cztM0_level2_quad_clean.evt |
| Size (bytes) | 85,824,000 | 72,299,520 |
| Size | 81.8 MB | 69.0 MB |
| Events in quadrant A | 544,808 | 471,118 |
| Events in quadrant B | 501,494 | 459,731 |
| Events in quadrant C | 545,190 | 452,142 |
| Events in quadrant D | 321,862 | 122,193 |
| Mode M0 | |||
|---|---|---|---|
| Quadrant | BADHDUFLAG | Total packets | Discarded packets |
| A | 0 | 19921 | 0 |
| B | 0 | 27605 | 0 |
| C | 0 | 20253 | 0 |
| D | 0 | 60904 | 0 |
| Mode SS | |||
|---|---|---|---|
| Quadrant | BADHDUFLAG | Total packets | Discarded packets |
| A | 0 | 202 | 0 |
| B | 0 | 202 | 0 |
| C | 0 | 202 | 0 |
| D | 0 | 202 | 0 |
| Mode M9 | |||
|---|---|---|---|
| Quadrant | BADHDUFLAG | Total packets | Discarded packets |
| A | 0 | 15 | 0 |
| B | 0 | 15 | 0 |
| C | 0 | 15 | 0 |
| D | 0 | 15 | 0 |
| Quadrant | Total seconds | Saturated seconds | Saturation percentage |
|---|---|---|---|
| A | 9855 | 12 | 0.121766% |
| B | 9855 | 879 | 8.919330% |
| C | 9855 | 20 | 0.202943% |
| D | 9855 | 5068 | 51.425672% |
Noise dominated data is calculated using 1-second bins in cleaned event files. If a bin has >2000 counts, and if more than 50% of those come from <1% of pixels, then it is considered to be noise-dominated and hence unusable.
| Quadrant | # 1 sec bins | Bins with >0 counts | Bins with >2000 counts | High rate bins dominated by noise | Noise dominated (total time) | Noise dominated (detector-on time) | Marked lightcurve |
|---|---|---|---|---|---|---|---|
| A | 11228 | 9854 | 0 | 0 | 0.00% | 0.00% | 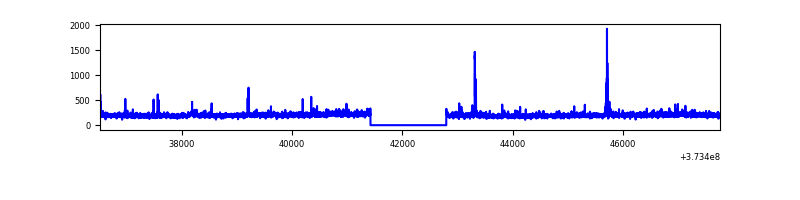 |
| B | 11228 | 9837 | 0 | 0 | 0.00% | 0.00% | 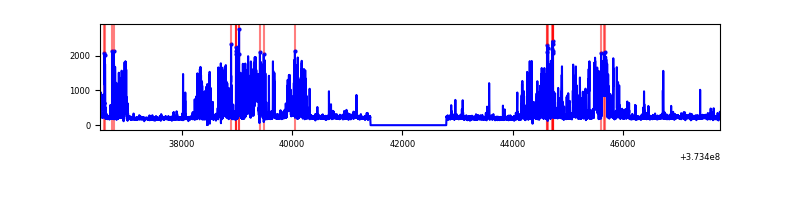 |
| C | 11228 | 9854 | 0 | 0 | 0.00% | 0.00% | 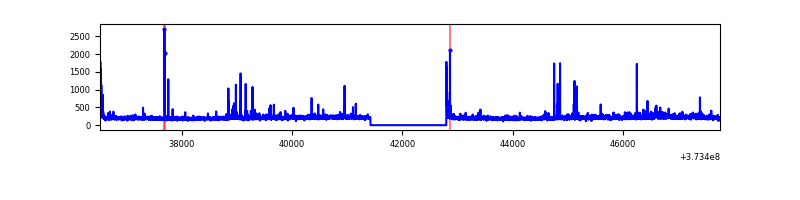 |
| D | 11228 | 9827 | 0 | 0 | 0.00% | 0.00% | 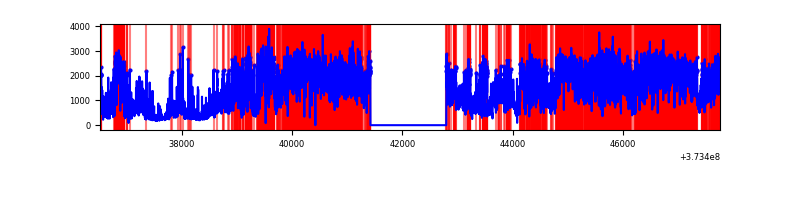 |
Top three noisy pixels from each quadrant. If the there are fewer than three noisy pixels in the level2.evt file, extra rows are filled as -1
| Pixel properties | Quadrant properties | ||||||
|---|---|---|---|---|---|---|---|
| Quadrant | DetID | PixID | Counts | Sigma | Mean | Median | Sigma |
| A | 0 | 29 | 447 | 8.52 | 142 | 134 | 36.7 |
| A | 7 | 110 | 440 | 8.33 | 142 | 134 | 36.7 |
| A | 14 | 95 | 438 | 8.28 | 142 | 134 | 36.7 |
| B | 3 | 80 | 402 | 9.84 | 133 | 127 | 27.9 |
| B | 2 | 9 | 378 | 8.98 | 133 | 127 | 27.9 |
| B | 3 | 17 | 344 | 7.77 | 133 | 127 | 27.9 |
| C | 1 | 80 | 438 | 7.96 | 144 | 135 | 38.1 |
| C | 1 | 81 | 436 | 7.9 | 144 | 135 | 38.1 |
| C | 1 | 65 | 363 | 5.99 | 144 | 135 | 38.1 |
| D | 4 | 160 | 263 | 6.96 | 92 | 84 | 25.7 |
| D | 7 | 3 | 252 | 6.53 | 92 | 84 | 25.7 |
| D | 10 | 189 | 252 | 6.53 | 92 | 84 | 25.7 |
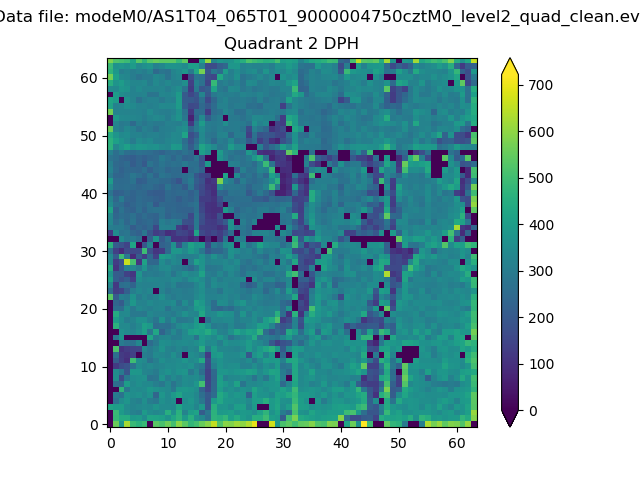
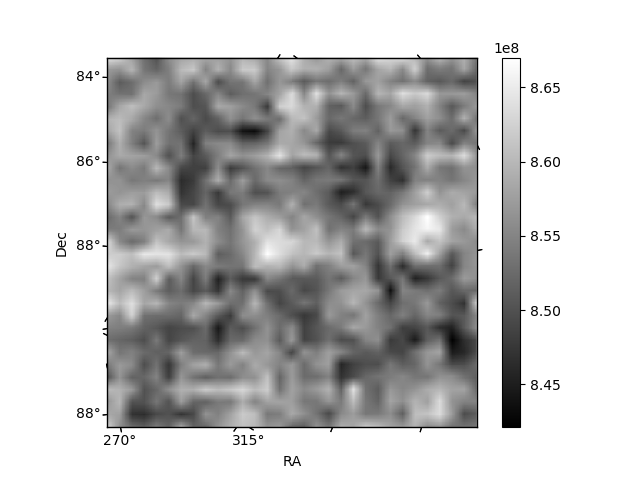
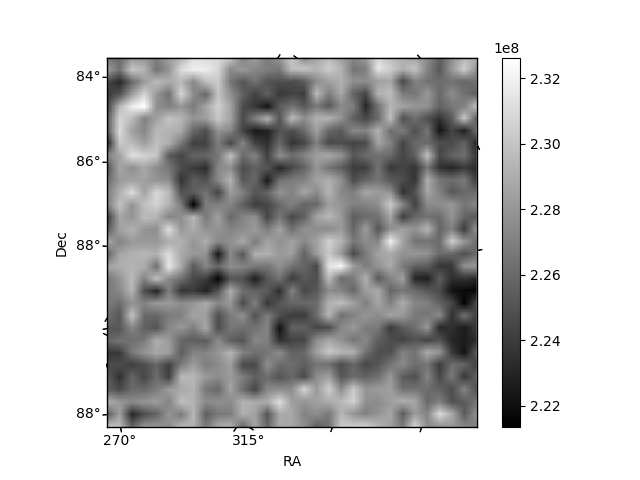
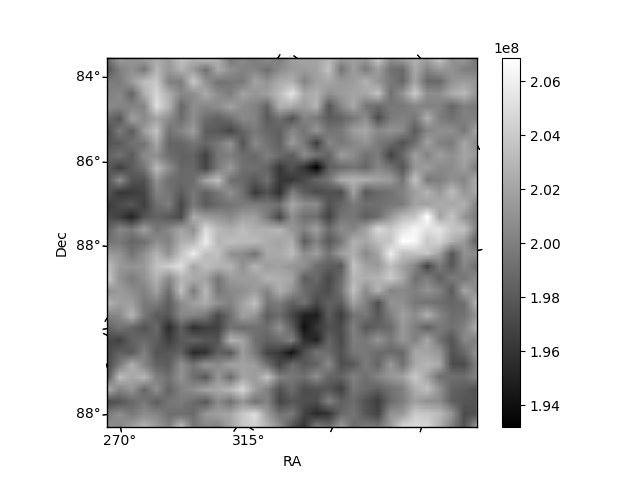
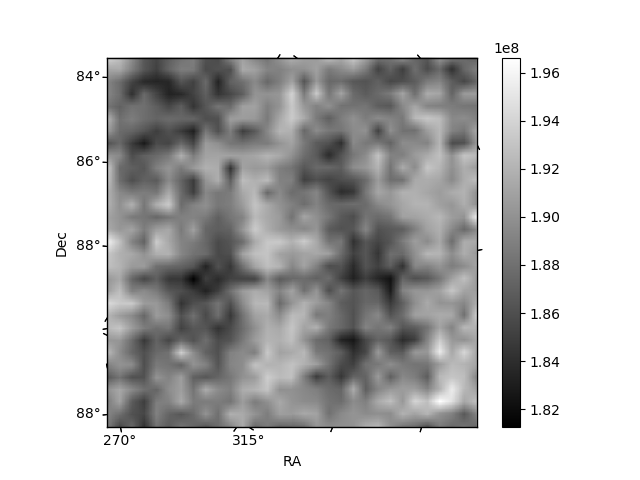
Histogram calculated using DETX and DETY for each event in the final _common_clean file
| Quadrant A | 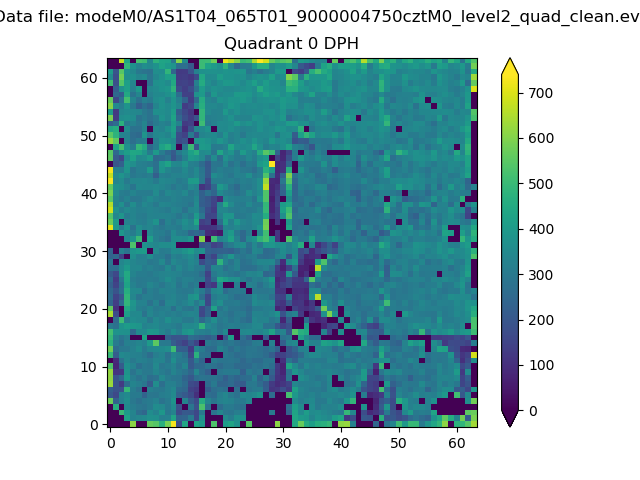 |
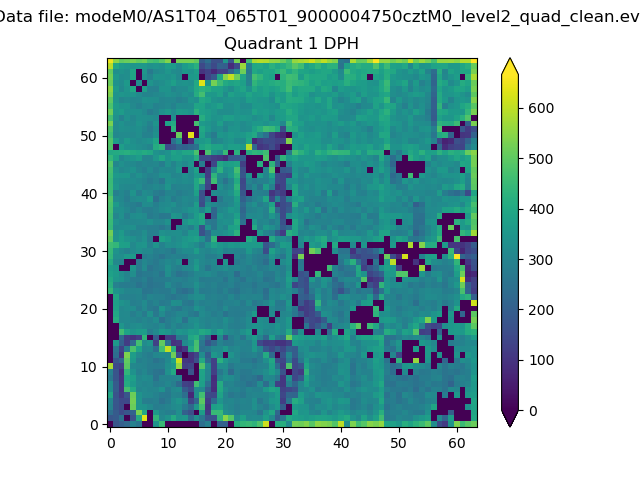 |
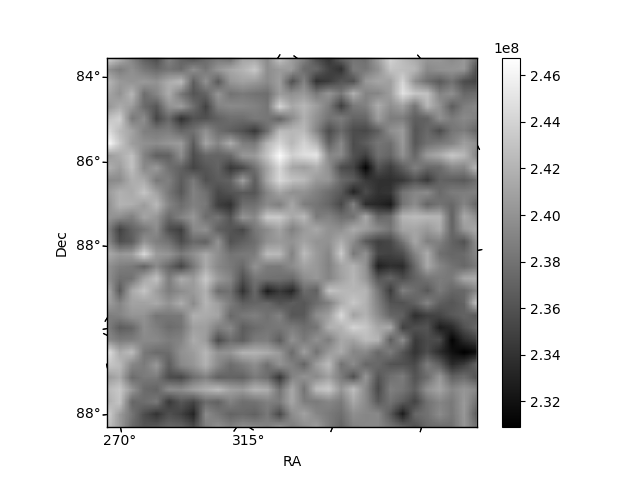
Quadrant B |
|---|---|---|---|
| Quadrant D | 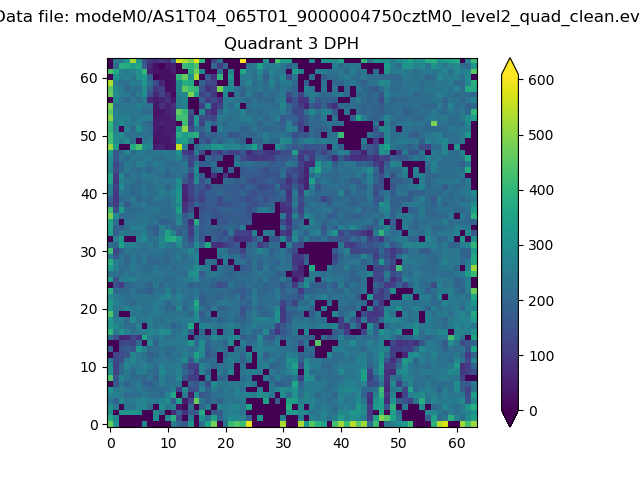 |
 |
Quadrant C |
| Plot type | Count rate plots | Images |
|---|---|---|
| Comparison with Poisson distribution Blue bars denote a histogram of data divided into 1 sec bins. Red curve is a Poisson curve with rate = median count rate of data. |
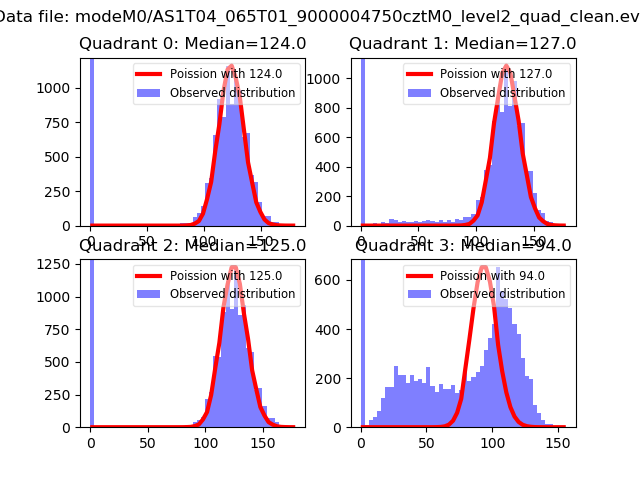 |
 |
| Quadrant-wise count rates Data is divided into 100 sec bins |
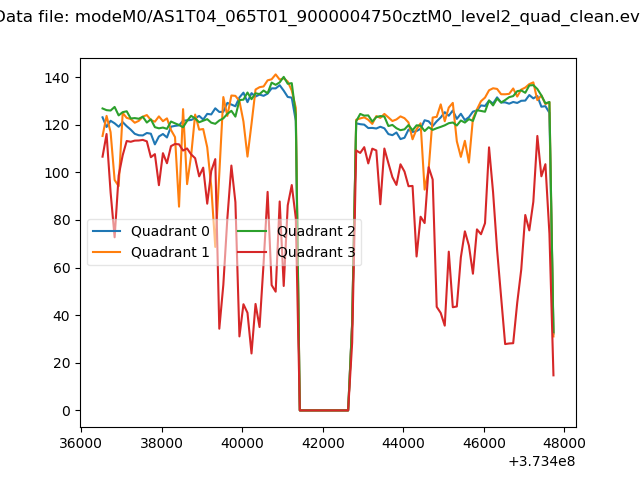 |
|
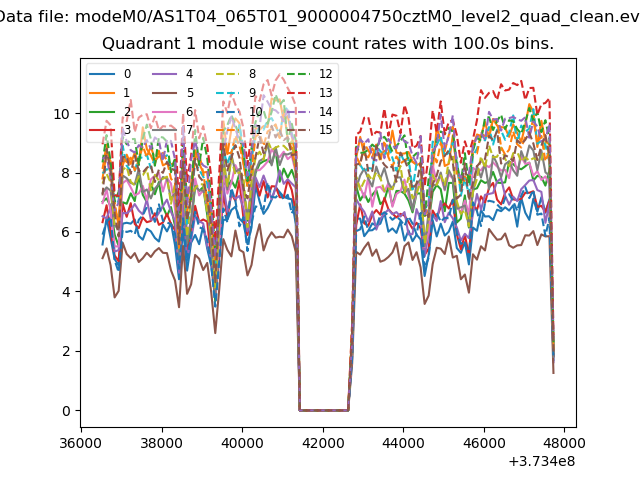
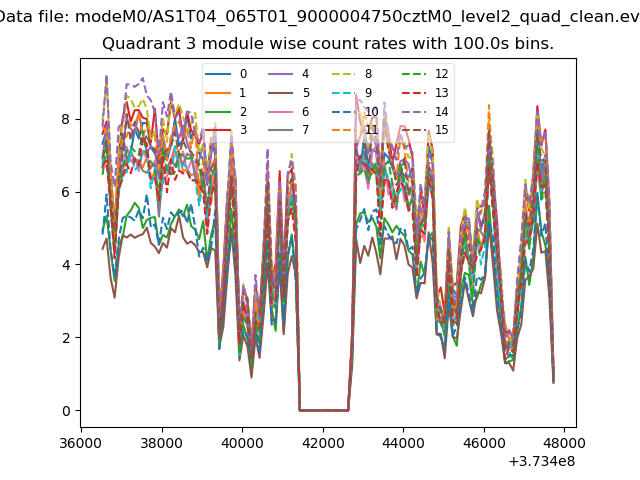
| Module-wise count rates for Quadrant A Data is divided into 100 sec bins |
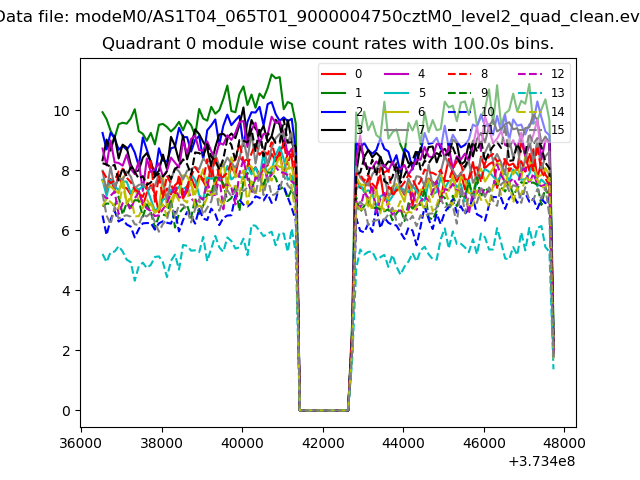 |
 |
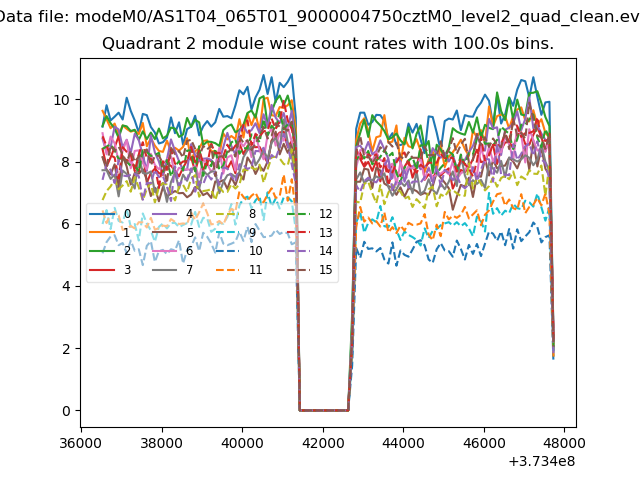
| Module-wise count rates for Quadrant B Data is divided into 100 sec bins |
 |
 |
| Module-wise count rates for Quadrant C Data is divided into 100 sec bins |
 |
 |
| Module-wise count rates for Quadrant D Data is divided into 100 sec bins |
 |
 |
| Parameter | Plot |
|---|---|
| CZT HV Monitor | 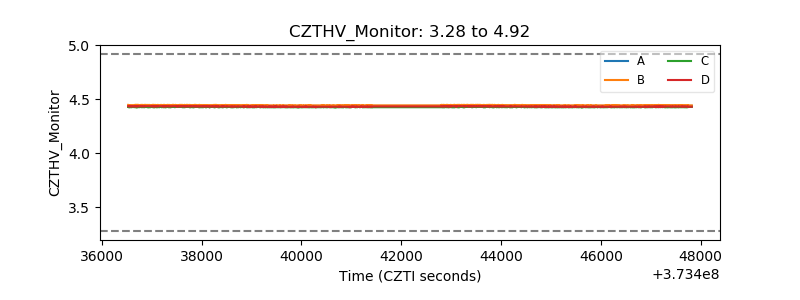 |
| D_VDD | 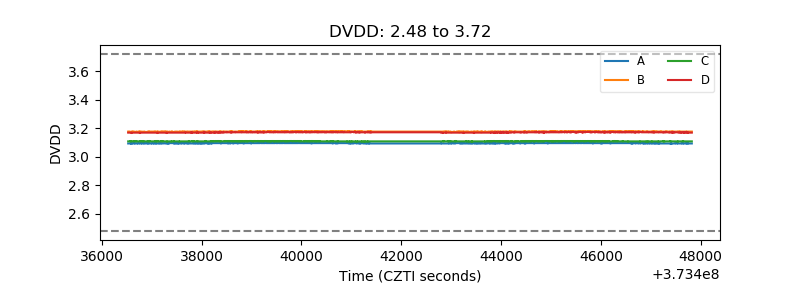 |
| Temperature 1 | 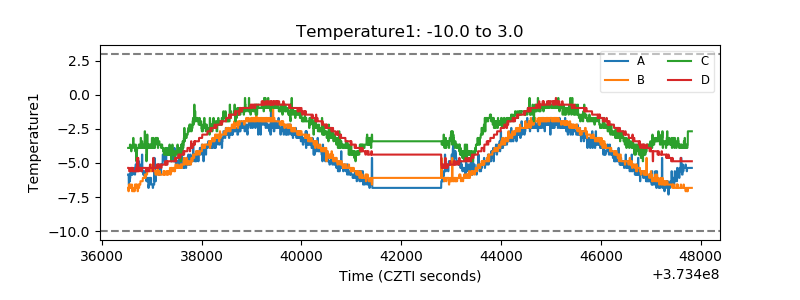 |
| Veto HV Monitor | 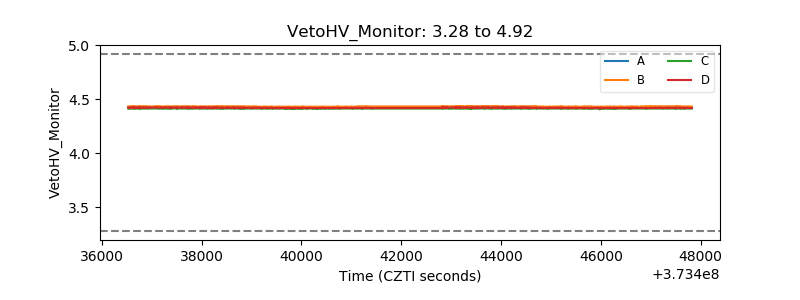 |
| Veto LLD | 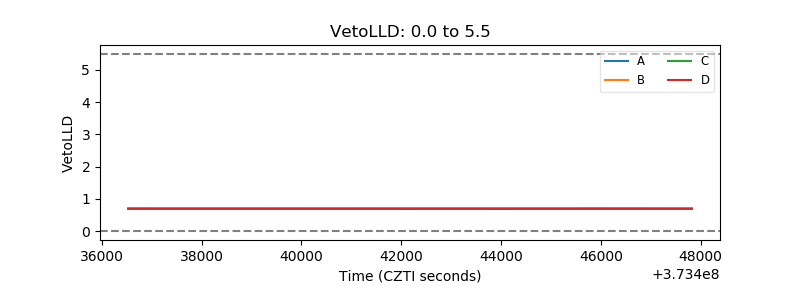 |
| Alpha Counter | 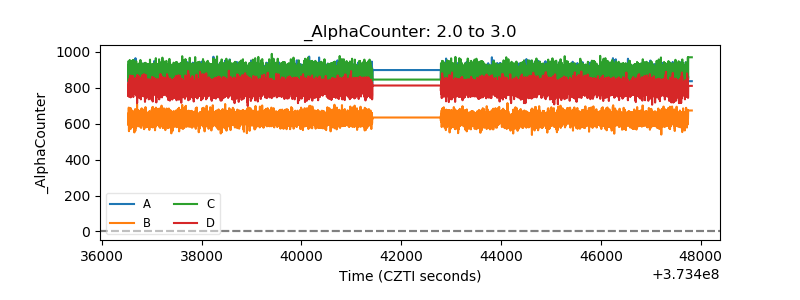 |
| _CPM_Rate | 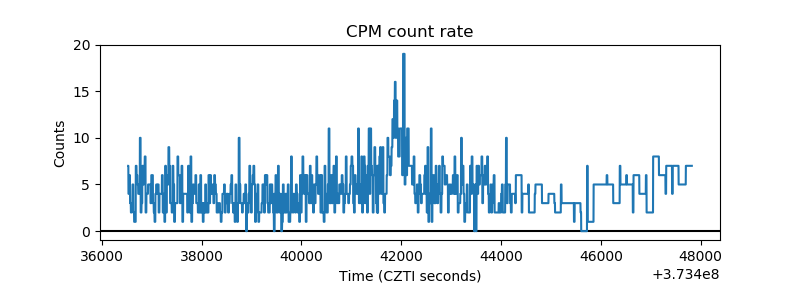 |
| CZT Counter | 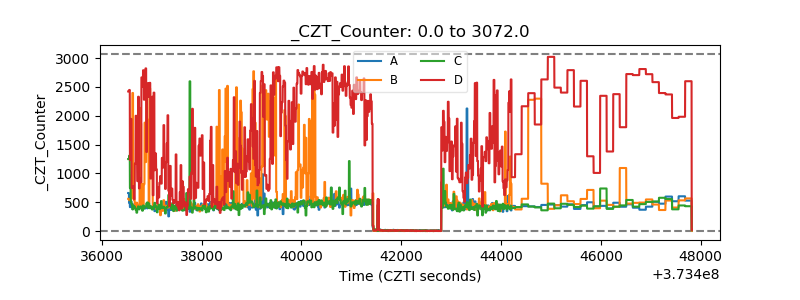 |
| +2.5 Volts monitor | 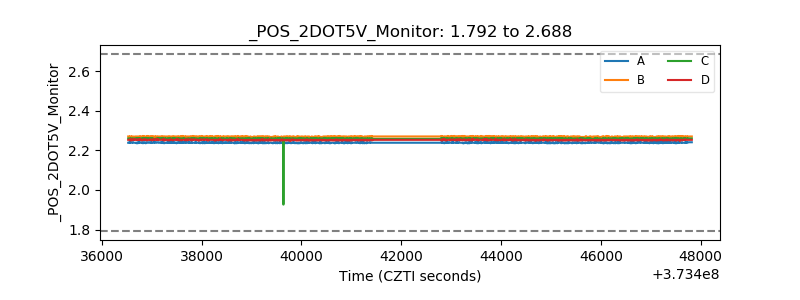 |
| +5 Volts monitor | 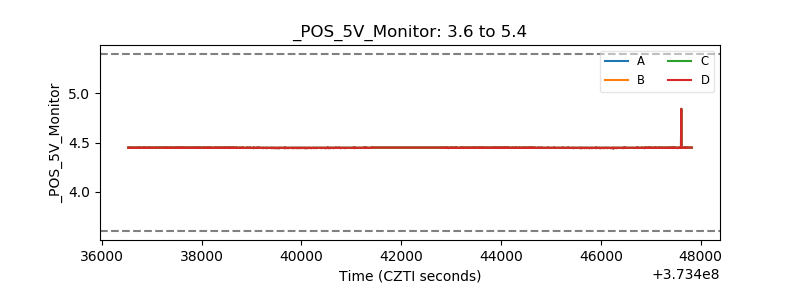 |
| _ROLL_ROT | 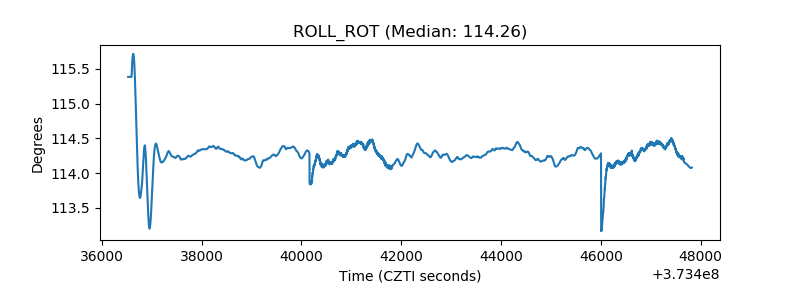 |
| _Roll_DEC | 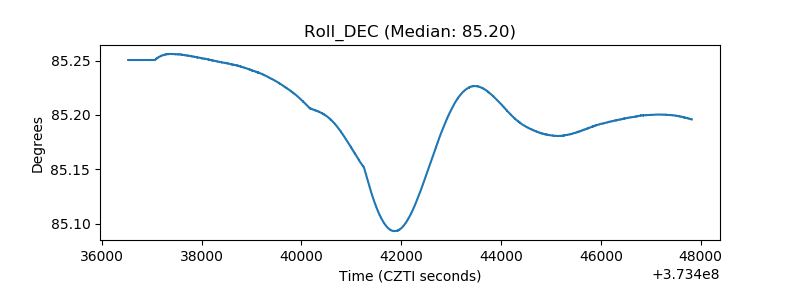 |
| _Roll_RA | 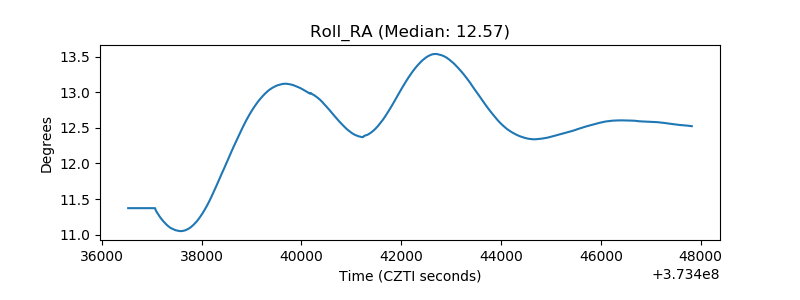 |
| Veto Counter | 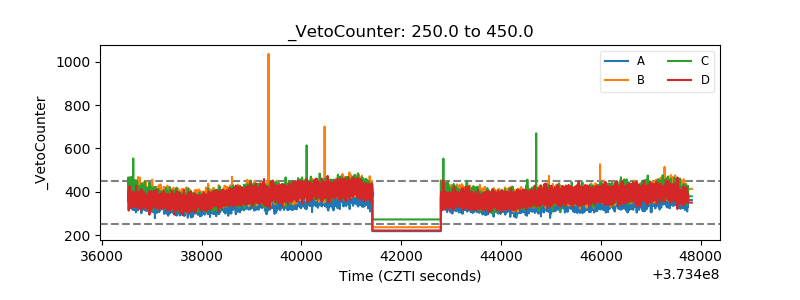 |