| Param | Original file | Final file |
|---|---|---|
| Filename | modeM0/AS1T04_065T01_9000004750_32949cztM0_level2.evt | modeM0/AS1T04_065T01_9000004750_32949cztM0_level2_quad_clean.evt |
| Size (bytes) | 95,466,240 | 17,498,880 |
| Size | 91.0 MB | 16.7 MB |
| Events in quadrant A | 412,829 | 116,605 |
| Events in quadrant B | 712,345 | 113,210 |
| Events in quadrant C | 439,834 | 121,833 |
| Events in quadrant D | 1,256,658 | 101,966 |
| Mode M0 | |||
|---|---|---|---|
| Quadrant | BADHDUFLAG | Total packets | Discarded packets |
| A | 0 | 1968 | 2 |
| B | 0 | 2795 | 1 |
| C | 0 | 2057 | 1 |
| D | 0 | 4401 | 1 |
| Mode SS | |||
|---|---|---|---|
| Quadrant | BADHDUFLAG | Total packets | Discarded packets |
| A | 0 | 20 | 0 |
| B | 0 | 20 | 0 |
| C | 0 | 20 | 0 |
| D | 0 | 20 | 0 |
| Quadrant | Total seconds | Saturated seconds | Saturation percentage |
|---|---|---|---|
| A | 977 | 2 | 0.204708% |
| B | 977 | 112 | 11.463664% |
| C | 977 | 2 | 0.204708% |
| D | 977 | 217 | 22.210850% |
Noise dominated data is calculated using 1-second bins in cleaned event files. If a bin has >2000 counts, and if more than 50% of those come from <1% of pixels, then it is considered to be noise-dominated and hence unusable.
| Quadrant | # 1 sec bins | Bins with >0 counts | Bins with >2000 counts | High rate bins dominated by noise | Noise dominated (total time) | Noise dominated (detector-on time) | Marked lightcurve |
|---|---|---|---|---|---|---|---|
| A | 977 | 977 | 0 | 0 | 0.00% | 0.00% | 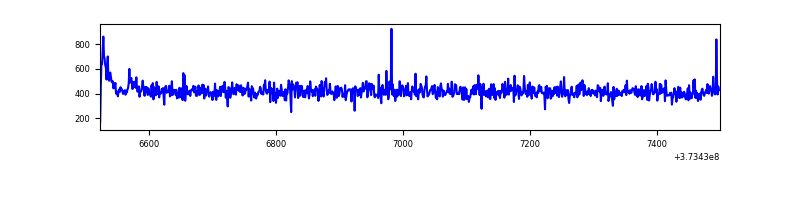 |
| B | 977 | 977 | 76 | 76 | 7.78% | 7.78% | 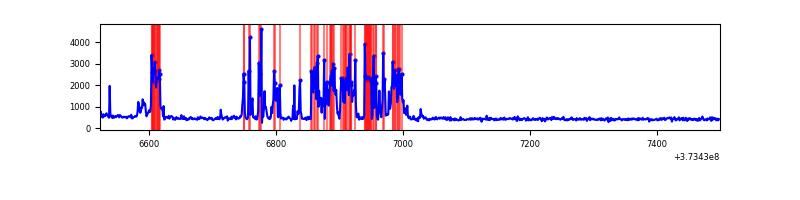 |
| C | 977 | 977 | 2 | 2 | 0.20% | 0.20% | 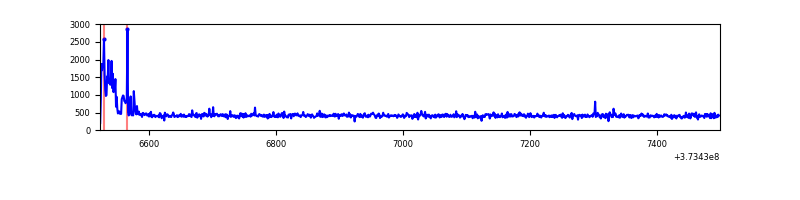 |
| D | 977 | 977 | 214 | 214 | 21.90% | 21.90% | 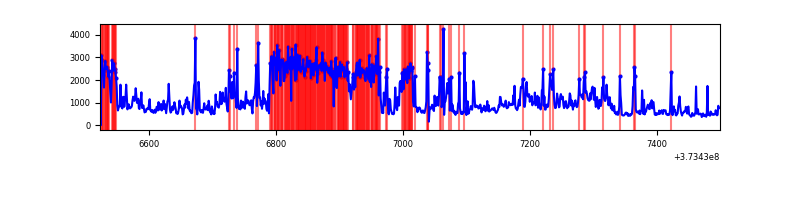 |
Top three noisy pixels from each quadrant. If the there are fewer than three noisy pixels in the level2.evt file, extra rows are filled as -1
| Pixel properties | Quadrant properties | ||||||
|---|---|---|---|---|---|---|---|
| Quadrant | DetID | PixID | Counts | Sigma | Mean | Median | Sigma |
| A | 3 | 252 | 4532 | 190.77 | 104 | 102 | 23.2 |
| A | 14 | 238 | 2469 | 101.93 | 104 | 102 | 23.2 |
| A | 13 | 254 | 1887 | 76.87 | 104 | 102 | 23.2 |
| B | 5 | 172 | 248597 | 11717.32 | 101 | 98 | 21.2 |
| B | 15 | 54 | 47107 | 2216.59 | 101 | 98 | 21.2 |
| B | 0 | 219 | 7104 | 330.35 | 101 | 98 | 21.2 |
| C | 0 | 10 | 35780 | 1413.65 | 101 | 102 | 25.2 |
| C | 3 | 233 | 2349 | 89.03 | 101 | 102 | 25.2 |
| C | 14 | 67 | 1429 | 52.58 | 101 | 102 | 25.2 |
| D | 12 | 227 | 310407 | 12177.7 | 90 | 87 | 25.5 |
| D | 7 | 80 | 214003 | 8394.58 | 90 | 87 | 25.5 |
| D | 12 | 218 | 106530 | 4177.08 | 90 | 87 | 25.5 |
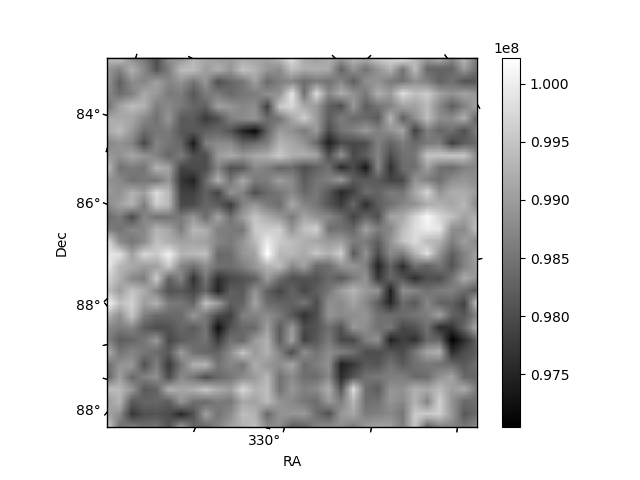
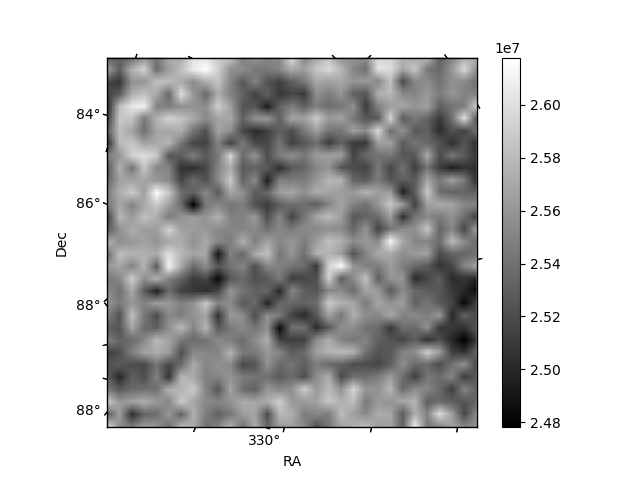
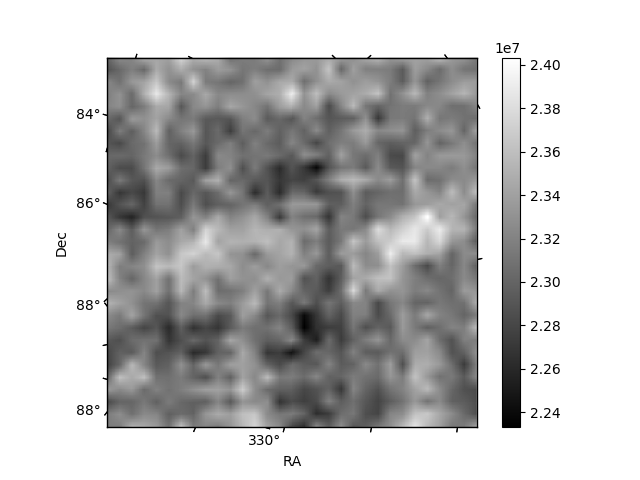
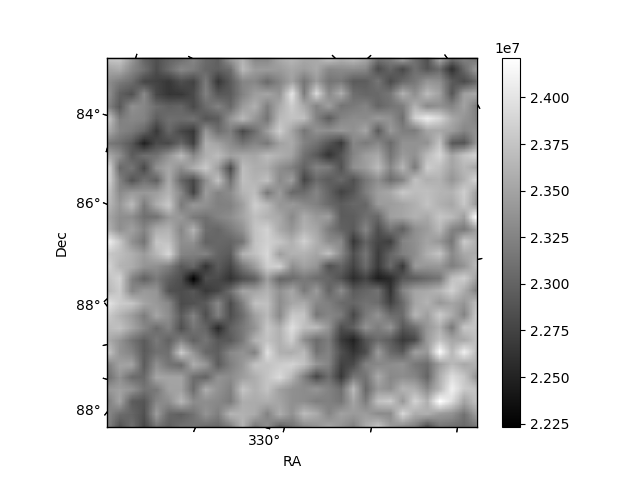
Histogram calculated using DETX and DETY for each event in the final _common_clean file
| Quadrant A | 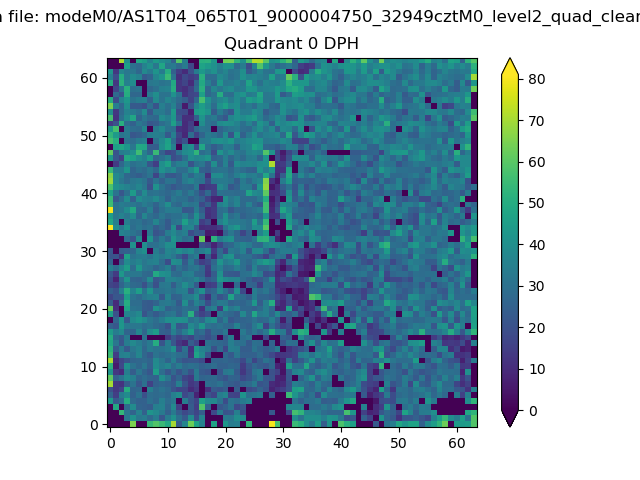 |
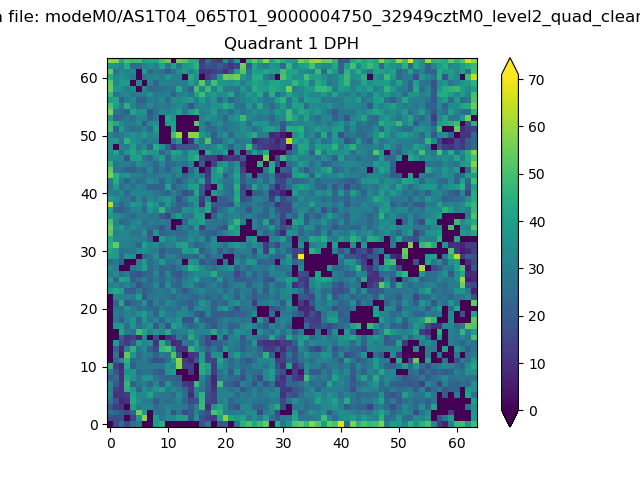 |
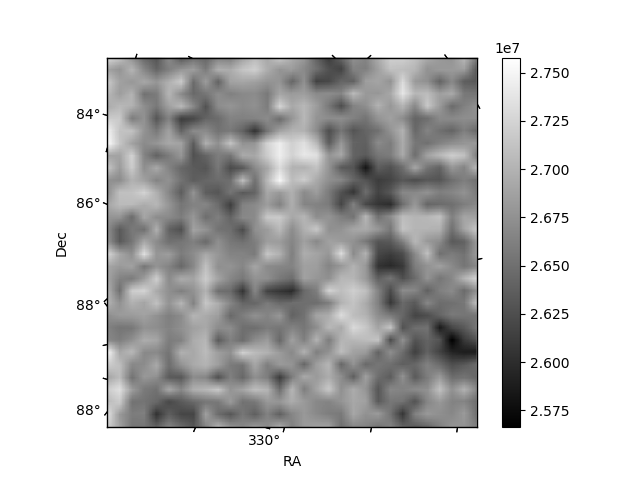
Quadrant B |
|---|---|---|---|
| Quadrant D | 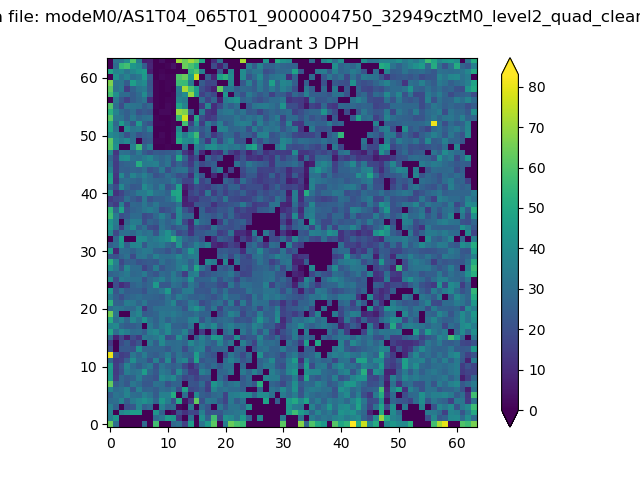 |
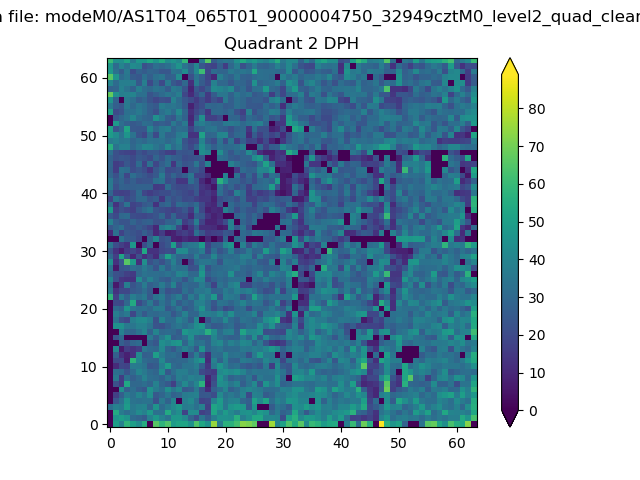 |
Quadrant C |
| Plot type | Count rate plots | Images |
|---|---|---|
| Comparison with Poisson distribution Blue bars denote a histogram of data divided into 1 sec bins. Red curve is a Poisson curve with rate = median count rate of data. |
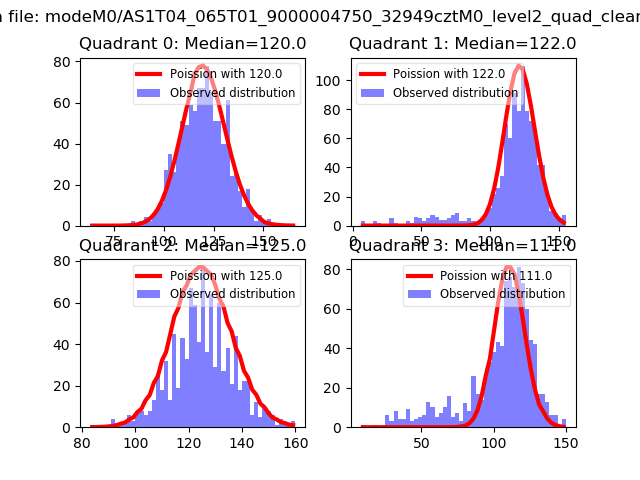 |
 |
| Quadrant-wise count rates Data is divided into 100 sec bins |
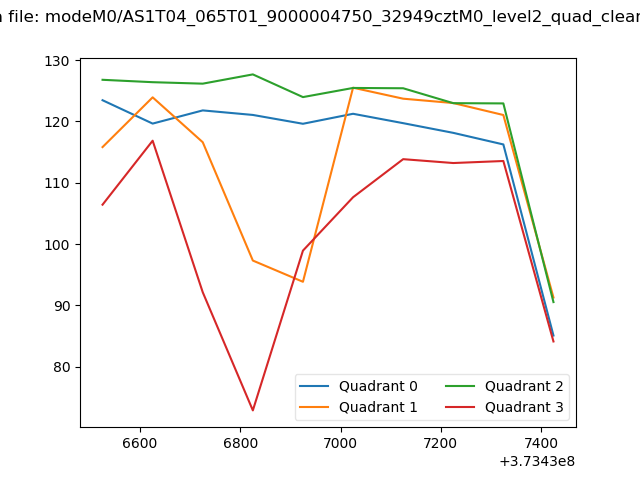 |
|
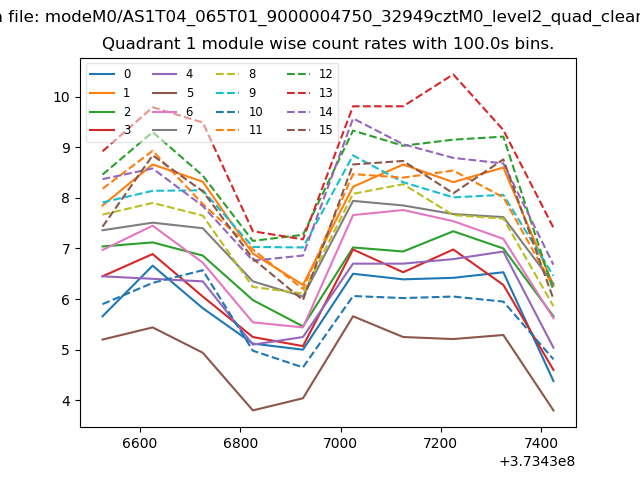
| Module-wise count rates for Quadrant A Data is divided into 100 sec bins |
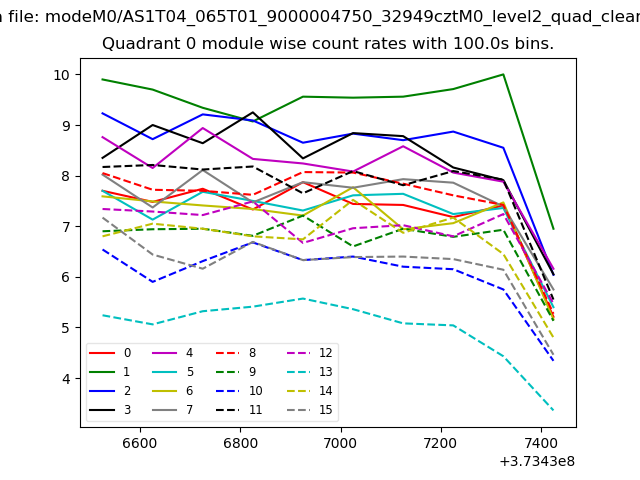 |
 |
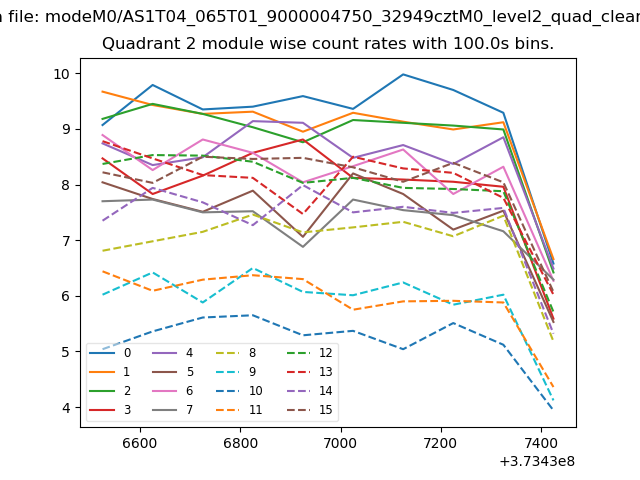
| Module-wise count rates for Quadrant B Data is divided into 100 sec bins |
 |
 |
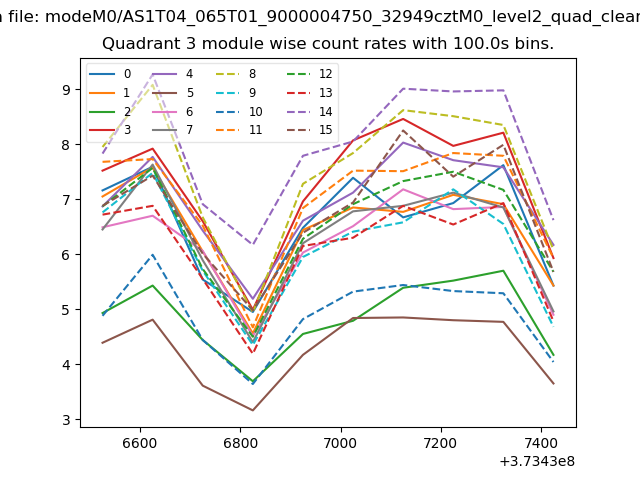
| Module-wise count rates for Quadrant C Data is divided into 100 sec bins |
 |
 |
| Module-wise count rates for Quadrant D Data is divided into 100 sec bins |
 |
 |
| Parameter | Plot |
|---|---|
| CZT HV Monitor | 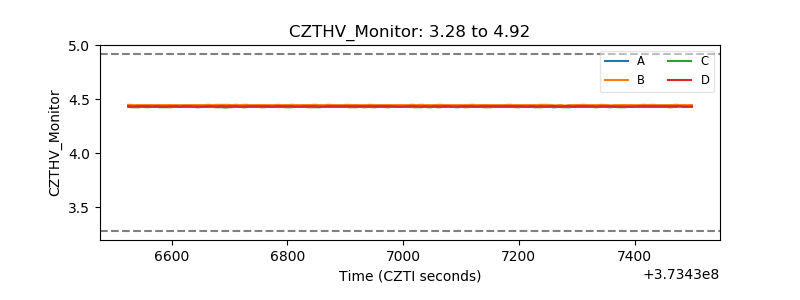 |
| D_VDD | 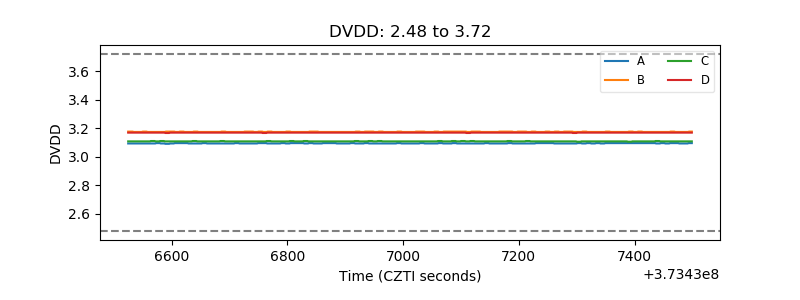 |
| Temperature 1 | 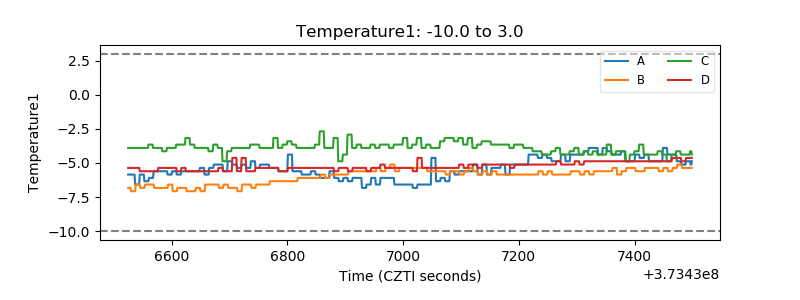 |
| Veto HV Monitor | 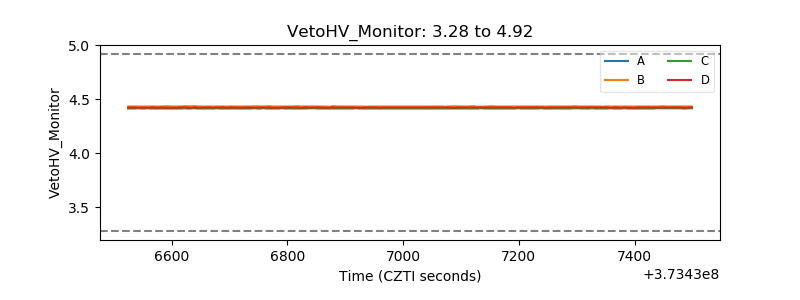 |
| Veto LLD | 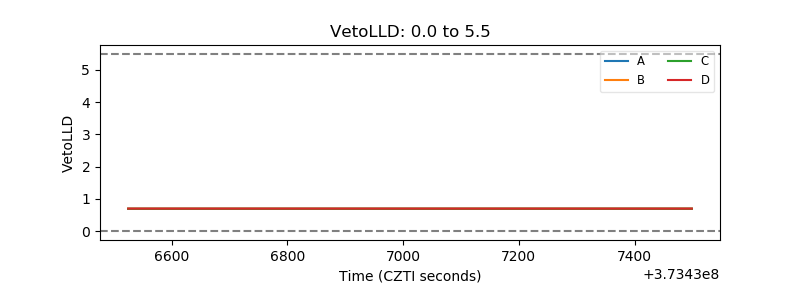 |
| Alpha Counter | 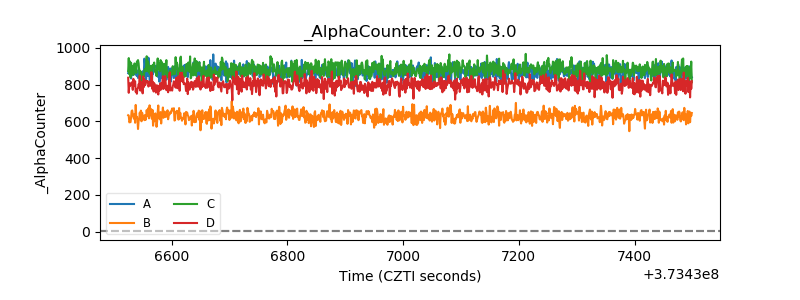 |
| _CPM_Rate | 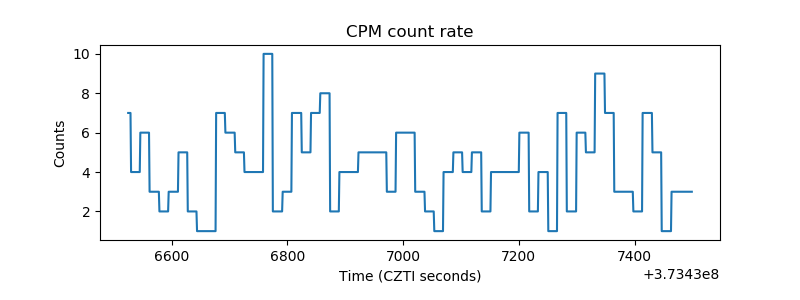 |
| CZT Counter | 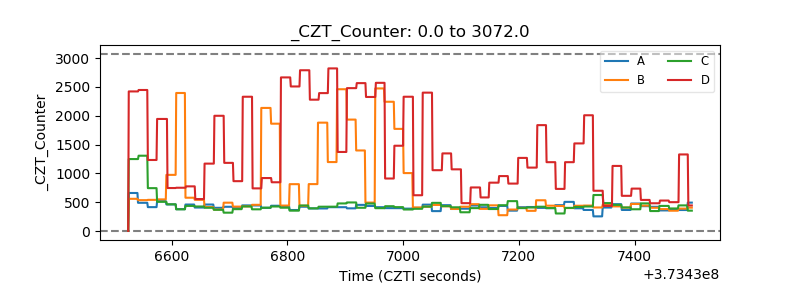 |
| +2.5 Volts monitor |  |
| +5 Volts monitor |  |
| _ROLL_ROT | 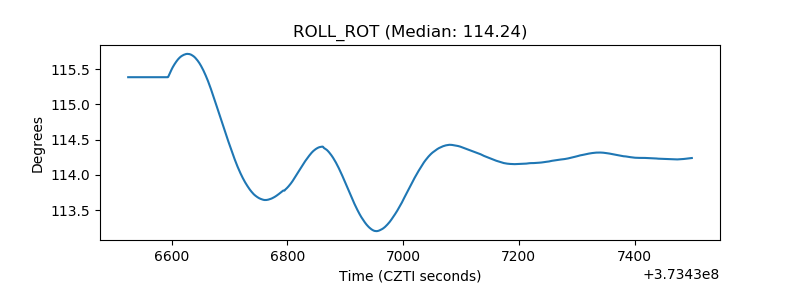 |
| _Roll_DEC | 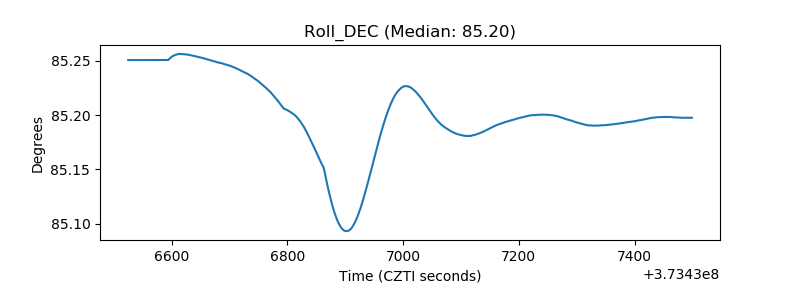 |
| _Roll_RA | 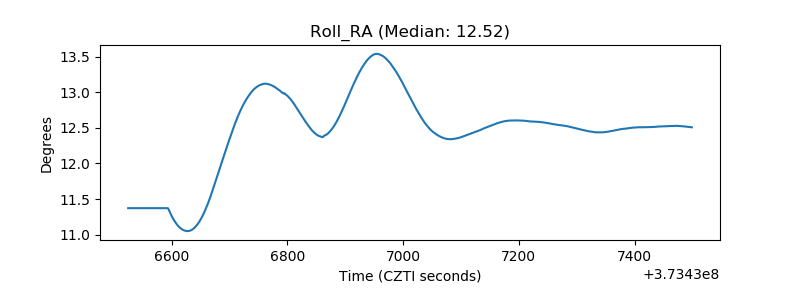 |
| Veto Counter | 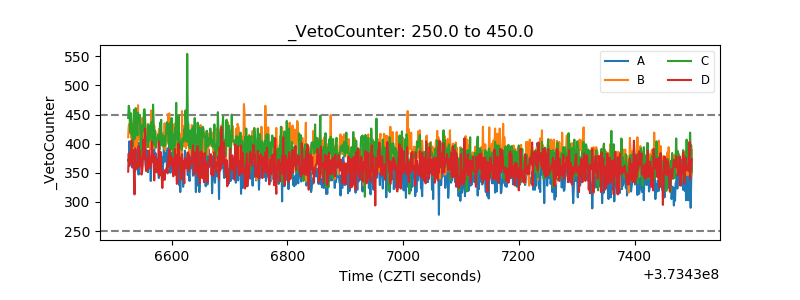 |