| Param | Original file | Final file |
|---|---|---|
| Filename | modeM0/AS1T04_065T01_9000004750_32950cztM0_level2.evt | modeM0/AS1T04_065T01_9000004750_32950cztM0_level2_quad_clean.evt |
| Size (bytes) | 627,264,000 | 99,636,480 |
| Size | 598.2 MB | 95.0 MB |
| Events in quadrant A | 2,564,465 | 702,984 |
| Events in quadrant B | 4,220,582 | 686,922 |
| Events in quadrant C | 2,582,402 | 714,634 |
| Events in quadrant D | 9,243,533 | 513,546 |
| Mode M0 | |||
|---|---|---|---|
| Quadrant | BADHDUFLAG | Total packets | Discarded packets |
| A | 0 | 11498 | 2 |
| B | 0 | 16263 | 1 |
| C | 0 | 11633 | 1 |
| D | 0 | 31391 | 1 |
| Mode SS | |||
|---|---|---|---|
| Quadrant | BADHDUFLAG | Total packets | Discarded packets |
| A | 0 | 116 | 0 |
| B | 0 | 116 | 0 |
| C | 0 | 116 | 0 |
| D | 0 | 116 | 0 |
| Mode M9 | |||
|---|---|---|---|
| Quadrant | BADHDUFLAG | Total packets | Discarded packets |
| A | 0 | 14 | 0 |
| B | 0 | 14 | 0 |
| C | 0 | 14 | 0 |
| D | 0 | 14 | 0 |
| Quadrant | Total seconds | Saturated seconds | Saturation percentage |
|---|---|---|---|
| A | 5694 | 7 | 0.122936% |
| B | 5694 | 602 | 10.572532% |
| C | 5694 | 15 | 0.263435% |
| D | 5694 | 2245 | 39.427468% |
Noise dominated data is calculated using 1-second bins in cleaned event files. If a bin has >2000 counts, and if more than 50% of those come from <1% of pixels, then it is considered to be noise-dominated and hence unusable.
| Quadrant | # 1 sec bins | Bins with >0 counts | Bins with >2000 counts | High rate bins dominated by noise | Noise dominated (total time) | Noise dominated (detector-on time) | Marked lightcurve |
|---|---|---|---|---|---|---|---|
| A | 7068 | 5695 | 1 | 1 | 0.01% | 0.02% | 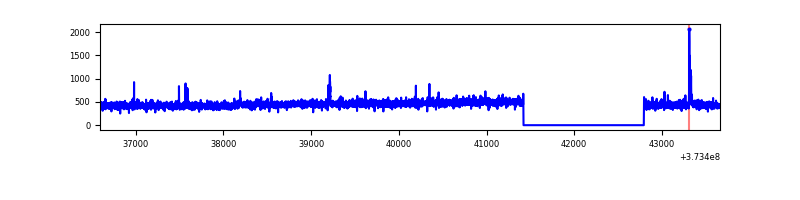 |
| B | 7068 | 5695 | 422 | 422 | 5.97% | 7.41% | 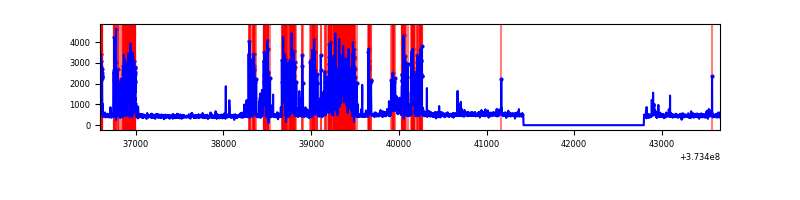 |
| C | 7068 | 5695 | 9 | 9 | 0.13% | 0.16% |  |
| D | 7068 | 5695 | 2067 | 2067 | 29.24% | 36.29% | 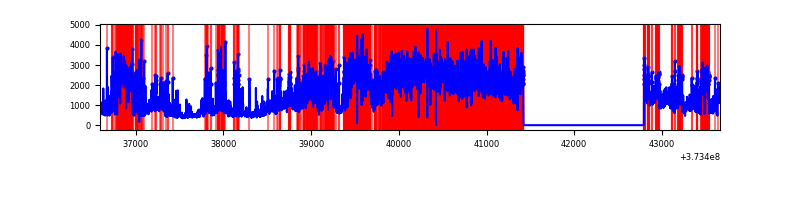 |
Top three noisy pixels from each quadrant. If the there are fewer than three noisy pixels in the level2.evt file, extra rows are filled as -1
| Pixel properties | Quadrant properties | ||||||
|---|---|---|---|---|---|---|---|
| Quadrant | DetID | PixID | Counts | Sigma | Mean | Median | Sigma |
| A | 0 | 191 | 24024 | 181.22 | 645 | 633 | 129.1 |
| A | 14 | 238 | 15708 | 116.79 | 645 | 633 | 129.1 |
| A | 3 | 252 | 13757 | 101.68 | 645 | 633 | 129.1 |
| B | 5 | 172 | 1572841 | 13343.25 | 619 | 604 | 117.8 |
| B | 15 | 54 | 49637 | 416.13 | 619 | 604 | 117.8 |
| B | 5 | 200 | 39268 | 328.13 | 619 | 604 | 117.8 |
| C | 1 | 241 | 34218 | 232.61 | 631 | 634 | 144.4 |
| C | 0 | 10 | 29153 | 197.53 | 631 | 634 | 144.4 |
| C | 15 | 159 | 15632 | 103.88 | 631 | 634 | 144.4 |
| D | 12 | 227 | 4457171 | 34603.04 | 500 | 488 | 128.8 |
| D | 8 | 195 | 1098968 | 8528.93 | 500 | 488 | 128.8 |
| D | 7 | 80 | 570288 | 4424.1 | 500 | 488 | 128.8 |
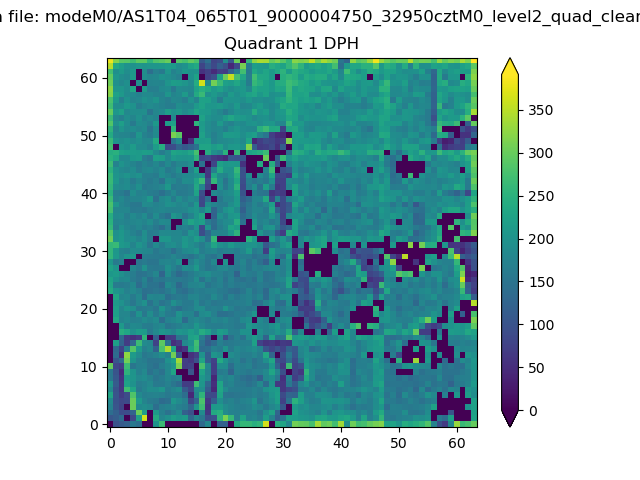
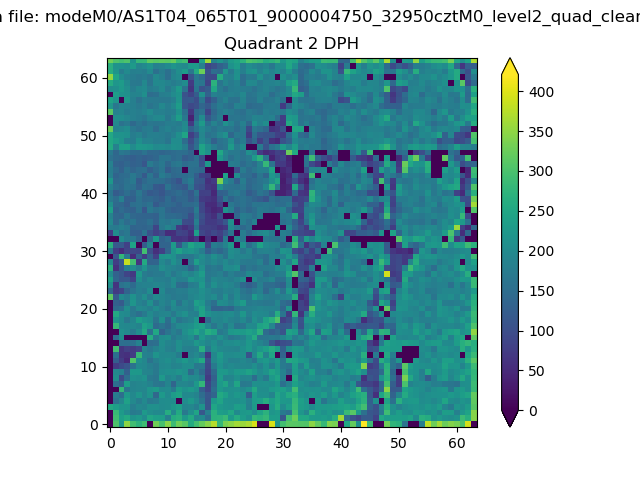
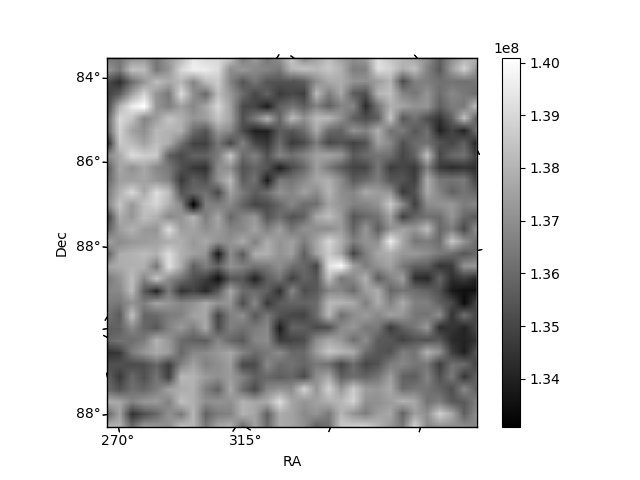
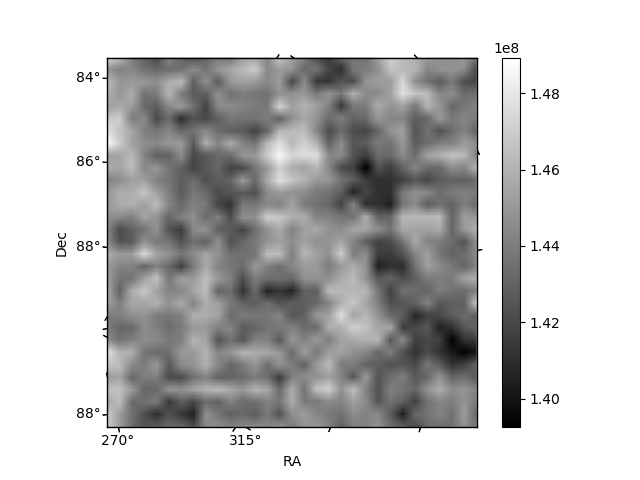
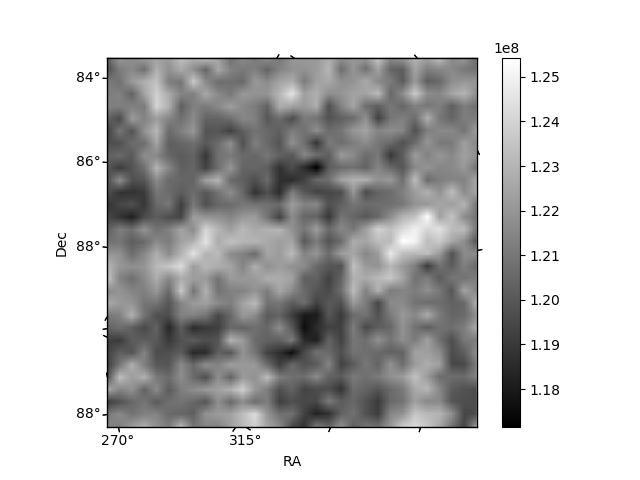
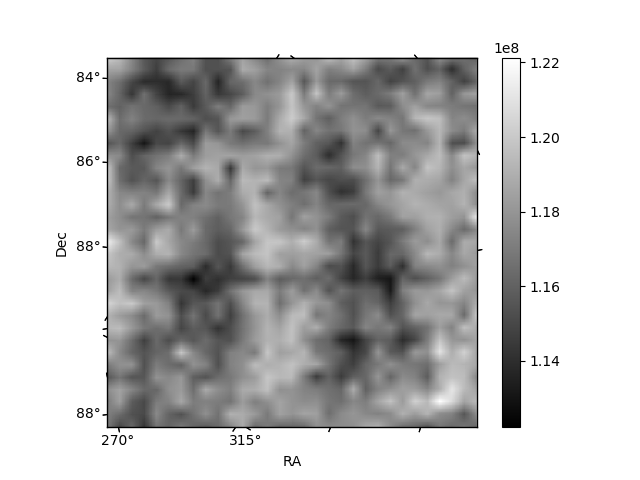
Histogram calculated using DETX and DETY for each event in the final _common_clean file
| Quadrant A | 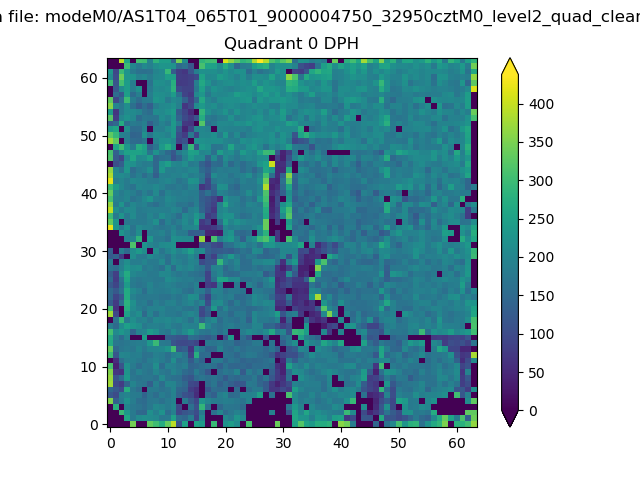 |
 |
Quadrant B |
|---|---|---|---|
| Quadrant D |  |
 |
Quadrant C |
| Plot type | Count rate plots | Images |
|---|---|---|
| Comparison with Poisson distribution Blue bars denote a histogram of data divided into 1 sec bins. Red curve is a Poisson curve with rate = median count rate of data. |
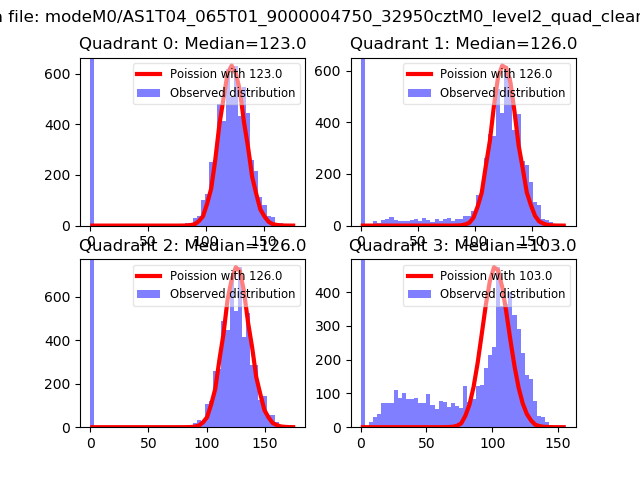 |
 |
| Quadrant-wise count rates Data is divided into 100 sec bins |
 |
|
| Module-wise count rates for Quadrant A Data is divided into 100 sec bins |
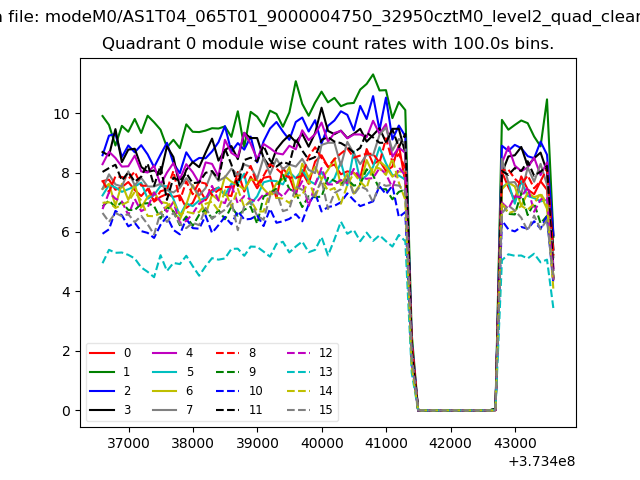 |
 |
| Module-wise count rates for Quadrant B Data is divided into 100 sec bins |
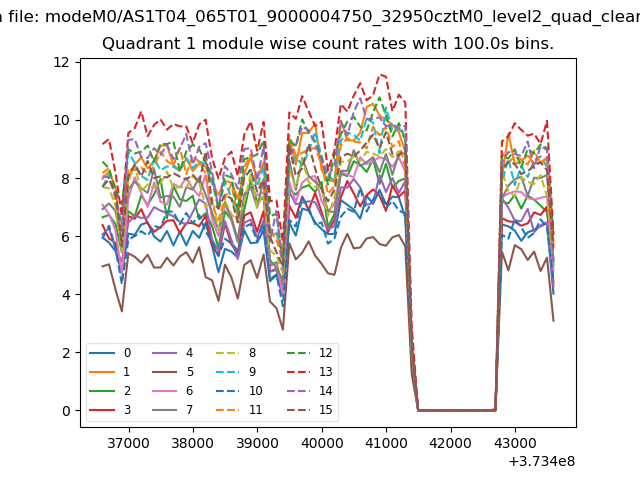 |
 |
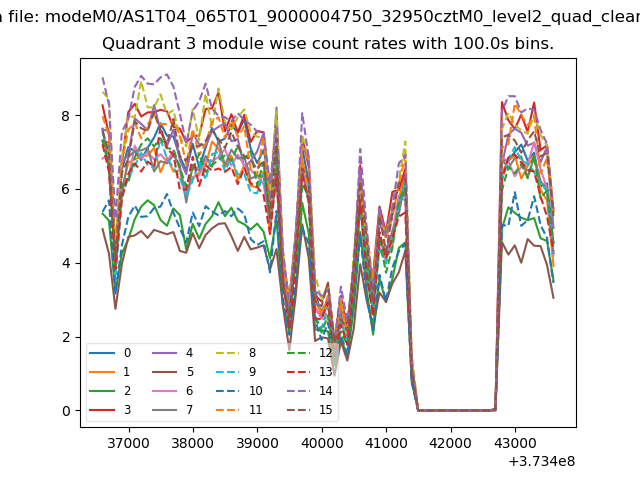
| Module-wise count rates for Quadrant C Data is divided into 100 sec bins |
 |
 |
| Module-wise count rates for Quadrant D Data is divided into 100 sec bins |
 |
 |
| Parameter | Plot |
|---|---|
| CZT HV Monitor | 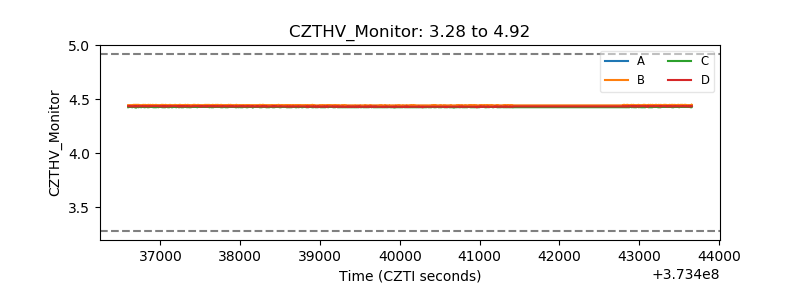 |
| D_VDD | 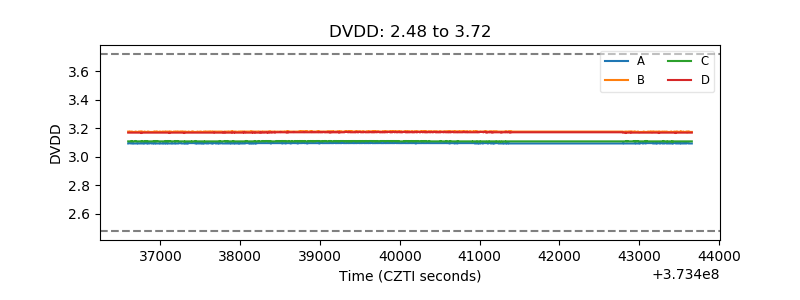 |
| Temperature 1 | 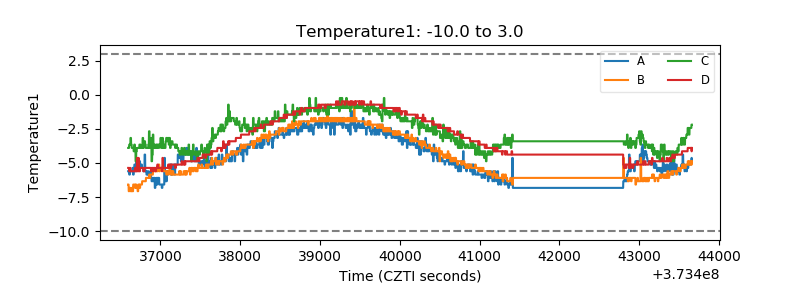 |
| Veto HV Monitor |  |
| Veto LLD | 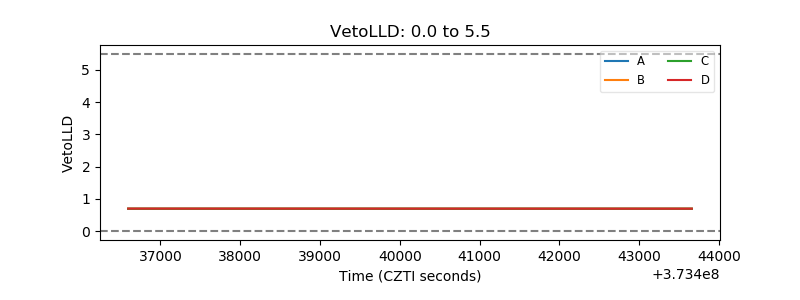 |
| Alpha Counter | 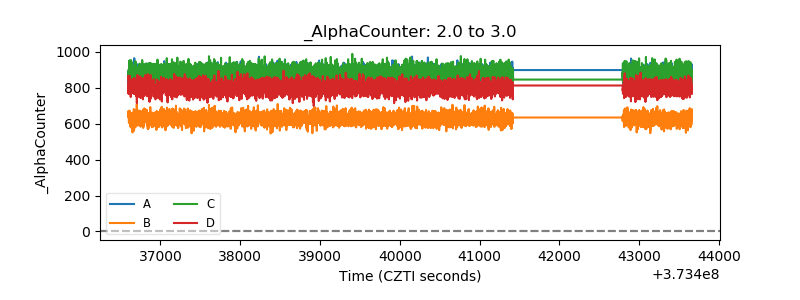 |
| _CPM_Rate |  |
| CZT Counter |  |
| +2.5 Volts monitor |  |
| +5 Volts monitor |  |
| _ROLL_ROT | 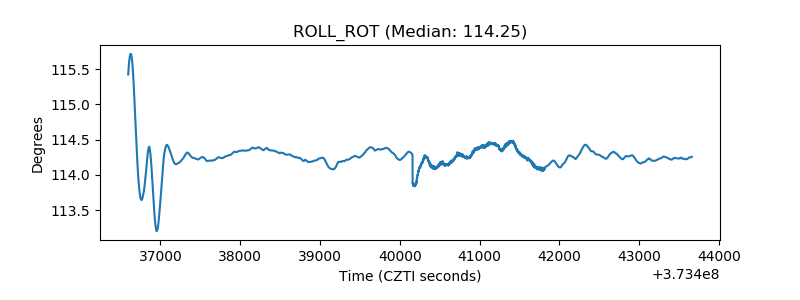 |
| _Roll_DEC | 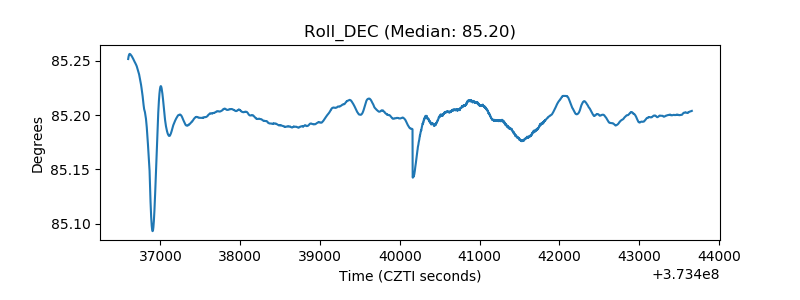 |
| _Roll_RA | 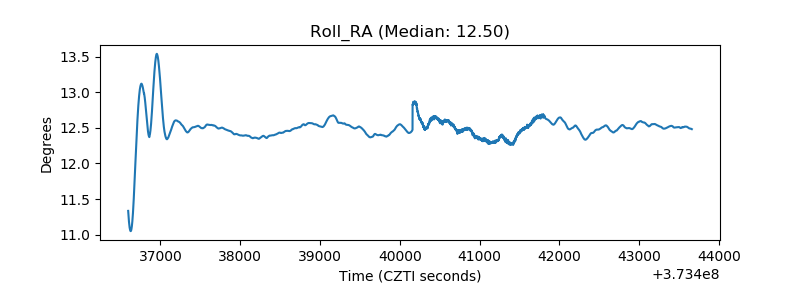 |
| Veto Counter | 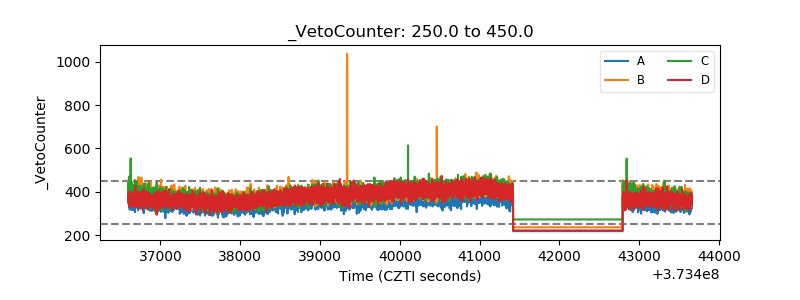 |