| Param | Original file | Final file |
|---|---|---|
| Filename | modeM0/AS1T04_065T01_9000004750_32951cztM0_level2.evt | modeM0/AS1T04_065T01_9000004750_32951cztM0_level2_quad_clean.evt |
| Size (bytes) | 603,757,440 | 85,481,280 |
| Size | 575.8 MB | 81.5 MB |
| Events in quadrant A | 2,246,029 | 613,579 |
| Events in quadrant B | 3,303,397 | 616,789 |
| Events in quadrant C | 2,309,536 | 617,264 |
| Events in quadrant D | 10,089,768 | 391,696 |
| Mode M0 | |||
|---|---|---|---|
| Quadrant | BADHDUFLAG | Total packets | Discarded packets |
| A | 0 | 10056 | 1 |
| B | 0 | 12965 | 1 |
| C | 0 | 10195 | 1 |
| D | 0 | 33397 | 1 |
| Mode SS | |||
|---|---|---|---|
| Quadrant | BADHDUFLAG | Total packets | Discarded packets |
| A | 0 | 102 | 0 |
| B | 0 | 102 | 0 |
| C | 0 | 102 | 0 |
| D | 0 | 102 | 0 |
| Mode M9 | |||
|---|---|---|---|
| Quadrant | BADHDUFLAG | Total packets | Discarded packets |
| A | 0 | 7 | 0 |
| B | 0 | 7 | 0 |
| C | 0 | 7 | 0 |
| D | 0 | 8 | 0 |
| Quadrant | Total seconds | Saturated seconds | Saturation percentage |
|---|---|---|---|
| A | 4957 | 7 | 0.141214% |
| B | 4957 | 279 | 5.628404% |
| C | 4957 | 7 | 0.141214% |
| D | 4957 | 2913 | 58.765382% |
Noise dominated data is calculated using 1-second bins in cleaned event files. If a bin has >2000 counts, and if more than 50% of those come from <1% of pixels, then it is considered to be noise-dominated and hence unusable.
| Quadrant | # 1 sec bins | Bins with >0 counts | Bins with >2000 counts | High rate bins dominated by noise | Noise dominated (total time) | Noise dominated (detector-on time) | Marked lightcurve |
|---|---|---|---|---|---|---|---|
| A | 4957 | 4957 | 2 | 2 | 0.04% | 0.04% | 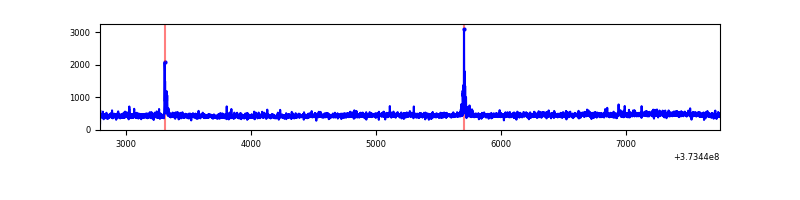 |
| B | 4957 | 4957 | 191 | 191 | 3.85% | 3.85% | 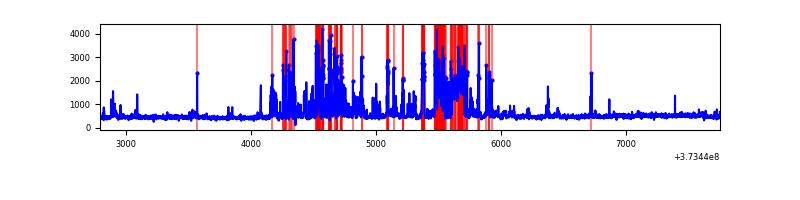 |
| C | 4957 | 4957 | 8 | 8 | 0.16% | 0.16% | 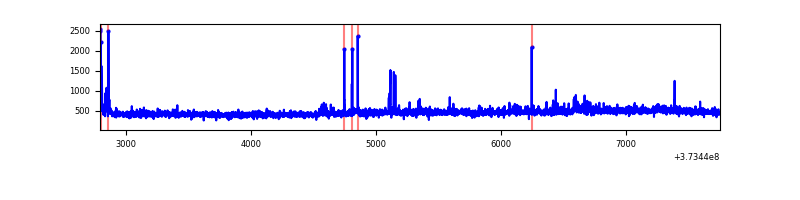 |
| D | 4957 | 4957 | 2736 | 2736 | 55.19% | 55.19% | 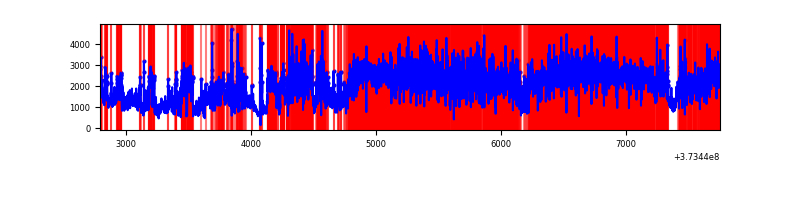 |
Top three noisy pixels from each quadrant. If the there are fewer than three noisy pixels in the level2.evt file, extra rows are filled as -1
| Pixel properties | Quadrant properties | ||||||
|---|---|---|---|---|---|---|---|
| Quadrant | DetID | PixID | Counts | Sigma | Mean | Median | Sigma |
| A | 0 | 191 | 40503 | 347.3 | 565 | 553 | 115.0 |
| A | 14 | 238 | 13362 | 111.35 | 565 | 553 | 115.0 |
| A | 13 | 254 | 9044 | 73.82 | 565 | 553 | 115.0 |
| B | 5 | 172 | 870038 | 8135.55 | 558 | 545 | 106.9 |
| B | 0 | 199 | 58118 | 538.69 | 558 | 545 | 106.9 |
| B | 0 | 229 | 28444 | 261.04 | 558 | 545 | 106.9 |
| C | 0 | 10 | 47288 | 362.57 | 553 | 557 | 128.9 |
| C | 3 | 233 | 26816 | 203.73 | 553 | 557 | 128.9 |
| C | 1 | 241 | 20163 | 152.11 | 553 | 557 | 128.9 |
| D | 12 | 227 | 5923422 | 56639.1 | 404 | 394 | 104.6 |
| D | 8 | 195 | 804398 | 7688.31 | 404 | 394 | 104.6 |
| D | 12 | 17 | 552574 | 5280.23 | 404 | 394 | 104.6 |
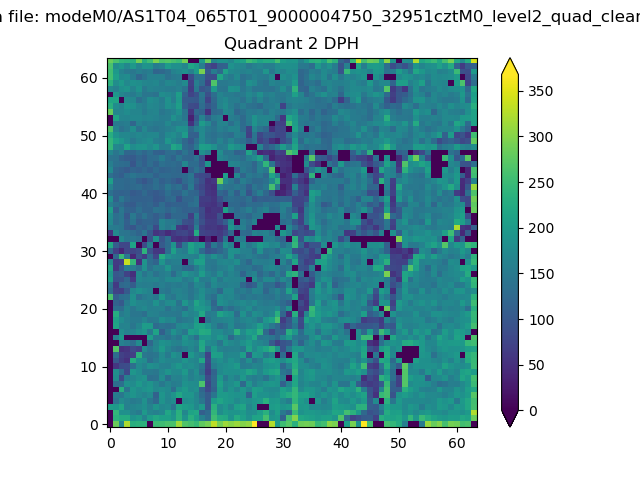
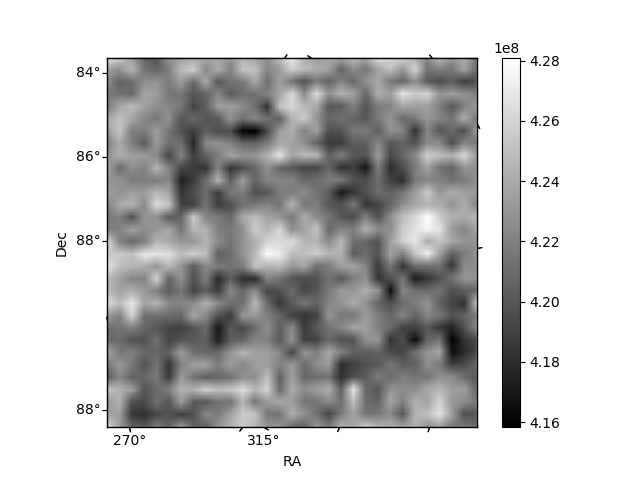
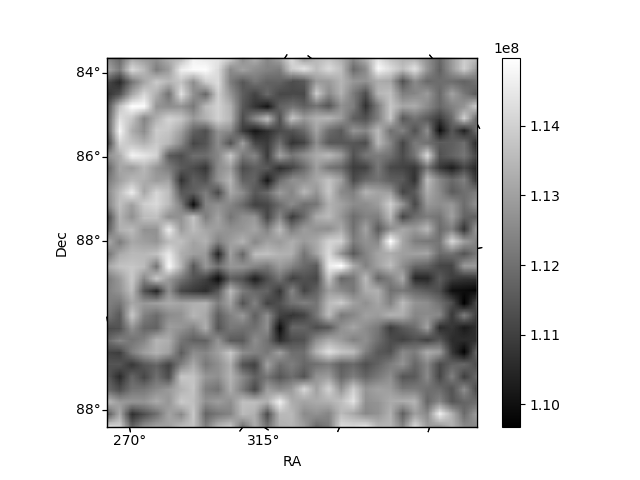
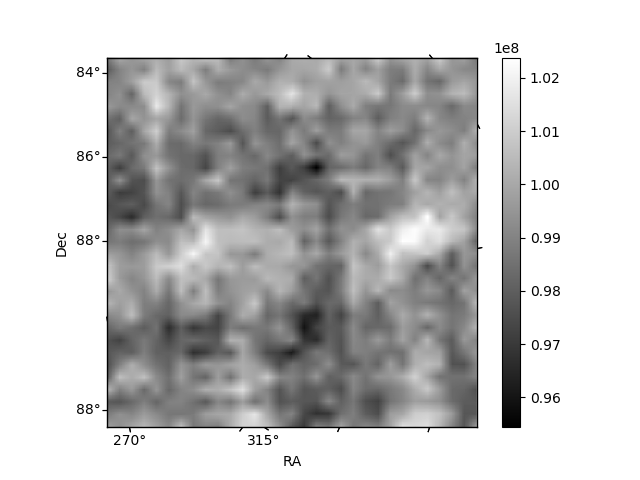
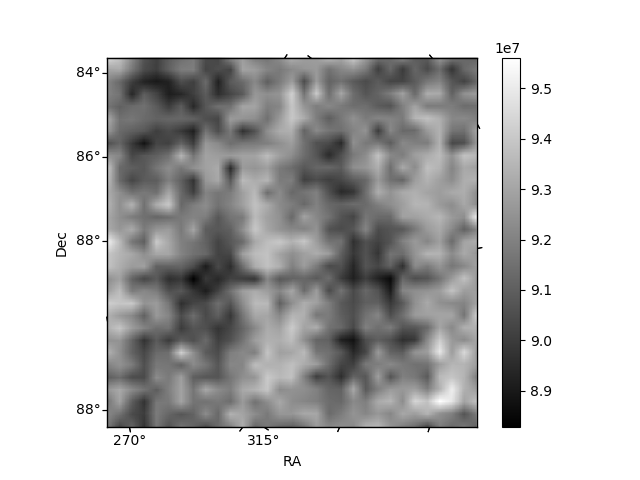
Histogram calculated using DETX and DETY for each event in the final _common_clean file
| Quadrant A | 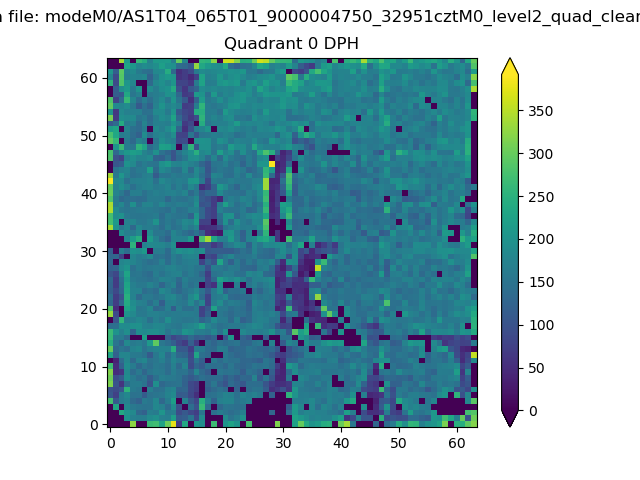 |
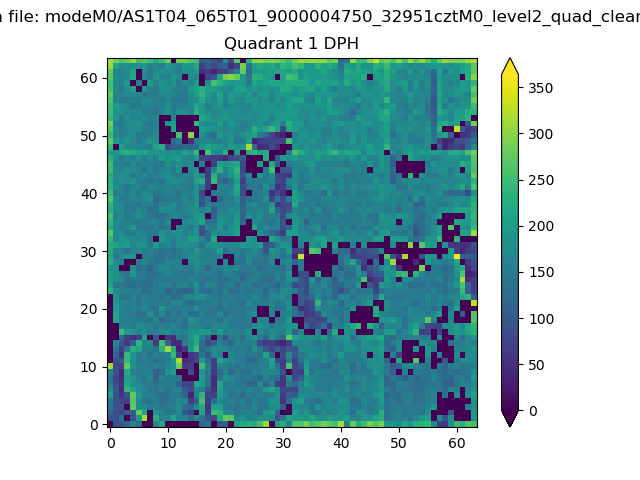 |
Quadrant B |
|---|---|---|---|
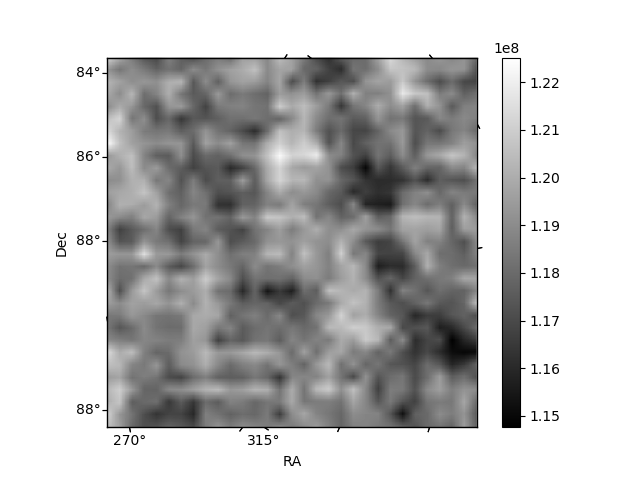
| Quadrant D | 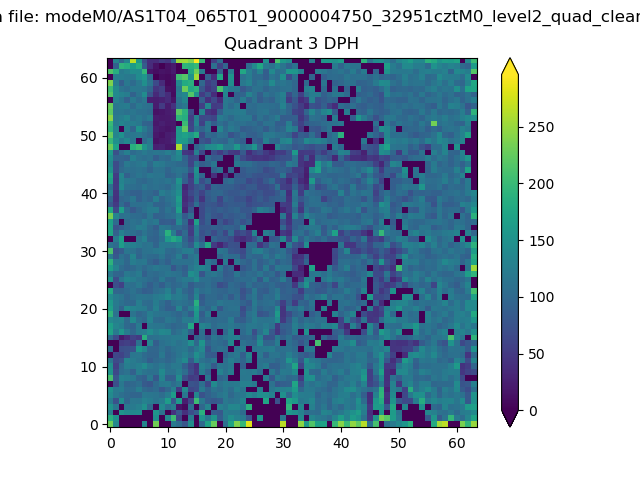 |
 |
Quadrant C |
| Plot type | Count rate plots | Images |
|---|---|---|
| Comparison with Poisson distribution Blue bars denote a histogram of data divided into 1 sec bins. Red curve is a Poisson curve with rate = median count rate of data. |
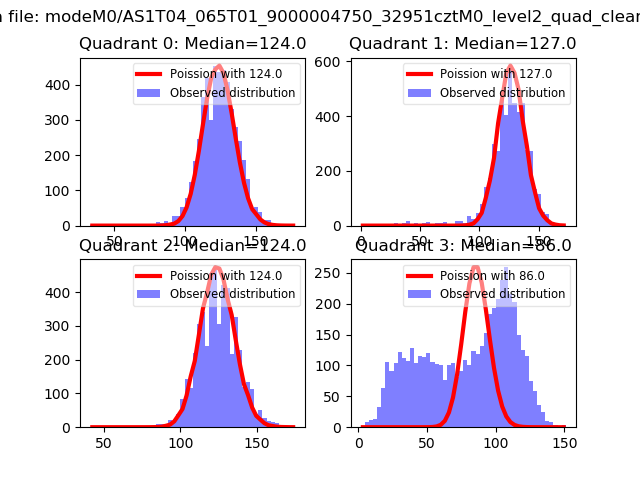 |
 |
| Quadrant-wise count rates Data is divided into 100 sec bins |
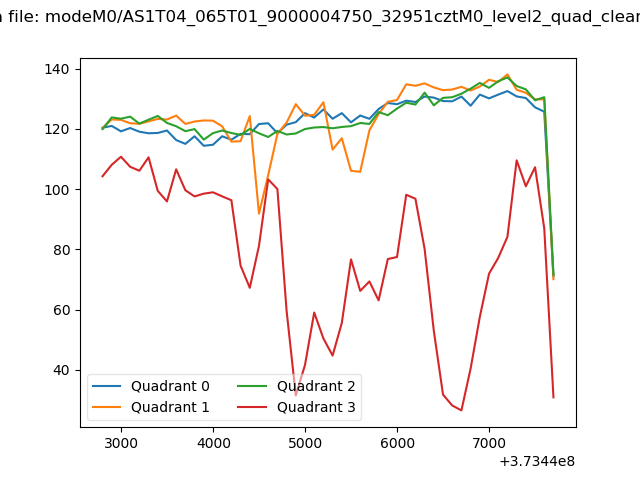 |
|
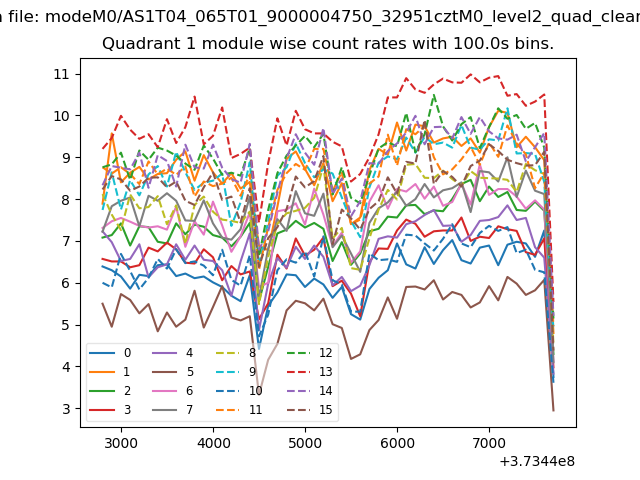
| Module-wise count rates for Quadrant A Data is divided into 100 sec bins |
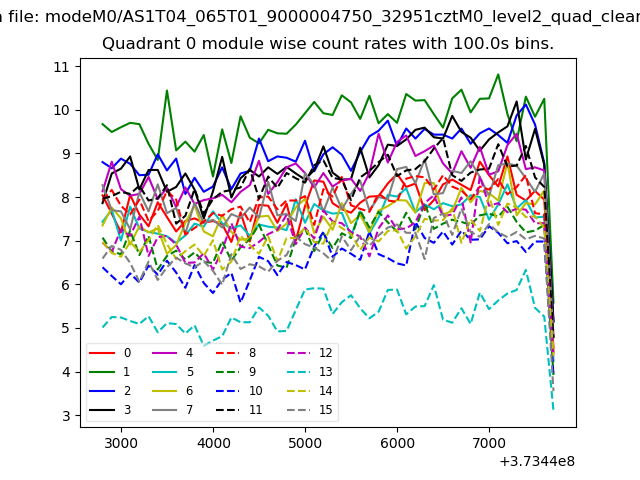 |
 |
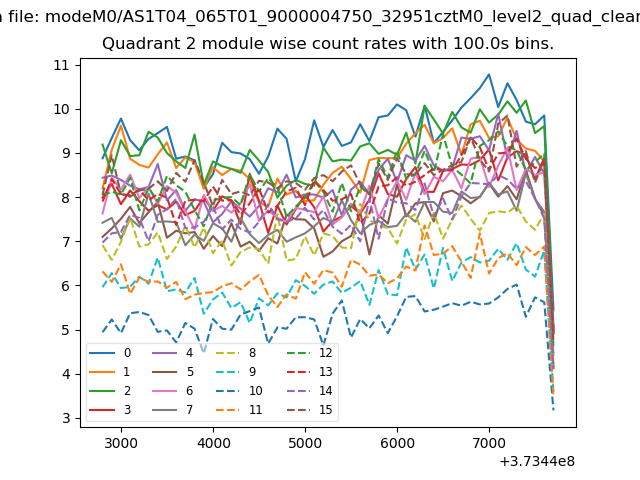
| Module-wise count rates for Quadrant B Data is divided into 100 sec bins |
 |
 |
| Module-wise count rates for Quadrant C Data is divided into 100 sec bins |
 |
 |
| Module-wise count rates for Quadrant D Data is divided into 100 sec bins |
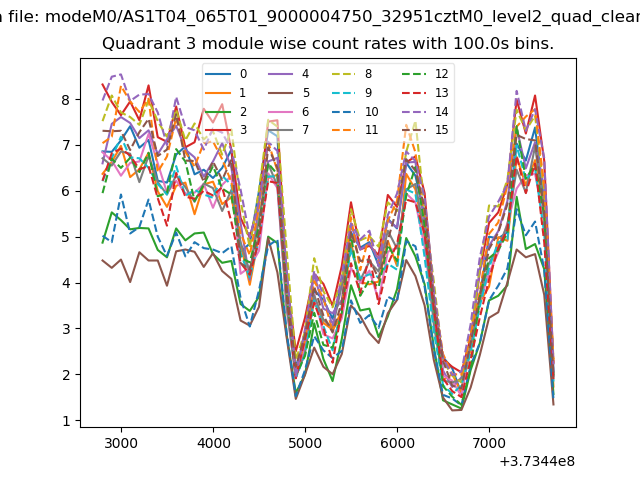 |
 |
| Parameter | Plot |
|---|---|
| CZT HV Monitor | 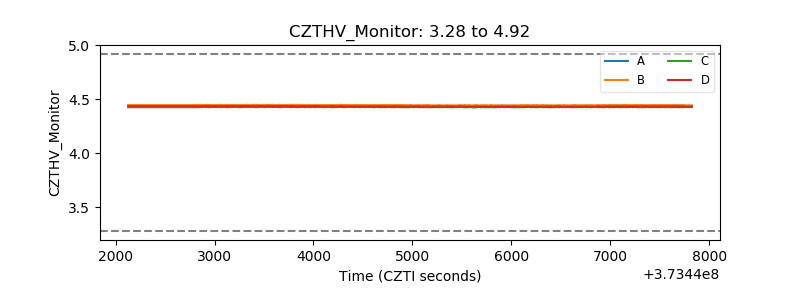 |
| D_VDD | 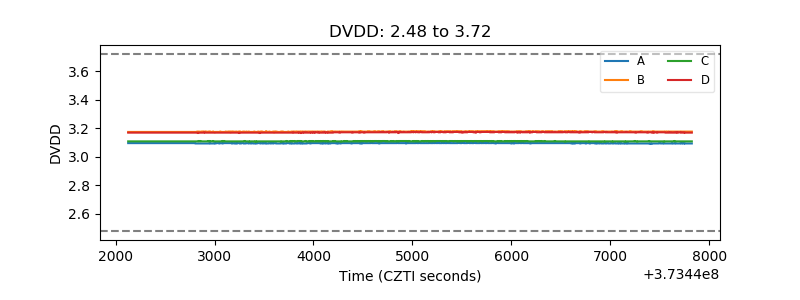 |
| Temperature 1 | 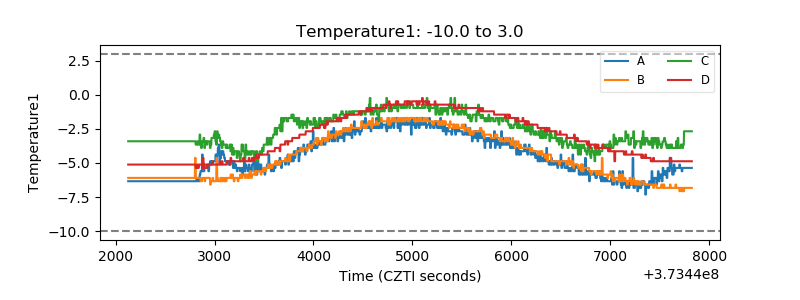 |
| Veto HV Monitor |  |
| Veto LLD | 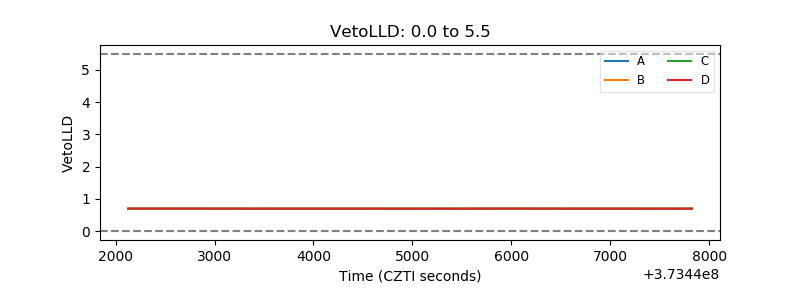 |
| Alpha Counter | 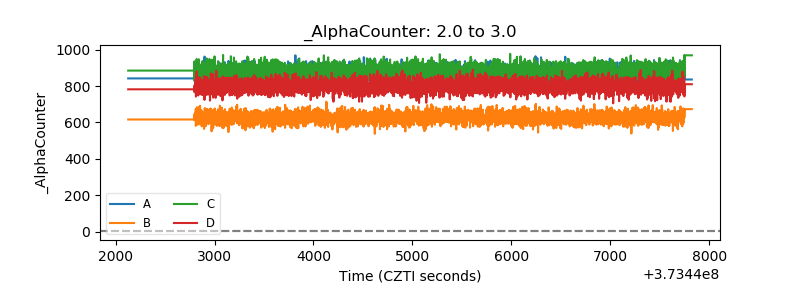 |
| _CPM_Rate | 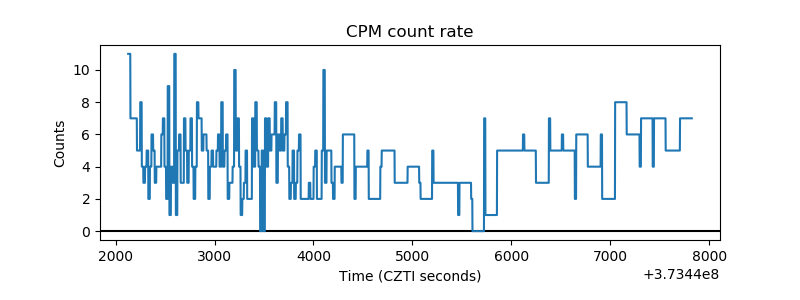 |
| CZT Counter | 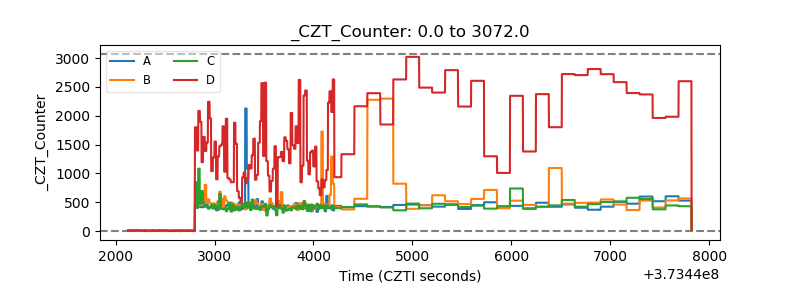 |
| +2.5 Volts monitor |  |
| +5 Volts monitor |  |
| _ROLL_ROT | 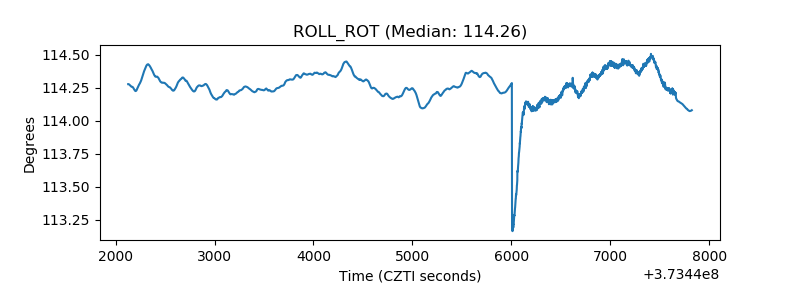 |
| _Roll_DEC | 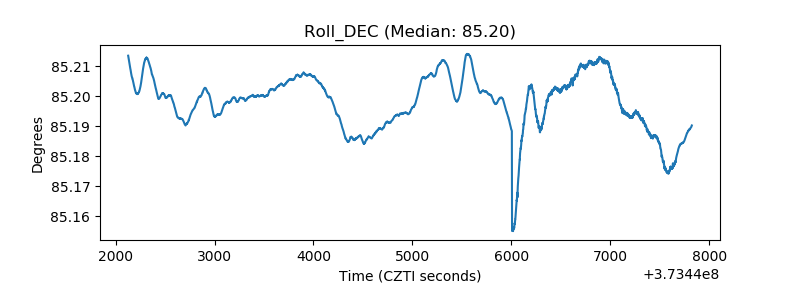 |
| _Roll_RA | 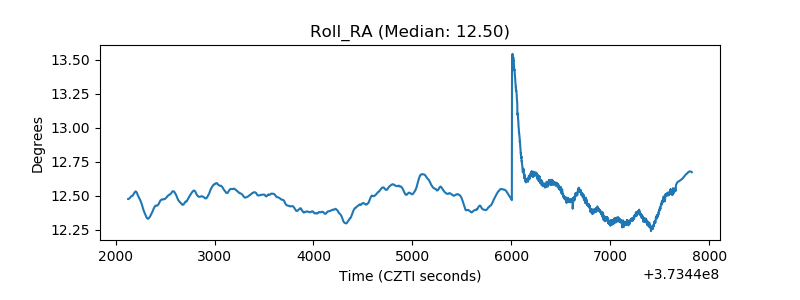 |
| Veto Counter | 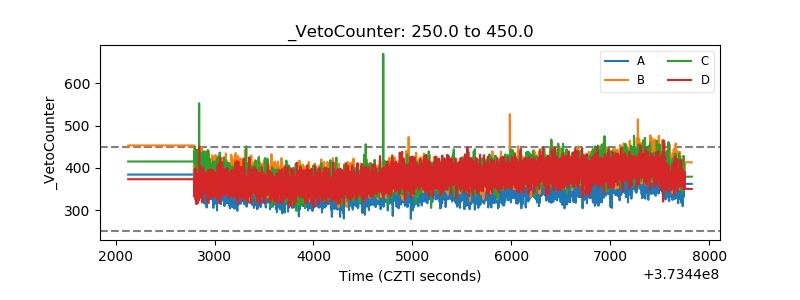 |