| Param | Original file | Final file |
|---|---|---|
| Filename | modeM0/AS1C07_003T01_9000004754cztM0_level2.fits | modeM0/AS1C07_003T01_9000004754cztM0_level2_quad_clean.evt |
| Size (bytes) | 898,608,960 | 805,936,320 |
| Size | 857.0 MB | 768.6 MB |
| Events in quadrant A | 5,573,828 | 4,792,355 |
| Events in quadrant B | 5,298,934 | 4,720,624 |
| Events in quadrant C | 5,392,674 | 4,512,509 |
| Events in quadrant D | 4,602,370 | 4,035,624 |
| Mode SS | |||
|---|---|---|---|
| Quadrant | BADHDUFLAG | Total packets | Discarded packets |
| A | 0 | 1896 | 0 |
| B | 0 | 1896 | 0 |
| C | 0 | 1894 | 0 |
| D | 0 | 1896 | 0 |
| Mode M9 | |||
|---|---|---|---|
| Quadrant | BADHDUFLAG | Total packets | Discarded packets |
| A | 0 | 370 | 0 |
| B | 0 | 370 | 0 |
| C | 0 | 370 | 0 |
| D | 0 | 370 | 0 |
| Mode M0 | |||
|---|---|---|---|
| Quadrant | BADHDUFLAG | Total packets | Discarded packets |
| A | 0 | 188277 | 0 |
| B | 0 | 219717 | 0 |
| C | 0 | 196956 | 0 |
| D | 0 | 269907 | 0 |
| Quadrant | Total seconds | Saturated seconds | Saturation percentage |
|---|---|---|---|
| A | 92569 | 110 | 0.118830% |
| B | 92565 | 3284 | 3.547777% |
| C | 92571 | 1031 | 1.113740% |
| D | 92573 | 2873 | 3.103497% |
Noise dominated data is calculated using 1-second bins in cleaned event files. If a bin has >2000 counts, and if more than 50% of those come from <1% of pixels, then it is considered to be noise-dominated and hence unusable.
| Quadrant | # 1 sec bins | Bins with >0 counts | Bins with >2000 counts | High rate bins dominated by noise | Noise dominated (total time) | Noise dominated (detector-on time) | Marked lightcurve |
|---|---|---|---|---|---|---|---|
| A | 129749 | 92581 | 0 | 0 | 0.00% | 0.00% | 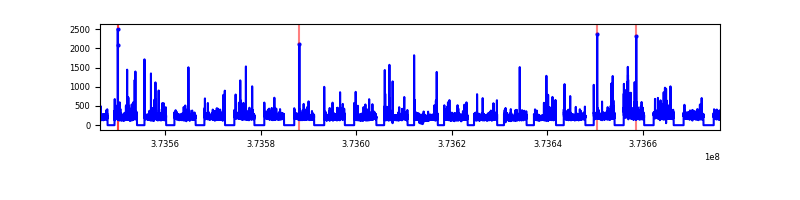 |
| B | 129749 | 92523 | 0 | 0 | 0.00% | 0.00% |  |
| C | 129749 | 92398 | 0 | 0 | 0.00% | 0.00% |  |
| D | 129749 | 92566 | 0 | 0 | 0.00% | 0.00% |  |
Top three noisy pixels from each quadrant. If the there are fewer than three noisy pixels in the level2.evt file, extra rows are filled as -1
| Pixel properties | Quadrant properties | ||||||
|---|---|---|---|---|---|---|---|
| Quadrant | DetID | PixID | Counts | Sigma | Mean | Median | Sigma |
| A | 9 | 19 | 4540 | 8.9 | 1454 | 1370 | 356.2 |
| A | 7 | 110 | 4513 | 8.82 | 1454 | 1370 | 356.2 |
| A | 0 | 29 | 4408 | 8.53 | 1454 | 1370 | 356.2 |
| B | 2 | 9 | 4557 | 11.57 | 1402 | 1337 | 278.3 |
| B | 3 | 80 | 4099 | 9.92 | 1402 | 1337 | 278.3 |
| B | 2 | 8 | 3594 | 8.11 | 1402 | 1337 | 278.3 |
| C | 1 | 81 | 4389 | 8.48 | 1426 | 1339 | 359.5 |
| C | 1 | 80 | 4246 | 8.09 | 1426 | 1339 | 359.5 |
| C | 3 | 202 | 4204 | 7.97 | 1426 | 1339 | 359.5 |
| D | 10 | 189 | 3425 | 6.32 | 1316 | 1198 | 352.3 |
| D | 7 | 3 | 3401 | 6.25 | 1316 | 1198 | 352.3 |
| D | 4 | 160 | 3374 | 6.18 | 1316 | 1198 | 352.3 |
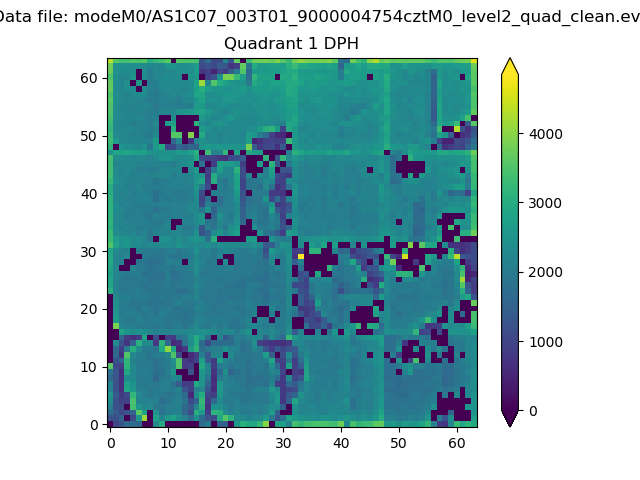
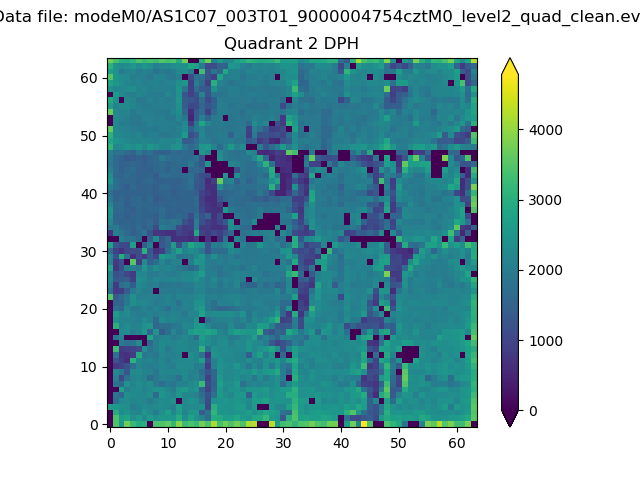
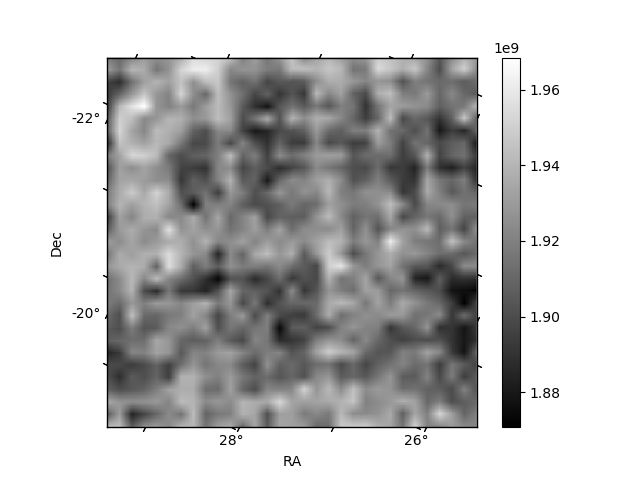
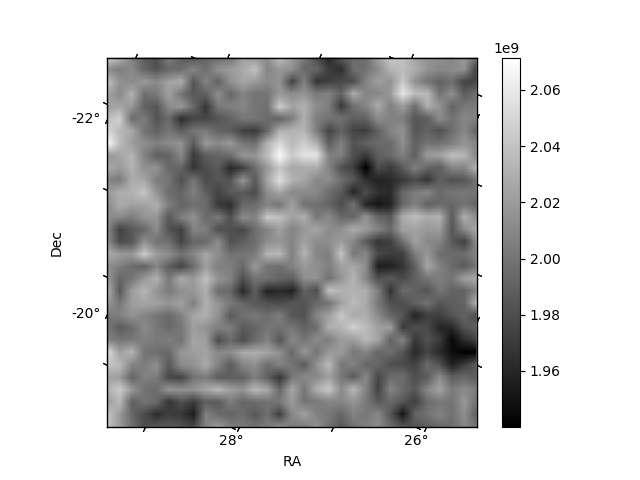
Histogram calculated using DETX and DETY for each event in the final _common_clean file
| Quadrant A |  |
 |
Quadrant B |
|---|---|---|---|
| Quadrant D |  |
 |
Quadrant C |
| Plot type | Count rate plots | Images |
|---|---|---|
| Comparison with Poisson distribution Blue bars denote a histogram of data divided into 1 sec bins. Red curve is a Poisson curve with rate = median count rate of data. |
 |
 |
| Quadrant-wise count rates Data is divided into 100 sec bins |
 |
|
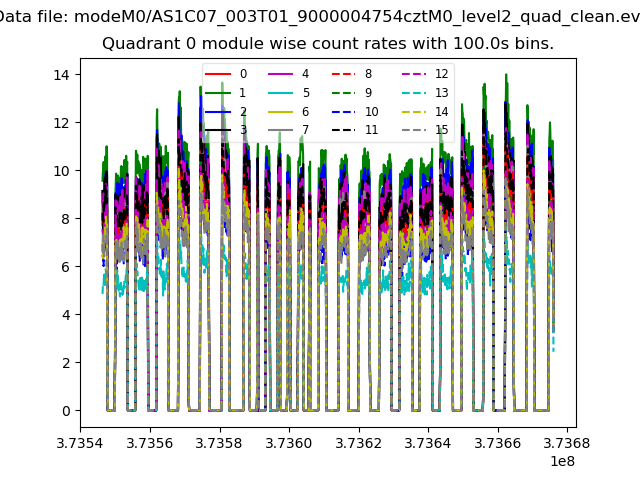
| Module-wise count rates for Quadrant A Data is divided into 100 sec bins |
 |
 |
| Module-wise count rates for Quadrant B Data is divided into 100 sec bins |
 |
 |
| Module-wise count rates for Quadrant C Data is divided into 100 sec bins |
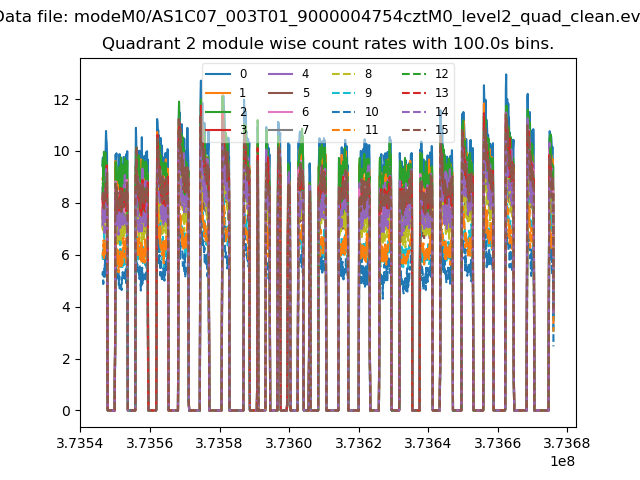 |
 |
| Module-wise count rates for Quadrant D Data is divided into 100 sec bins |
 |
 |
| Parameter | Plot |
|---|---|
| CZT HV Monitor |  |
| D_VDD |  |
| Temperature 1 | 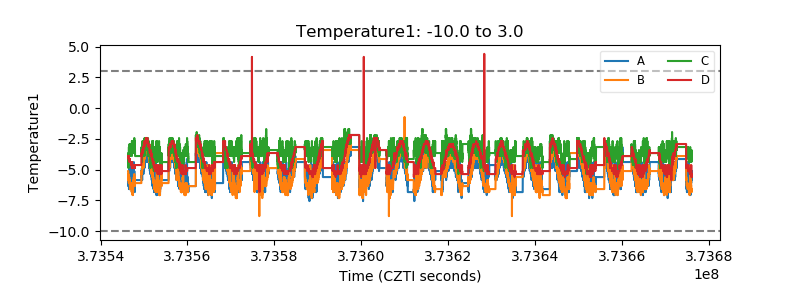 |
| Veto HV Monitor |  |
| Veto LLD | 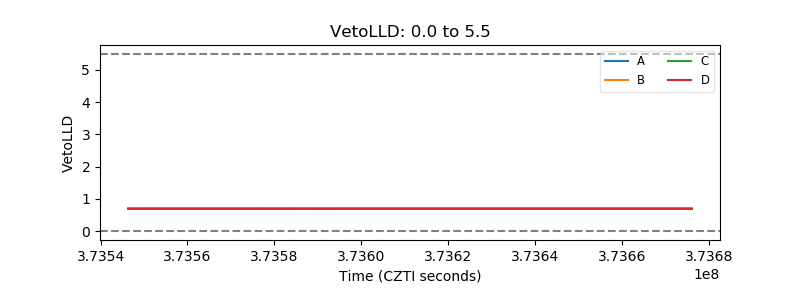 |
| Alpha Counter | 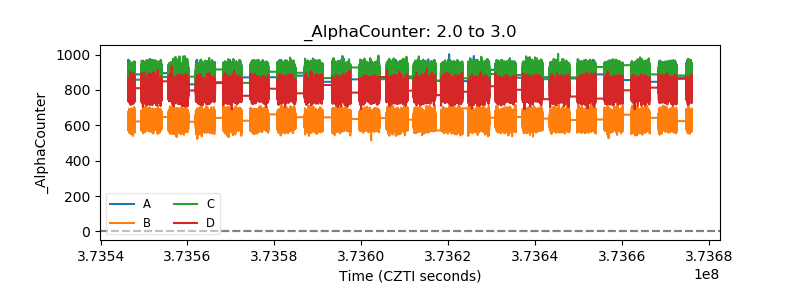 |
| _CPM_Rate |  |
| CZT Counter |  |
| +2.5 Volts monitor |  |
| +5 Volts monitor |  |
| _ROLL_ROT |  |
| _Roll_DEC | 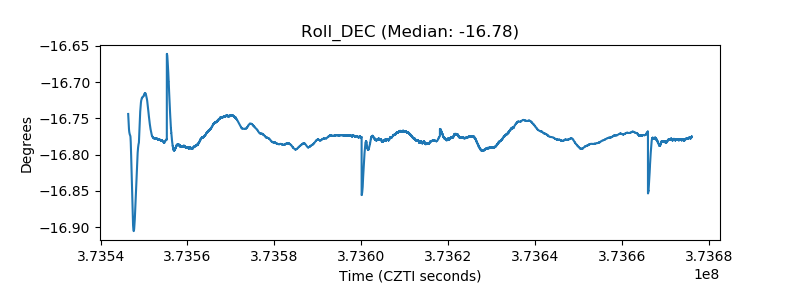 |
| _Roll_RA |  |
| Veto Counter | 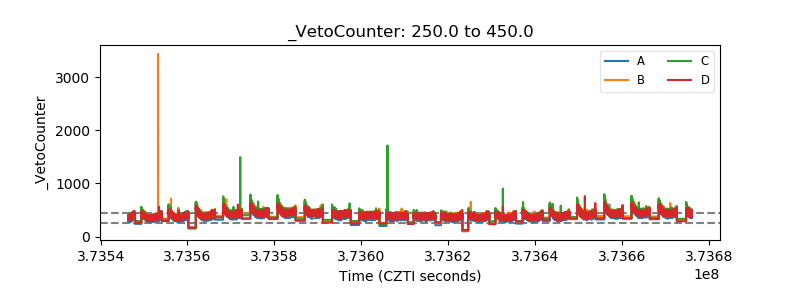 |