| Param | Original file | Final file |
|---|---|---|
| Filename | modeM0/AS1C07_003T01_9000004754_32968cztM0_level2.evt | modeM0/AS1C07_003T01_9000004754_32968cztM0_level2_quad_clean.evt |
| Size (bytes) | 229,985,280 | 35,884,800 |
| Size | 219.3 MB | 34.2 MB |
| Events in quadrant A | 1,241,648 | 230,936 |
| Events in quadrant B | 1,889,537 | 221,616 |
| Events in quadrant C | 1,341,365 | 232,033 |
| Events in quadrant D | 2,313,486 | 214,299 |
| Mode SS | |||
|---|---|---|---|
| Quadrant | BADHDUFLAG | Total packets | Discarded packets |
| A | 0 | 54 | 0 |
| B | 0 | 54 | 0 |
| C | 0 | 54 | 0 |
| D | 0 | 54 | 0 |
| Mode M9 | |||
|---|---|---|---|
| Quadrant | BADHDUFLAG | Total packets | Discarded packets |
| A | 0 | 15 | 0 |
| B | 0 | 15 | 0 |
| C | 0 | 15 | 0 |
| D | 0 | 15 | 0 |
| Mode M0 | |||
|---|---|---|---|
| Quadrant | BADHDUFLAG | Total packets | Discarded packets |
| A | 0 | 5299 | 2 |
| B | 0 | 7125 | 1 |
| C | 0 | 5589 | 1 |
| D | 0 | 8908 | 1 |
| Quadrant | Total seconds | Saturated seconds | Saturation percentage |
|---|---|---|---|
| A | 2613 | 5 | 0.191351% |
| B | 2613 | 247 | 9.452736% |
| C | 2613 | 25 | 0.956755% |
| D | 2613 | 103 | 3.941829% |
Noise dominated data is calculated using 1-second bins in cleaned event files. If a bin has >2000 counts, and if more than 50% of those come from <1% of pixels, then it is considered to be noise-dominated and hence unusable.
| Quadrant | # 1 sec bins | Bins with >0 counts | Bins with >2000 counts | High rate bins dominated by noise | Noise dominated (total time) | Noise dominated (detector-on time) | Marked lightcurve |
|---|---|---|---|---|---|---|---|
| A | 4076 | 2614 | 2 | 2 | 0.05% | 0.08% | 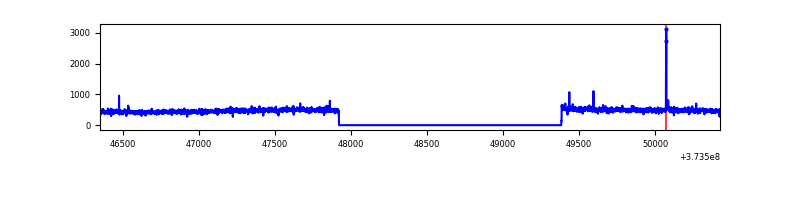 |
| B | 4076 | 2614 | 204 | 204 | 5.00% | 7.80% | 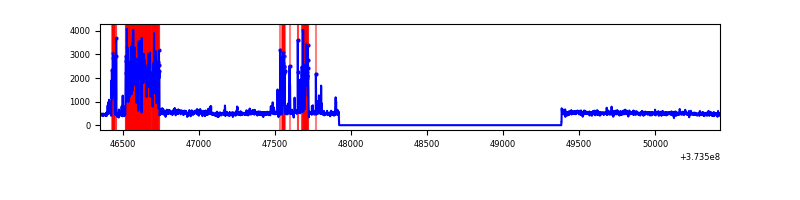 |
| C | 4076 | 2614 | 14 | 14 | 0.34% | 0.54% | 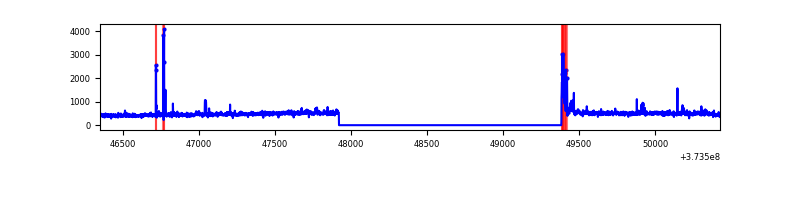 |
| D | 4076 | 2614 | 81 | 81 | 1.99% | 3.10% | 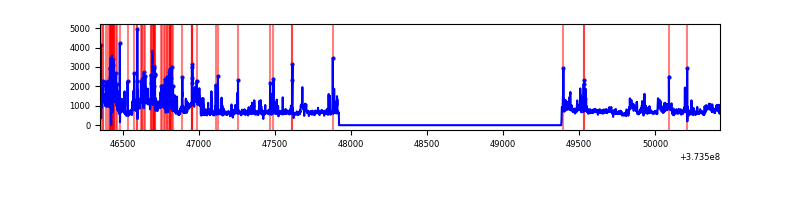 |
Top three noisy pixels from each quadrant. If the there are fewer than three noisy pixels in the level2.evt file, extra rows are filled as -1
| Pixel properties | Quadrant properties | ||||||
|---|---|---|---|---|---|---|---|
| Quadrant | DetID | PixID | Counts | Sigma | Mean | Median | Sigma |
| A | 9 | 143 | 9824 | 144.47 | 315 | 309 | 65.9 |
| A | 13 | 6 | 4877 | 69.36 | 315 | 309 | 65.9 |
| A | 13 | 254 | 4622 | 65.48 | 315 | 309 | 65.9 |
| B | 5 | 200 | 455015 | 7493.37 | 307 | 299 | 60.7 |
| B | 5 | 172 | 147925 | 2432.76 | 307 | 299 | 60.7 |
| B | 0 | 219 | 42785 | 700.14 | 307 | 299 | 60.7 |
| C | 0 | 10 | 80081 | 1093.0 | 310 | 311 | 73.0 |
| C | 1 | 241 | 21574 | 291.34 | 310 | 311 | 73.0 |
| C | 14 | 67 | 10536 | 140.1 | 310 | 311 | 73.0 |
| D | 8 | 195 | 631257 | 7826.18 | 303 | 295 | 80.6 |
| D | 7 | 80 | 143631 | 1777.88 | 303 | 295 | 80.6 |
| D | 13 | 153 | 130269 | 1612.14 | 303 | 295 | 80.6 |
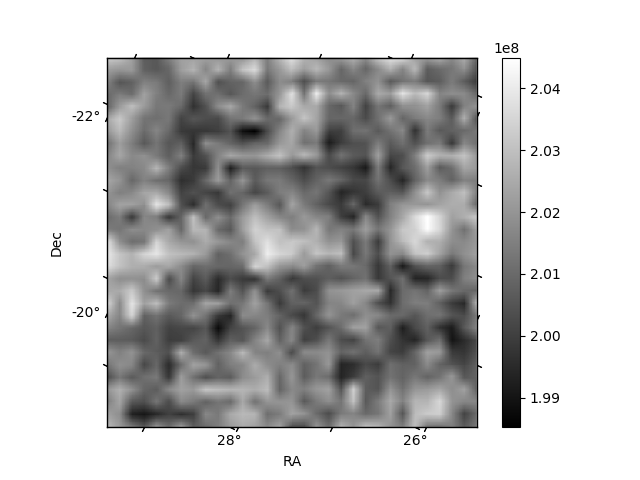
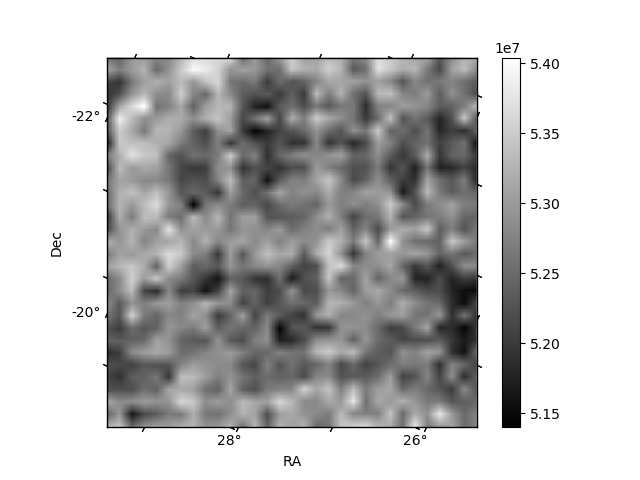
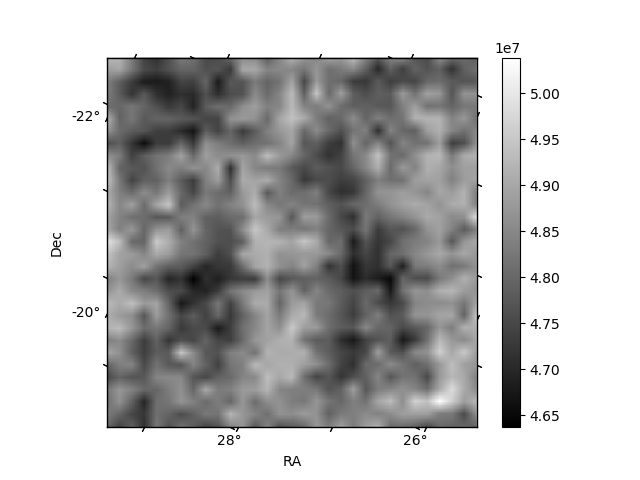
Histogram calculated using DETX and DETY for each event in the final _common_clean file
| Quadrant A | 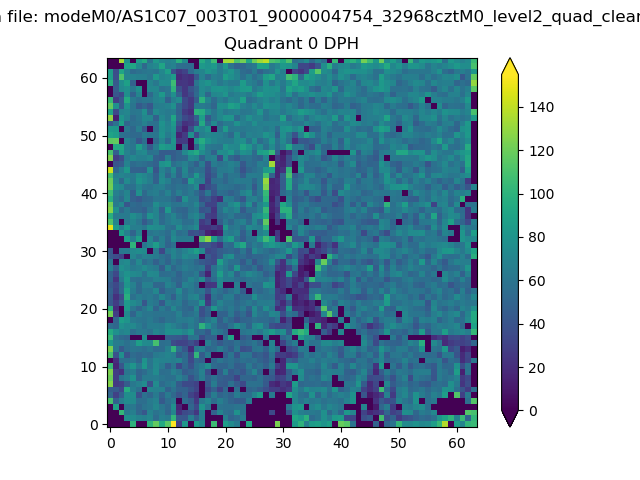 |
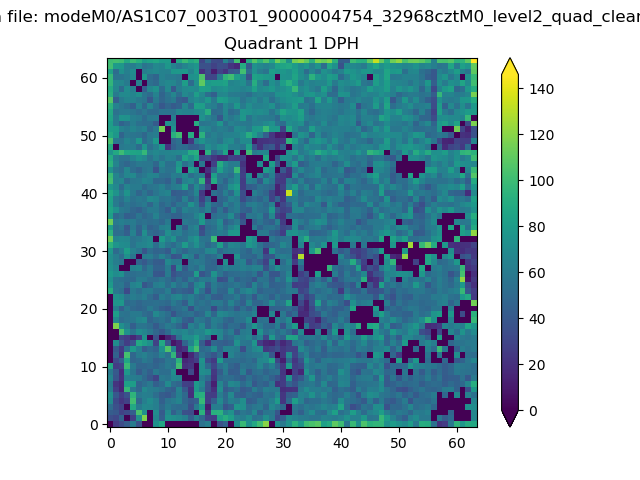 |
Quadrant B |
|---|---|---|---|
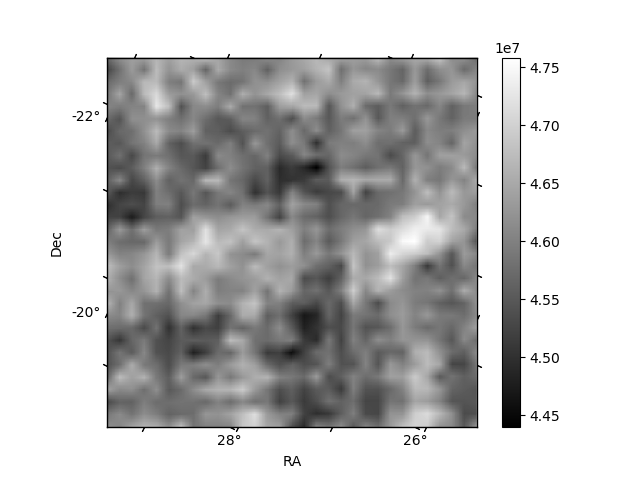
| Quadrant D | 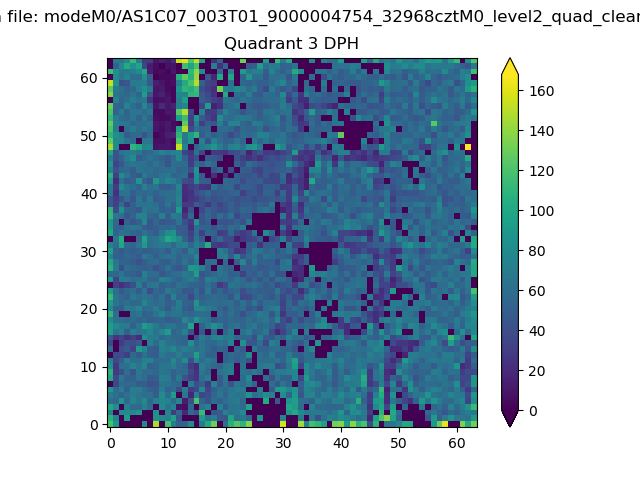 |
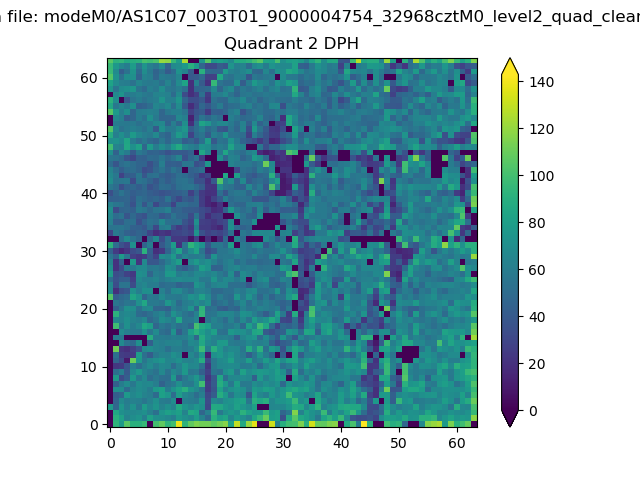 |
Quadrant C |
| Plot type | Count rate plots | Images |
|---|---|---|
| Comparison with Poisson distribution Blue bars denote a histogram of data divided into 1 sec bins. Red curve is a Poisson curve with rate = median count rate of data. |
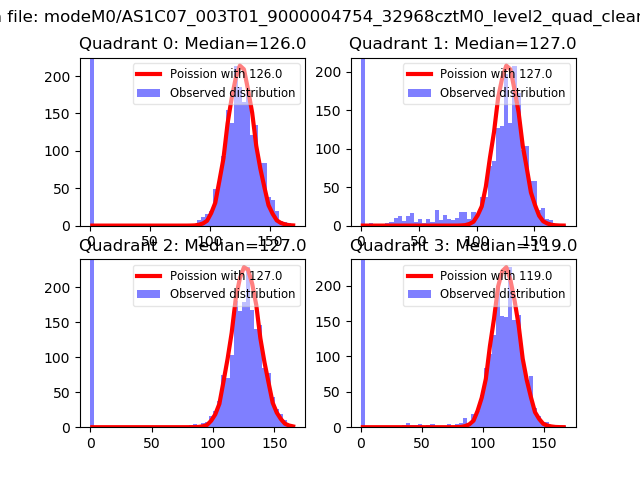 |
 |
| Quadrant-wise count rates Data is divided into 100 sec bins |
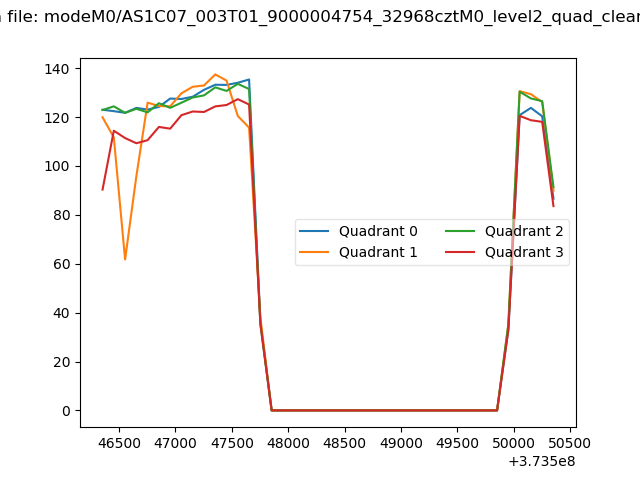 |
|
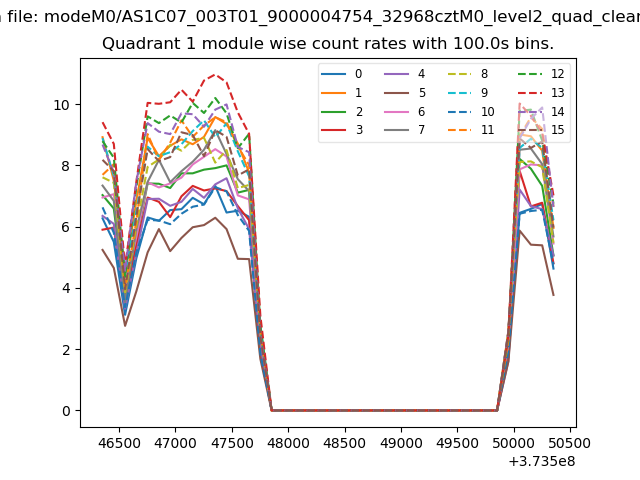
| Module-wise count rates for Quadrant A Data is divided into 100 sec bins |
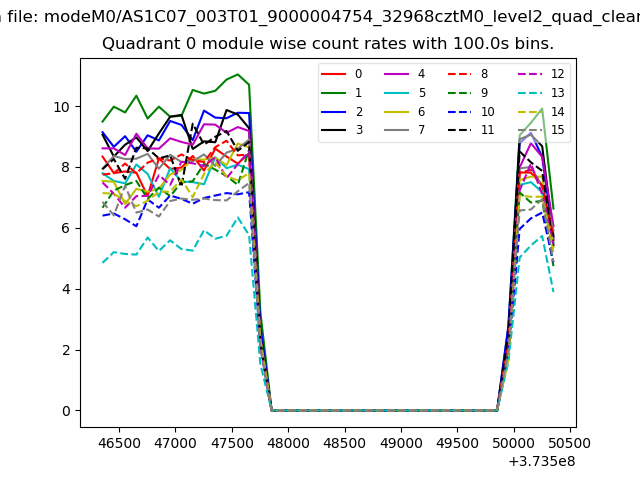 |
 |
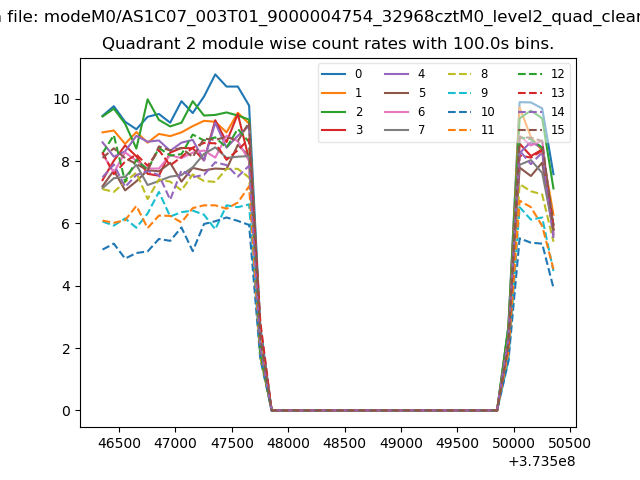
| Module-wise count rates for Quadrant B Data is divided into 100 sec bins |
 |
 |
| Module-wise count rates for Quadrant C Data is divided into 100 sec bins |
 |
 |
| Module-wise count rates for Quadrant D Data is divided into 100 sec bins |
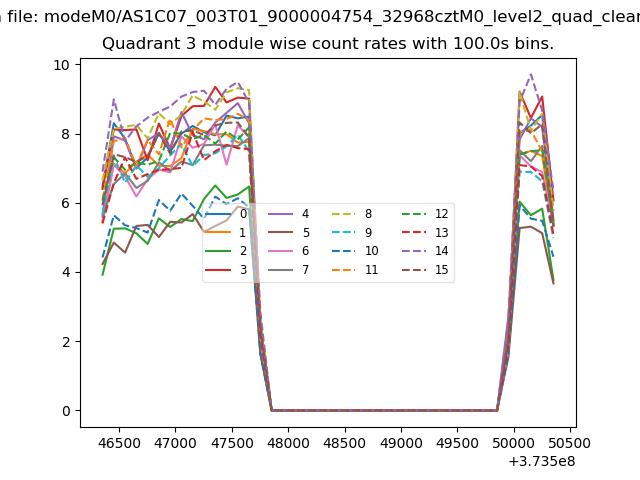 |
 |
| Parameter | Plot |
|---|---|
| CZT HV Monitor | 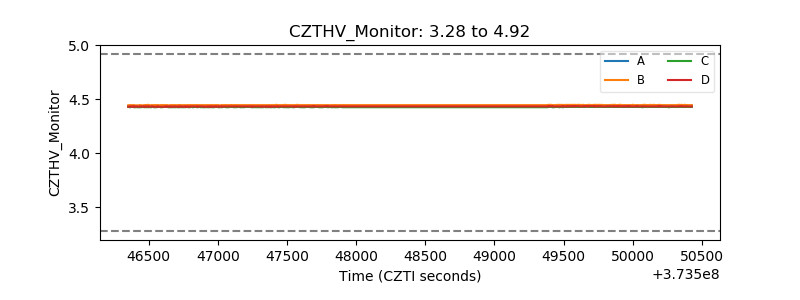 |
| D_VDD | 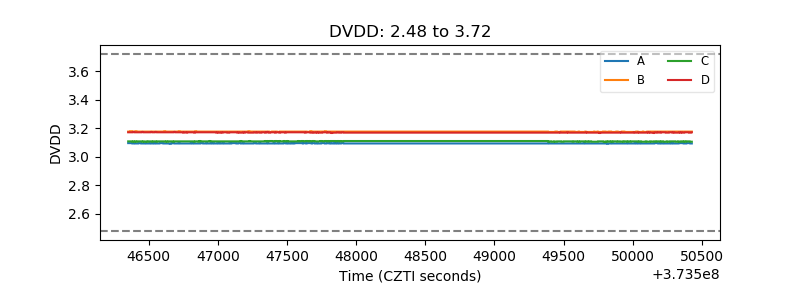 |
| Temperature 1 | 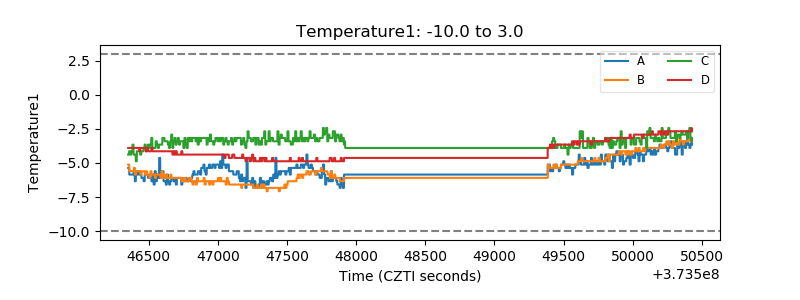 |
| Veto HV Monitor | 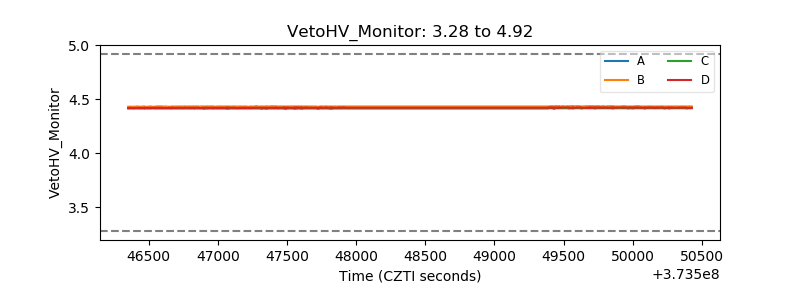 |
| Veto LLD | 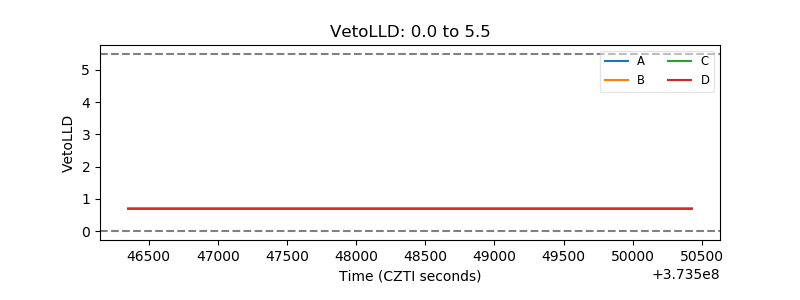 |
| Alpha Counter | 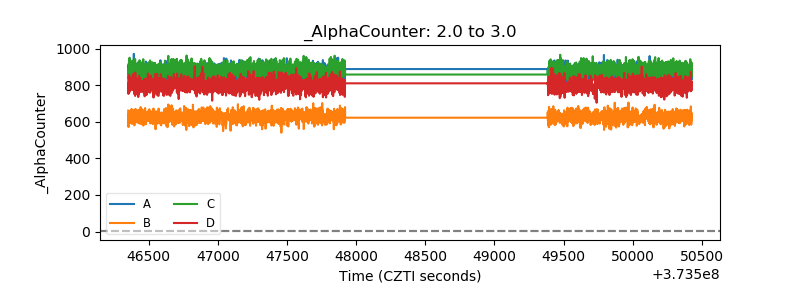 |
| _CPM_Rate | 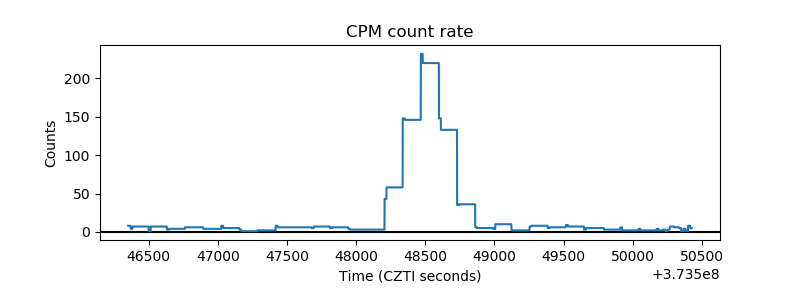 |
| CZT Counter | 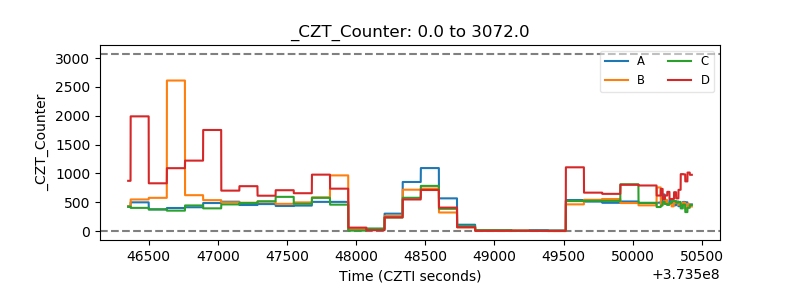 |
| +2.5 Volts monitor |  |
| +5 Volts monitor |  |
| _ROLL_ROT | 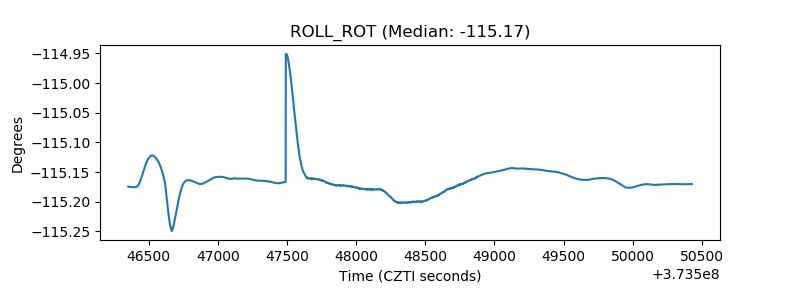 |
| _Roll_DEC | 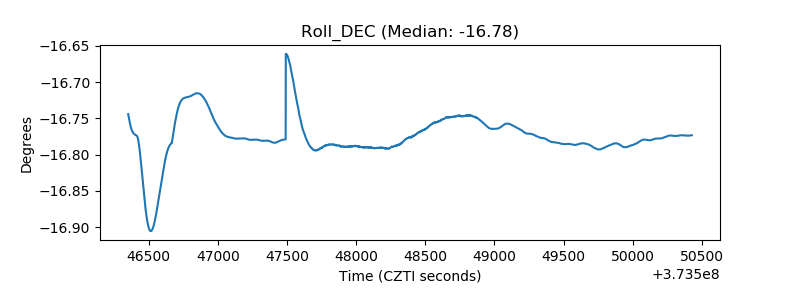 |
| _Roll_RA | 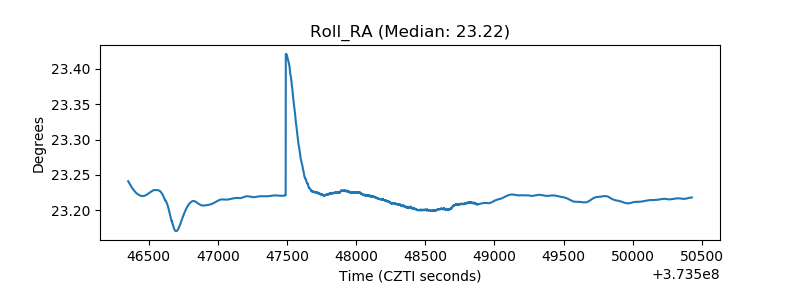 |
| Veto Counter | 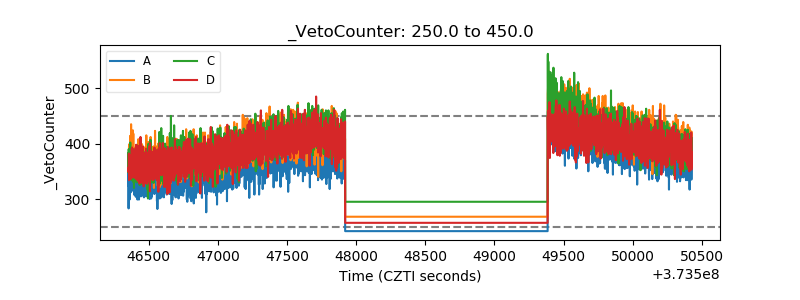 |