| Param | Original file | Final file |
|---|---|---|
| Filename | modeM0/AS1C07_003T01_9000004754_32970cztM0_level2.evt | modeM0/AS1C07_003T01_9000004754_32970cztM0_level2_quad_clean.evt |
| Size (bytes) | 469,180,800 | 87,215,040 |
| Size | 447.4 MB | 83.2 MB |
| Events in quadrant A | 2,643,218 | 579,140 |
| Events in quadrant B | 3,775,193 | 568,536 |
| Events in quadrant C | 2,892,050 | 565,467 |
| Events in quadrant D | 4,522,601 | 540,074 |
| Mode SS | |||
|---|---|---|---|
| Quadrant | BADHDUFLAG | Total packets | Discarded packets |
| A | 0 | 116 | 0 |
| B | 0 | 116 | 0 |
| C | 0 | 116 | 0 |
| D | 0 | 116 | 0 |
| Mode M9 | |||
|---|---|---|---|
| Quadrant | BADHDUFLAG | Total packets | Discarded packets |
| A | 0 | 33 | 0 |
| B | 0 | 33 | 0 |
| C | 0 | 33 | 0 |
| D | 0 | 33 | 0 |
| Mode M0 | |||
|---|---|---|---|
| Quadrant | BADHDUFLAG | Total packets | Discarded packets |
| A | 0 | 11361 | 3 |
| B | 0 | 14714 | 2 |
| C | 0 | 12226 | 2 |
| D | 0 | 17481 | 2 |
| Quadrant | Total seconds | Saturated seconds | Saturation percentage |
|---|---|---|---|
| A | 5540 | 6 | 0.108303% |
| B | 5540 | 332 | 5.992780% |
| C | 5540 | 94 | 1.696751% |
| D | 5540 | 70 | 1.263538% |
Noise dominated data is calculated using 1-second bins in cleaned event files. If a bin has >2000 counts, and if more than 50% of those come from <1% of pixels, then it is considered to be noise-dominated and hence unusable.
| Quadrant | # 1 sec bins | Bins with >0 counts | Bins with >2000 counts | High rate bins dominated by noise | Noise dominated (total time) | Noise dominated (detector-on time) | Marked lightcurve |
|---|---|---|---|---|---|---|---|
| A | 8856 | 5541 | 1 | 1 | 0.01% | 0.02% | 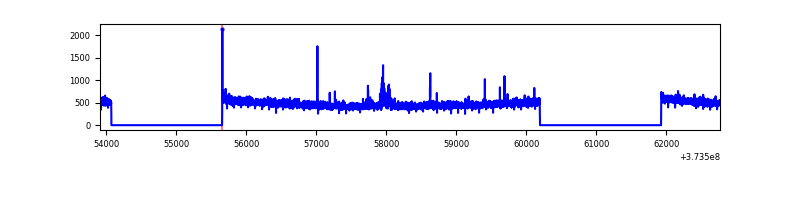 |
| B | 8856 | 5541 | 228 | 228 | 2.57% | 4.11% | 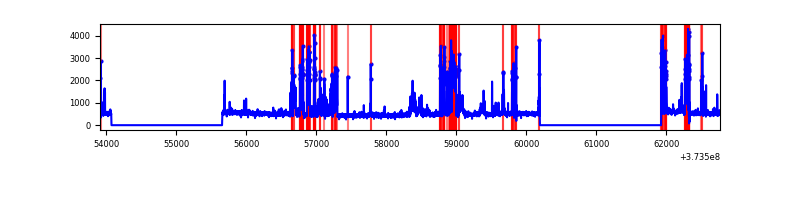 |
| C | 8856 | 5541 | 78 | 78 | 0.88% | 1.41% | 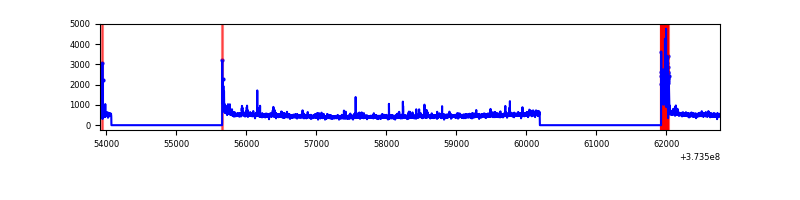 |
| D | 8856 | 5541 | 47 | 47 | 0.53% | 0.85% | 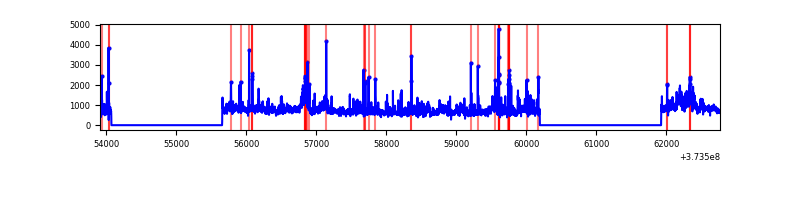 |
Top three noisy pixels from each quadrant. If the there are fewer than three noisy pixels in the level2.evt file, extra rows are filled as -1
| Pixel properties | Quadrant properties | ||||||
|---|---|---|---|---|---|---|---|
| Quadrant | DetID | PixID | Counts | Sigma | Mean | Median | Sigma |
| A | 12 | 227 | 43166 | 318.28 | 665 | 653 | 133.6 |
| A | 13 | 254 | 9722 | 67.9 | 665 | 653 | 133.6 |
| A | 14 | 207 | 9629 | 67.2 | 665 | 653 | 133.6 |
| B | 5 | 172 | 611787 | 4796.62 | 652 | 635 | 127.4 |
| B | 5 | 200 | 307484 | 2408.3 | 652 | 635 | 127.4 |
| B | 7 | 219 | 156015 | 1219.5 | 652 | 635 | 127.4 |
| C | 0 | 10 | 288903 | 1955.92 | 633 | 638 | 147.4 |
| C | 14 | 67 | 50199 | 336.28 | 633 | 638 | 147.4 |
| C | 3 | 233 | 45429 | 303.91 | 633 | 638 | 147.4 |
| D | 8 | 195 | 1619530 | 9652.67 | 633 | 621 | 167.7 |
| D | 7 | 80 | 115186 | 683.09 | 633 | 621 | 167.7 |
| D | 2 | 120 | 108457 | 642.97 | 633 | 621 | 167.7 |
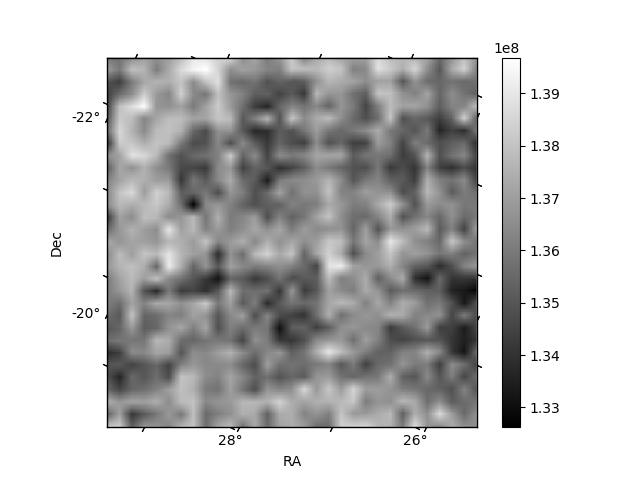
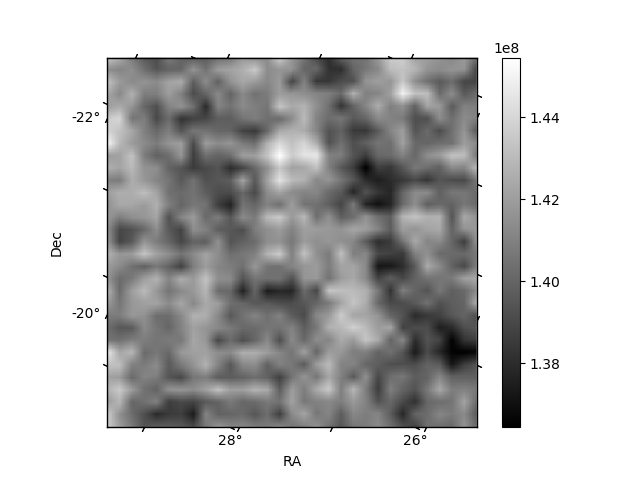
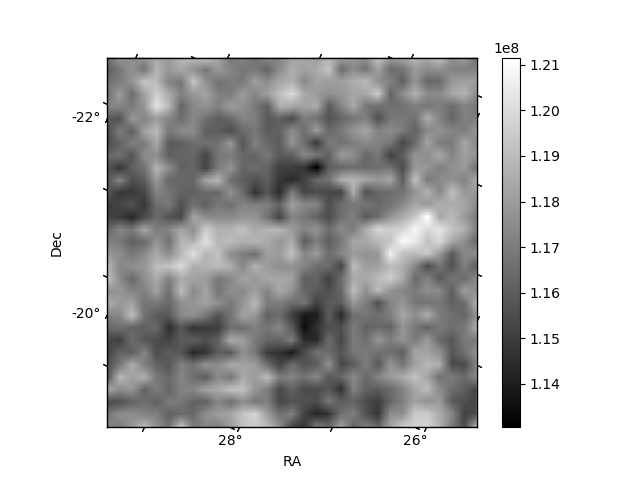
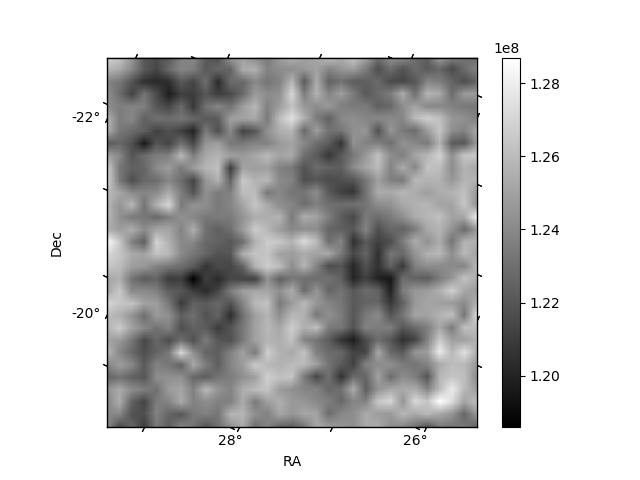
Histogram calculated using DETX and DETY for each event in the final _common_clean file
| Quadrant A |  |
 |
Quadrant B |
|---|---|---|---|
| Quadrant D |  |
 |
Quadrant C |
| Plot type | Count rate plots | Images |
|---|---|---|
| Comparison with Poisson distribution Blue bars denote a histogram of data divided into 1 sec bins. Red curve is a Poisson curve with rate = median count rate of data. |
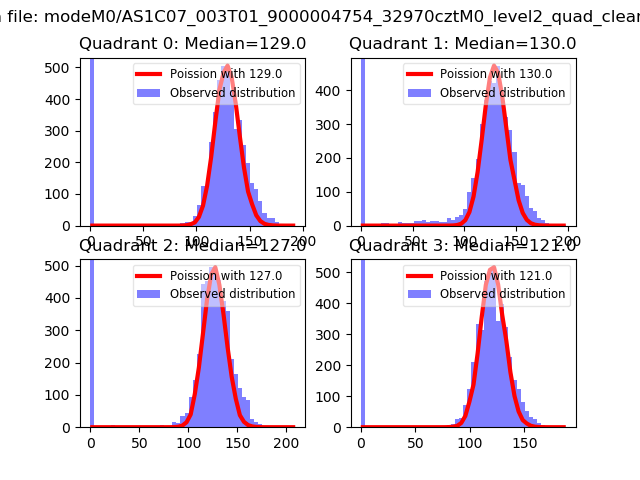 |
 |
| Quadrant-wise count rates Data is divided into 100 sec bins |
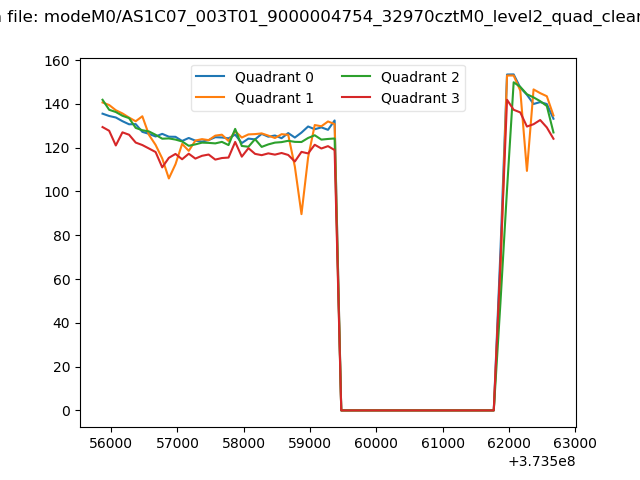 |
|
| Module-wise count rates for Quadrant A Data is divided into 100 sec bins |
 |
 |
| Module-wise count rates for Quadrant B Data is divided into 100 sec bins |
 |
 |
| Module-wise count rates for Quadrant C Data is divided into 100 sec bins |
 |
 |
| Module-wise count rates for Quadrant D Data is divided into 100 sec bins |
 |
 |
| Parameter | Plot |
|---|---|
| CZT HV Monitor |  |
| D_VDD | 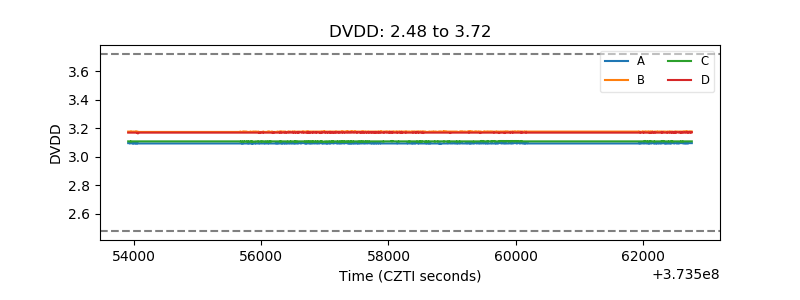 |
| Temperature 1 |  |
| Veto HV Monitor |  |
| Veto LLD |  |
| Alpha Counter |  |
| _CPM_Rate | 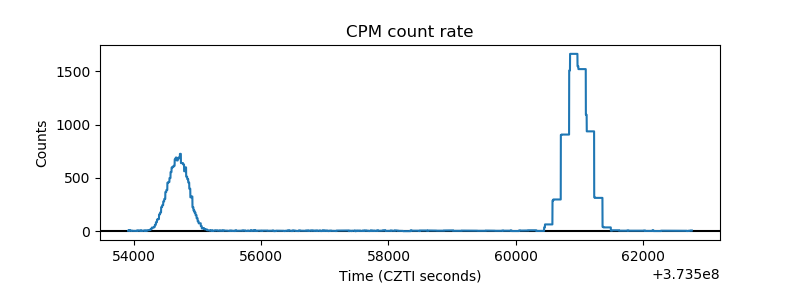 |
| CZT Counter |  |
| +2.5 Volts monitor |  |
| +5 Volts monitor |  |
| _ROLL_ROT |  |
| _Roll_DEC |  |
| _Roll_RA |  |
| Veto Counter |  |