| Param | Original file | Final file |
|---|---|---|
| Filename | modeM0/AS1C07_003T01_9000004754_32972cztM0_level2.evt | modeM0/AS1C07_003T01_9000004754_32972cztM0_level2_quad_clean.evt |
| Size (bytes) | 505,065,600 | 86,624,640 |
| Size | 481.7 MB | 82.6 MB |
| Events in quadrant A | 2,682,146 | 587,210 |
| Events in quadrant B | 3,932,160 | 551,014 |
| Events in quadrant C | 3,167,558 | 562,394 |
| Events in quadrant D | 5,134,651 | 530,822 |
| Mode SS | |||
|---|---|---|---|
| Quadrant | BADHDUFLAG | Total packets | Discarded packets |
| A | 0 | 116 | 0 |
| B | 0 | 116 | 0 |
| C | 0 | 116 | 0 |
| D | 0 | 116 | 0 |
| Mode M9 | |||
|---|---|---|---|
| Quadrant | BADHDUFLAG | Total packets | Discarded packets |
| A | 0 | 35 | 0 |
| B | 0 | 35 | 0 |
| C | 0 | 35 | 0 |
| D | 0 | 35 | 0 |
| Mode M0 | |||
|---|---|---|---|
| Quadrant | BADHDUFLAG | Total packets | Discarded packets |
| A | 0 | 11450 | 3 |
| B | 0 | 15229 | 2 |
| C | 0 | 12813 | 2 |
| D | 0 | 19350 | 2 |
| Quadrant | Total seconds | Saturated seconds | Saturation percentage |
|---|---|---|---|
| A | 5599 | 7 | 0.125022% |
| B | 5599 | 503 | 8.983747% |
| C | 5599 | 95 | 1.696732% |
| D | 5599 | 155 | 2.768351% |
Noise dominated data is calculated using 1-second bins in cleaned event files. If a bin has >2000 counts, and if more than 50% of those come from <1% of pixels, then it is considered to be noise-dominated and hence unusable.
| Quadrant | # 1 sec bins | Bins with >0 counts | Bins with >2000 counts | High rate bins dominated by noise | Noise dominated (total time) | Noise dominated (detector-on time) | Marked lightcurve |
|---|---|---|---|---|---|---|---|
| A | 9185 | 5600 | 1 | 1 | 0.01% | 0.02% | 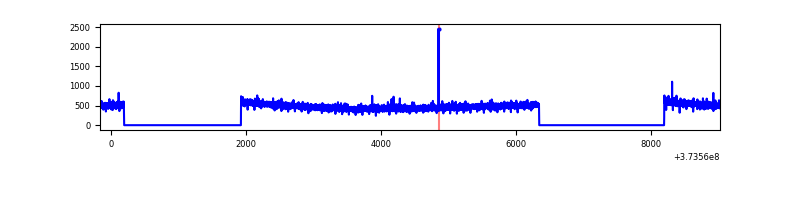 |
| B | 9185 | 5600 | 293 | 293 | 3.19% | 5.23% | 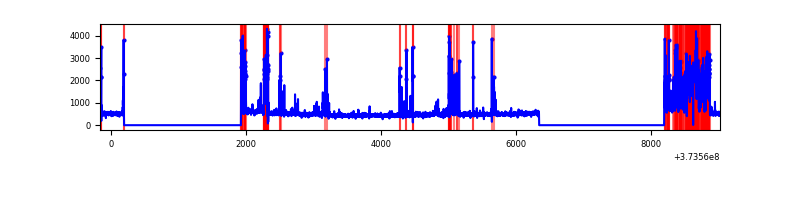 |
| C | 9185 | 5600 | 80 | 80 | 0.87% | 1.43% | 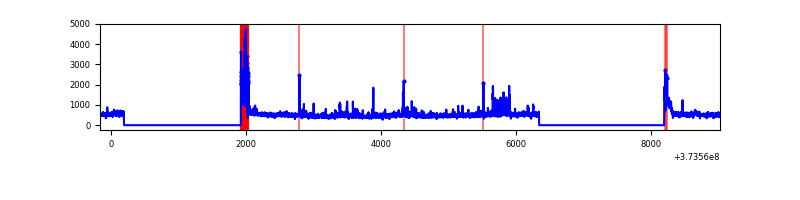 |
| D | 9185 | 5600 | 139 | 139 | 1.51% | 2.48% | 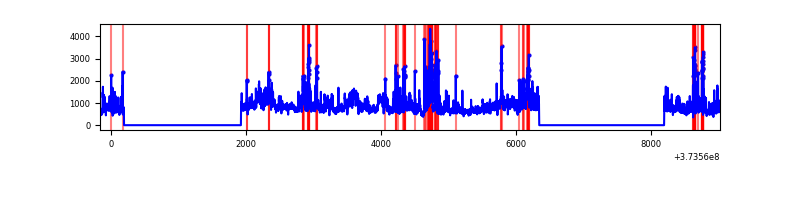 |
Top three noisy pixels from each quadrant. If the there are fewer than three noisy pixels in the level2.evt file, extra rows are filled as -1
| Pixel properties | Quadrant properties | ||||||
|---|---|---|---|---|---|---|---|
| Quadrant | DetID | PixID | Counts | Sigma | Mean | Median | Sigma |
| A | 9 | 143 | 9693 | 65.04 | 689 | 679 | 138.6 |
| A | 13 | 254 | 9585 | 64.26 | 689 | 679 | 138.6 |
| A | 3 | 137 | 6228 | 40.04 | 689 | 679 | 138.6 |
| B | 5 | 172 | 1173084 | 9304.85 | 654 | 639 | 126.0 |
| B | 5 | 200 | 91841 | 723.8 | 654 | 639 | 126.0 |
| B | 0 | 197 | 40282 | 314.61 | 654 | 639 | 126.0 |
| C | 0 | 10 | 332843 | 2190.69 | 654 | 662 | 151.6 |
| C | 14 | 67 | 99292 | 650.45 | 654 | 662 | 151.6 |
| C | 1 | 241 | 69192 | 451.95 | 654 | 662 | 151.6 |
| D | 8 | 195 | 1877214 | 11065.82 | 647 | 635 | 169.6 |
| D | 7 | 80 | 439517 | 2588.0 | 647 | 635 | 169.6 |
| D | 13 | 249 | 137886 | 809.34 | 647 | 635 | 169.6 |
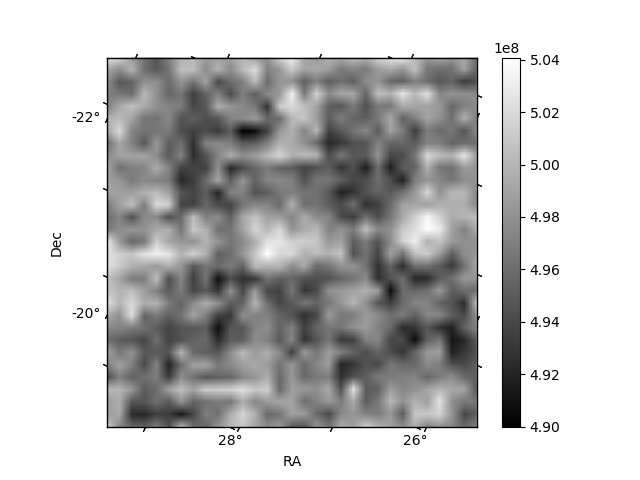
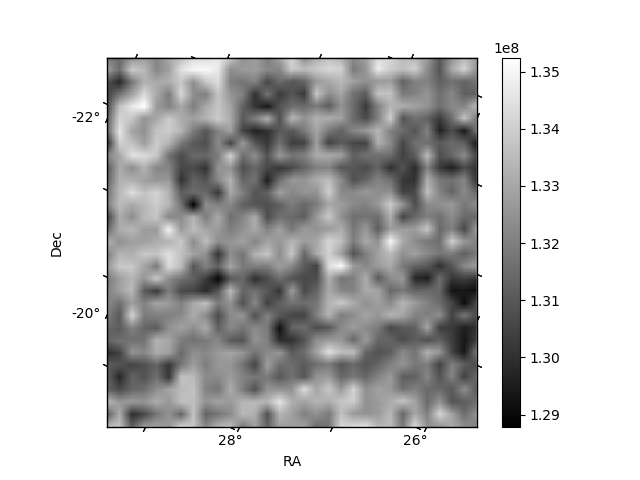
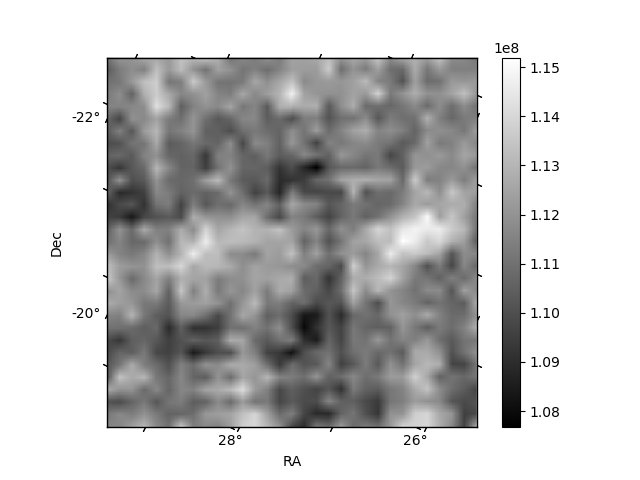
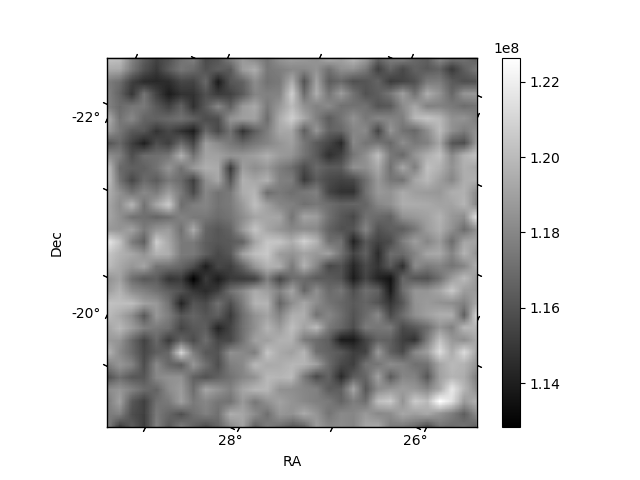
Histogram calculated using DETX and DETY for each event in the final _common_clean file
| Quadrant A | 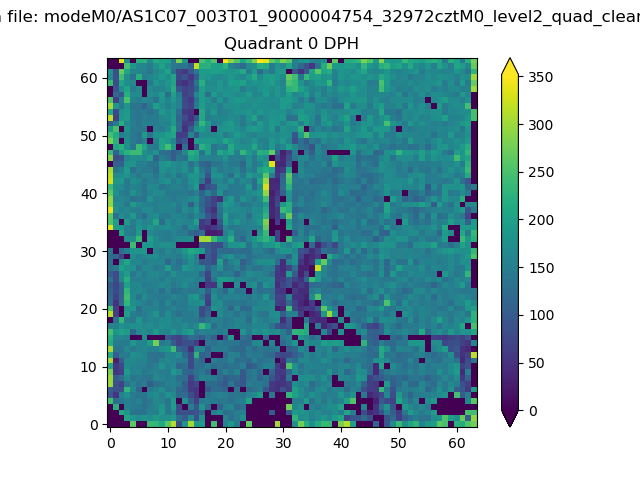 |
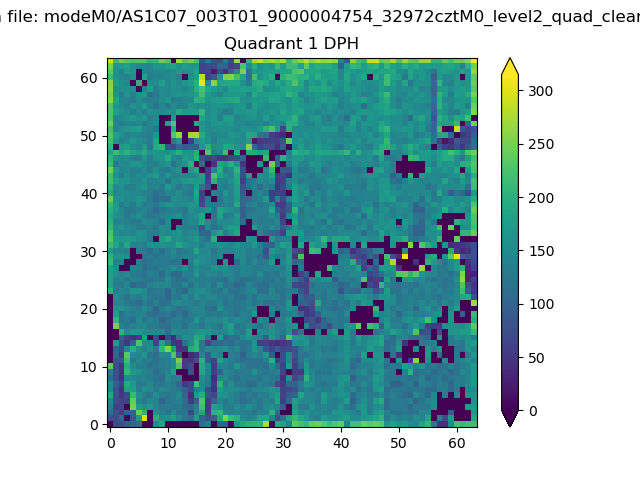 |
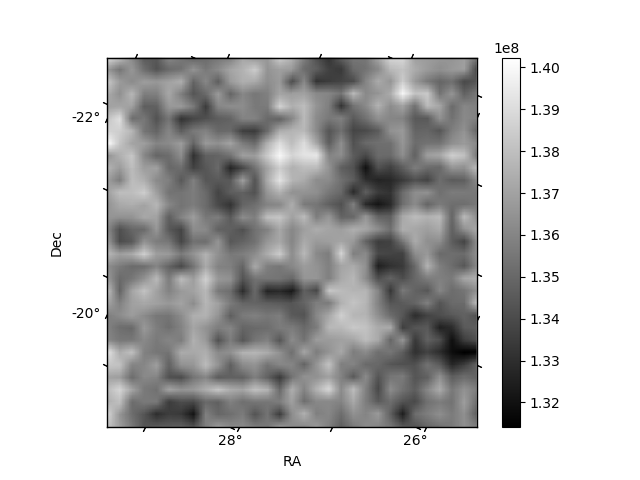
Quadrant B |
|---|---|---|---|
| Quadrant D | 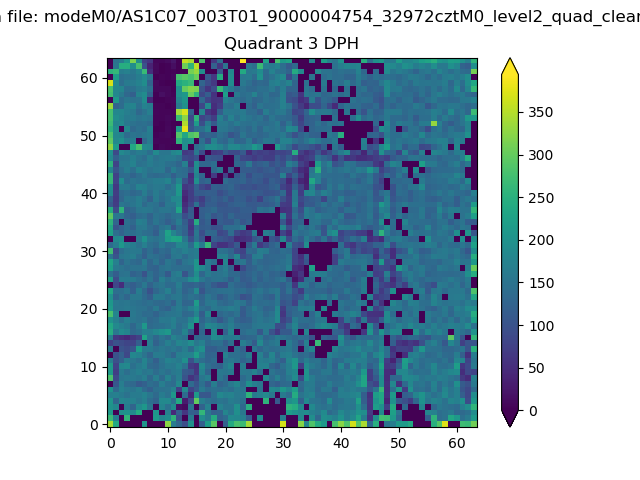 |
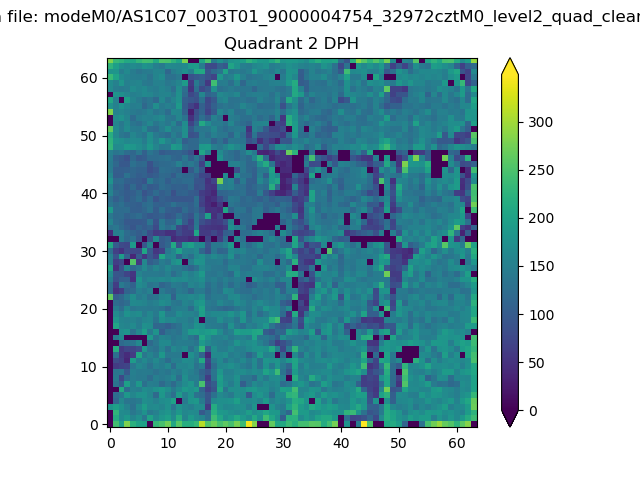 |
Quadrant C |
| Plot type | Count rate plots | Images |
|---|---|---|
| Comparison with Poisson distribution Blue bars denote a histogram of data divided into 1 sec bins. Red curve is a Poisson curve with rate = median count rate of data. |
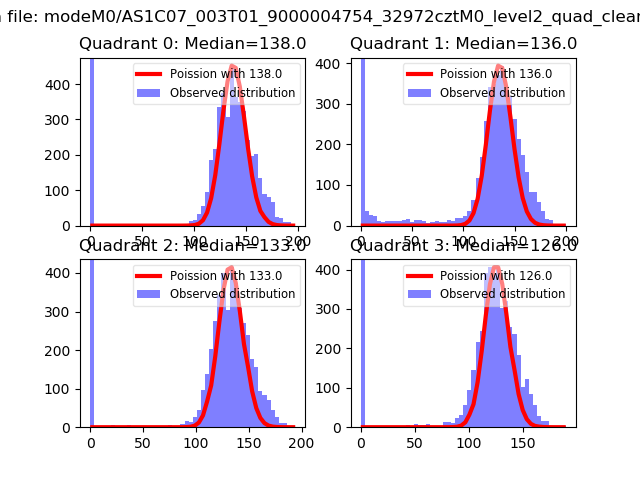 |
 |
| Quadrant-wise count rates Data is divided into 100 sec bins |
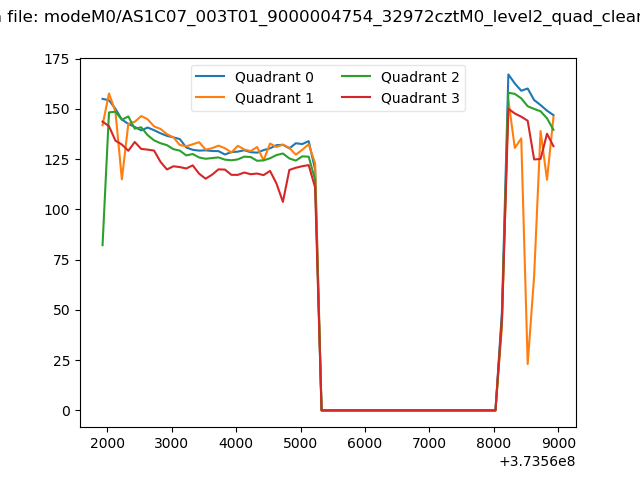 |
|
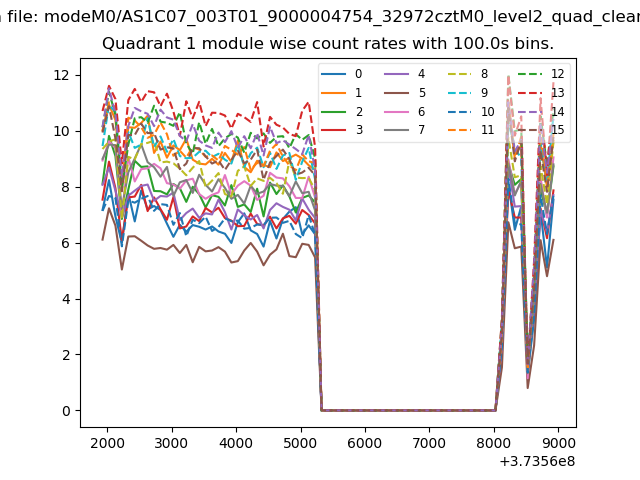
| Module-wise count rates for Quadrant A Data is divided into 100 sec bins |
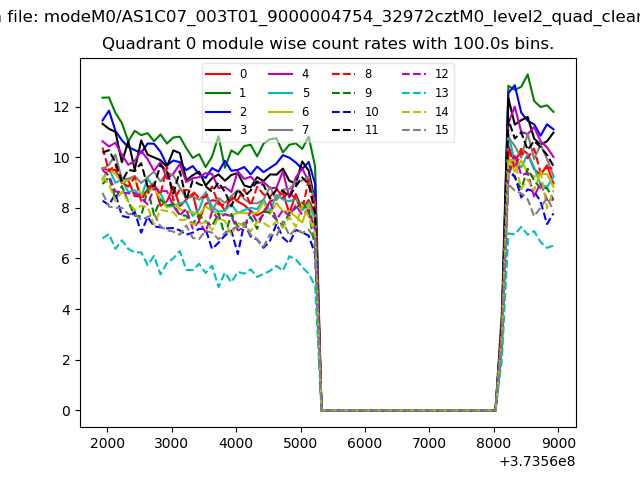 |
 |
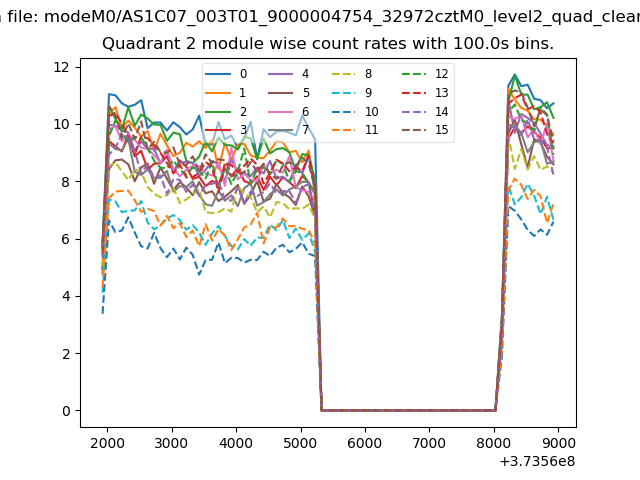
| Module-wise count rates for Quadrant B Data is divided into 100 sec bins |
 |
 |
| Module-wise count rates for Quadrant C Data is divided into 100 sec bins |
 |
 |
| Module-wise count rates for Quadrant D Data is divided into 100 sec bins |
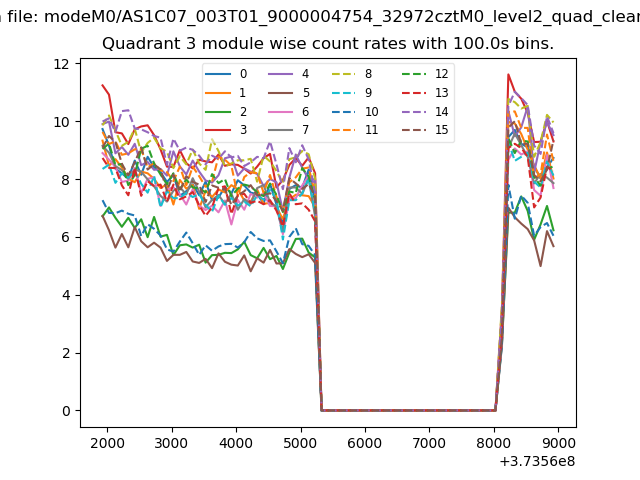 |
 |
| Parameter | Plot |
|---|---|
| CZT HV Monitor | 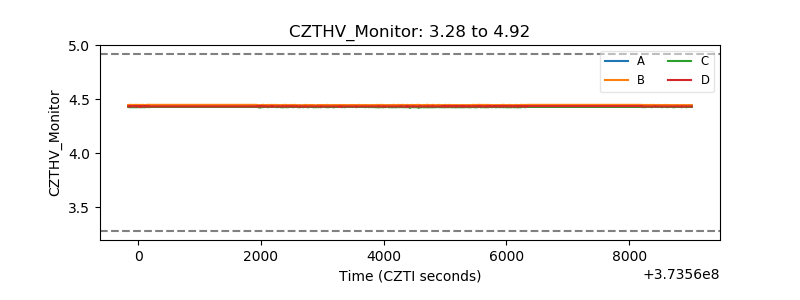 |
| D_VDD | 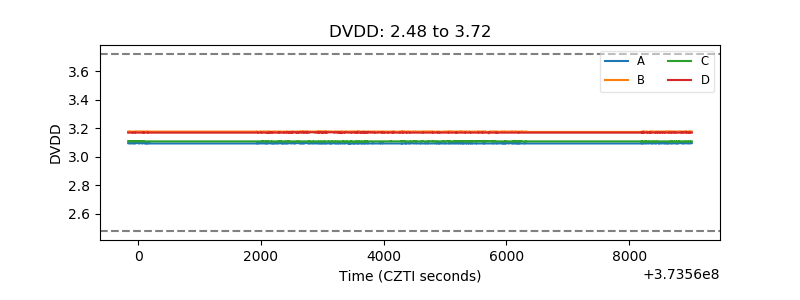 |
| Temperature 1 | 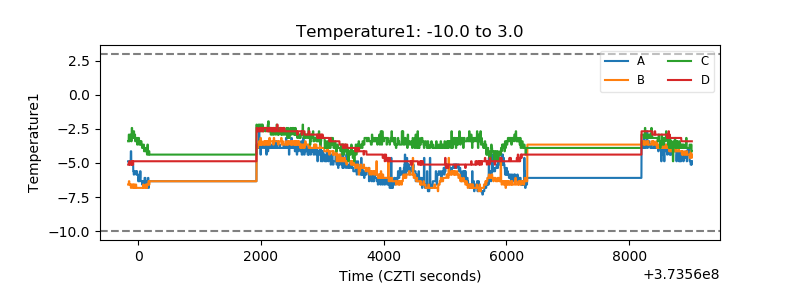 |
| Veto HV Monitor | 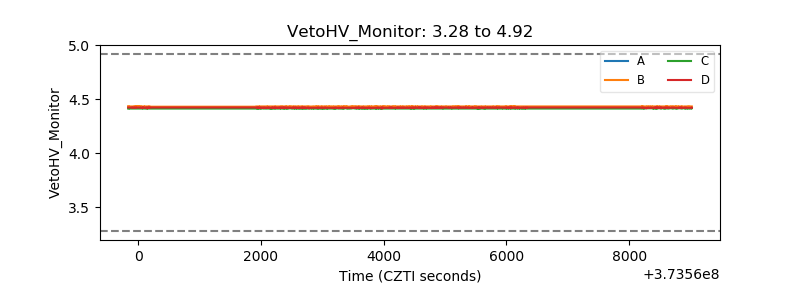 |
| Veto LLD | 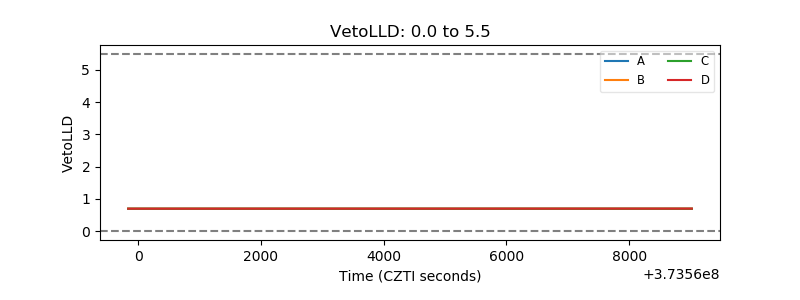 |
| Alpha Counter | 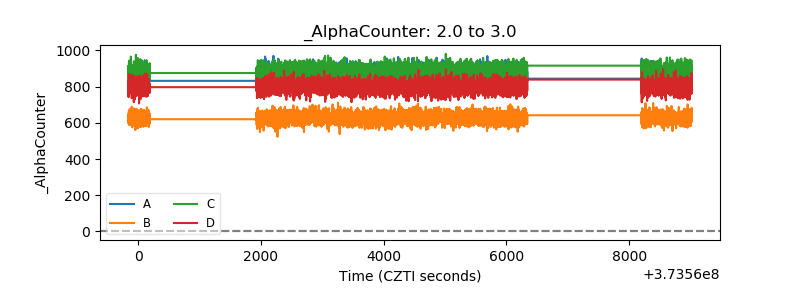 |
| _CPM_Rate |  |
| CZT Counter | 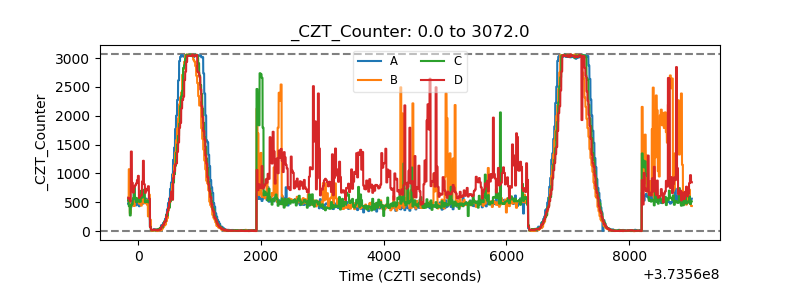 |
| +2.5 Volts monitor |  |
| +5 Volts monitor |  |
| _ROLL_ROT | 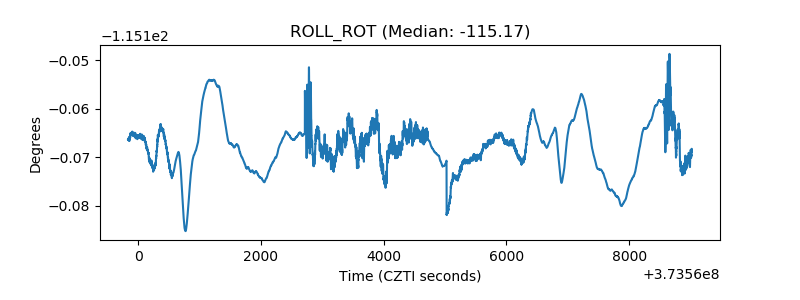 |
| _Roll_DEC | 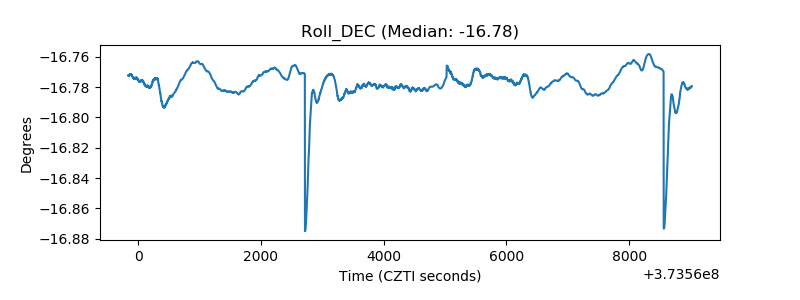 |
| _Roll_RA |  |
| Veto Counter | 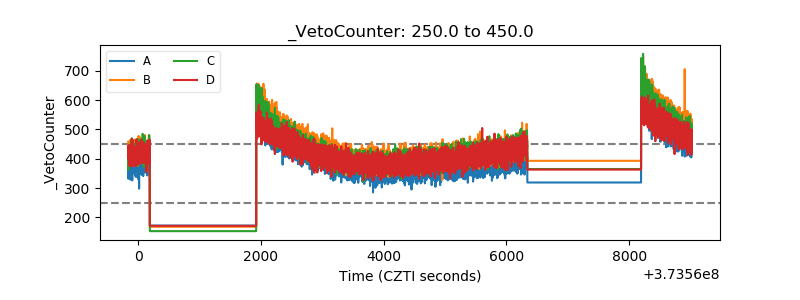 |