| Param | Original file | Final file |
|---|---|---|
| Filename | modeM0/AS1C07_003T01_9000004754_32973cztM0_level2.evt | modeM0/AS1C07_003T01_9000004754_32973cztM0_level2_quad_clean.evt |
| Size (bytes) | 466,364,160 | 84,479,040 |
| Size | 444.8 MB | 80.6 MB |
| Events in quadrant A | 2,567,196 | 577,636 |
| Events in quadrant B | 3,701,947 | 553,640 |
| Events in quadrant C | 2,753,672 | 555,761 |
| Events in quadrant D | 4,744,475 | 503,074 |
| Mode SS | |||
|---|---|---|---|
| Quadrant | BADHDUFLAG | Total packets | Discarded packets |
| A | 0 | 106 | 0 |
| B | 0 | 106 | 0 |
| C | 0 | 106 | 0 |
| D | 0 | 106 | 0 |
| Mode M9 | |||
|---|---|---|---|
| Quadrant | BADHDUFLAG | Total packets | Discarded packets |
| A | 0 | 22 | 0 |
| B | 0 | 22 | 0 |
| C | 0 | 22 | 0 |
| D | 0 | 23 | 0 |
| Mode M0 | |||
|---|---|---|---|
| Quadrant | BADHDUFLAG | Total packets | Discarded packets |
| A | 0 | 10796 | 3 |
| B | 0 | 14223 | 2 |
| C | 0 | 11419 | 2 |
| D | 0 | 17780 | 2 |
| Quadrant | Total seconds | Saturated seconds | Saturation percentage |
|---|---|---|---|
| A | 5256 | 4 | 0.076104% |
| B | 5256 | 497 | 9.455860% |
| C | 5256 | 34 | 0.646880% |
| D | 5256 | 443 | 8.428463% |
Noise dominated data is calculated using 1-second bins in cleaned event files. If a bin has >2000 counts, and if more than 50% of those come from <1% of pixels, then it is considered to be noise-dominated and hence unusable.
| Quadrant | # 1 sec bins | Bins with >0 counts | Bins with >2000 counts | High rate bins dominated by noise | Noise dominated (total time) | Noise dominated (detector-on time) | Marked lightcurve |
|---|---|---|---|---|---|---|---|
| A | 7229 | 5257 | 0 | 0 | 0.00% | 0.00% | 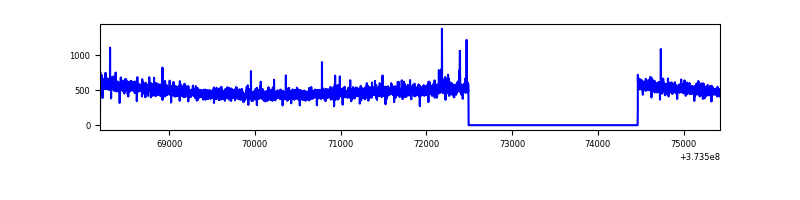 |
| B | 7229 | 5257 | 276 | 276 | 3.82% | 5.25% | 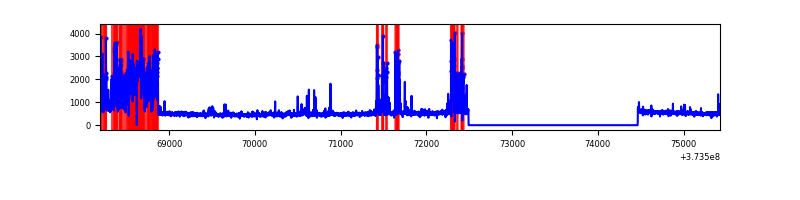 |
| C | 7229 | 5257 | 24 | 24 | 0.33% | 0.46% | 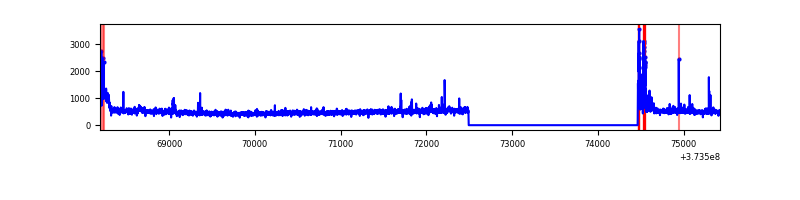 |
| D | 7229 | 5257 | 429 | 429 | 5.93% | 8.16% | 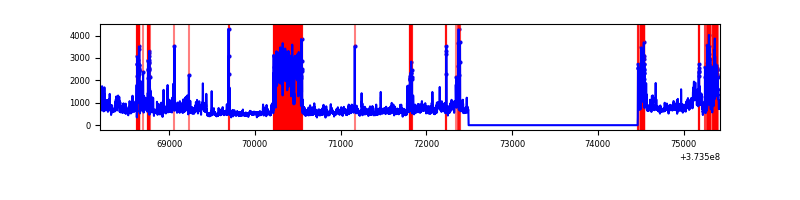 |
Top three noisy pixels from each quadrant. If the there are fewer than three noisy pixels in the level2.evt file, extra rows are filled as -1
| Pixel properties | Quadrant properties | ||||||
|---|---|---|---|---|---|---|---|
| Quadrant | DetID | PixID | Counts | Sigma | Mean | Median | Sigma |
| A | 9 | 143 | 14376 | 103.99 | 658 | 647 | 132.0 |
| A | 13 | 254 | 9083 | 63.9 | 658 | 647 | 132.0 |
| A | 13 | 6 | 6990 | 48.05 | 658 | 647 | 132.0 |
| B | 5 | 172 | 1142238 | 9600.24 | 626 | 612 | 118.9 |
| B | 5 | 200 | 32155 | 265.25 | 626 | 612 | 118.9 |
| B | 0 | 230 | 22859 | 187.08 | 626 | 612 | 118.9 |
| C | 0 | 10 | 164113 | 1128.79 | 628 | 634 | 144.8 |
| C | 14 | 67 | 53461 | 364.76 | 628 | 634 | 144.8 |
| C | 9 | 54 | 33613 | 227.71 | 628 | 634 | 144.8 |
| D | 8 | 195 | 1040039 | 6661.22 | 601 | 590 | 156.0 |
| D | 7 | 80 | 945022 | 6052.31 | 601 | 590 | 156.0 |
| D | 13 | 249 | 154924 | 989.04 | 601 | 590 | 156.0 |
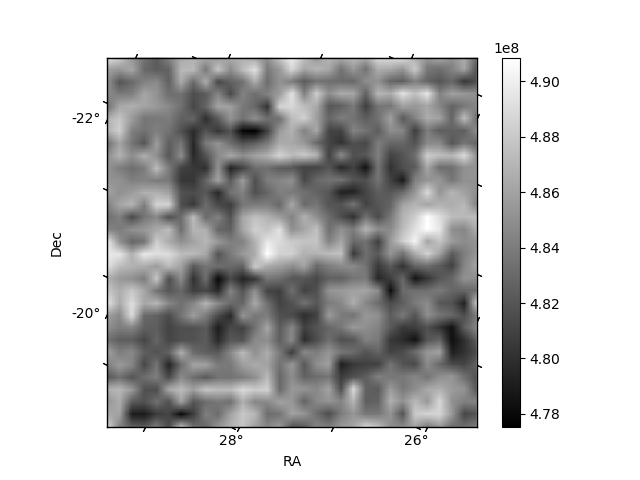
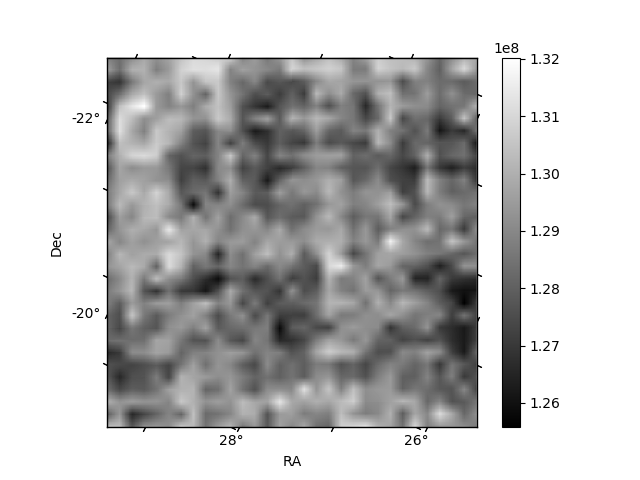
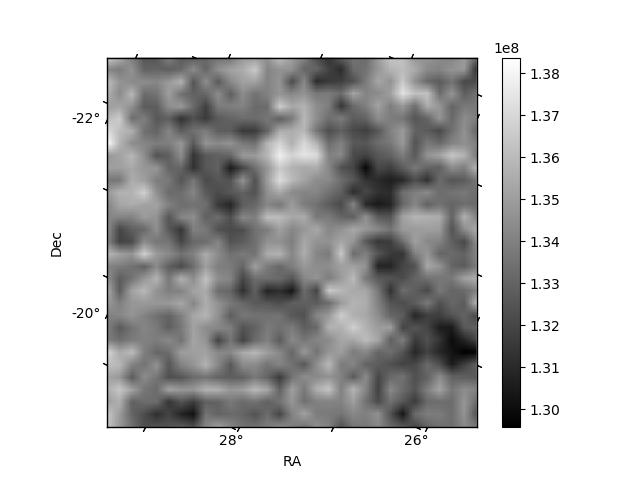
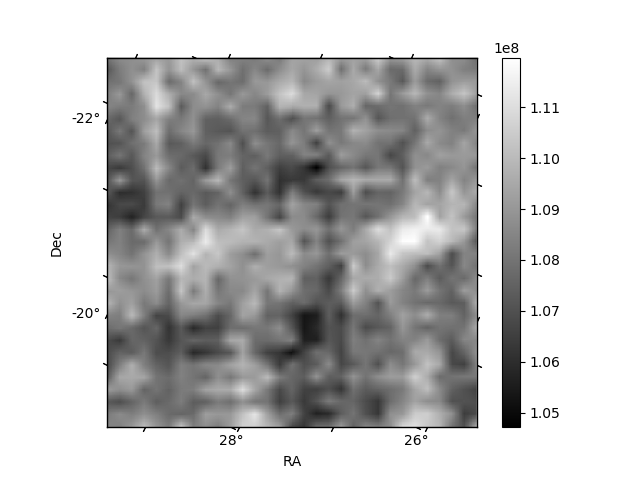
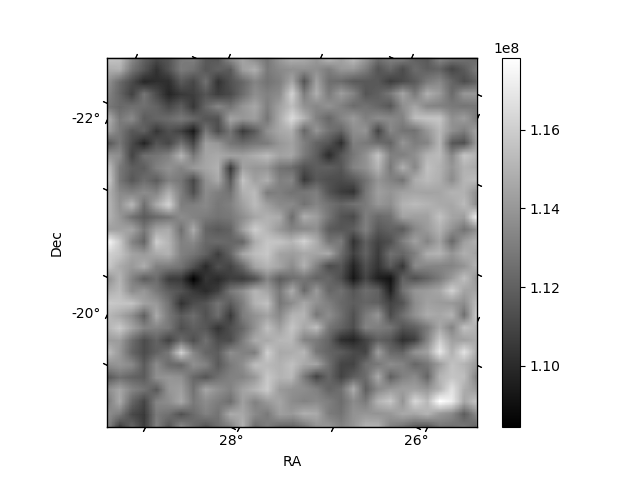
Histogram calculated using DETX and DETY for each event in the final _common_clean file
| Quadrant A | 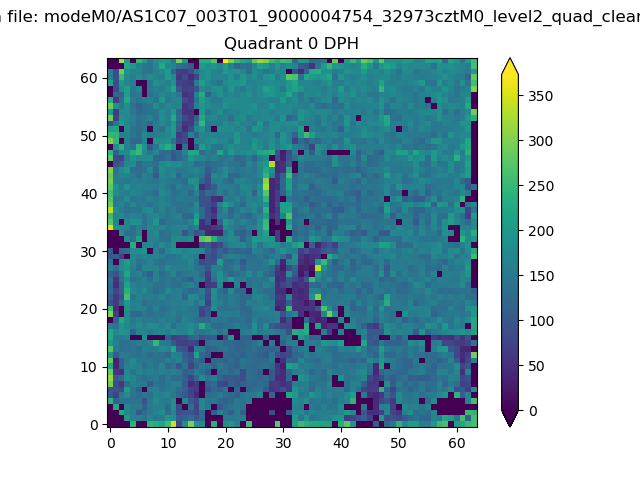 |
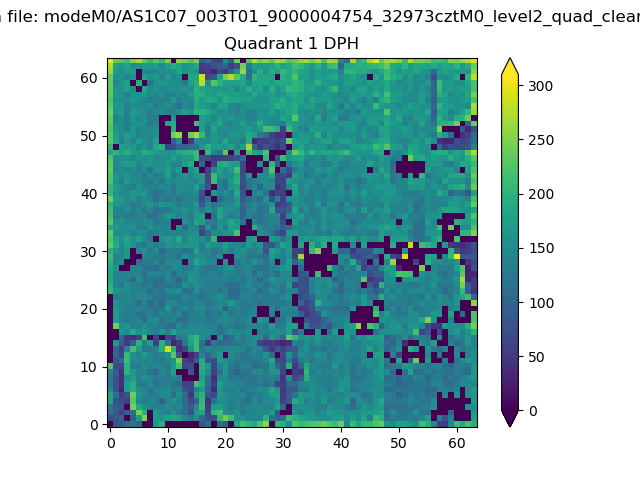 |
Quadrant B |
|---|---|---|---|
| Quadrant D |  |
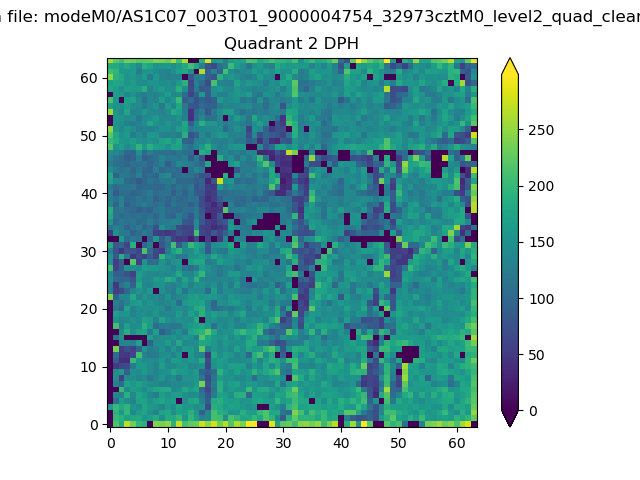 |
Quadrant C |
| Plot type | Count rate plots | Images |
|---|---|---|
| Comparison with Poisson distribution Blue bars denote a histogram of data divided into 1 sec bins. Red curve is a Poisson curve with rate = median count rate of data. |
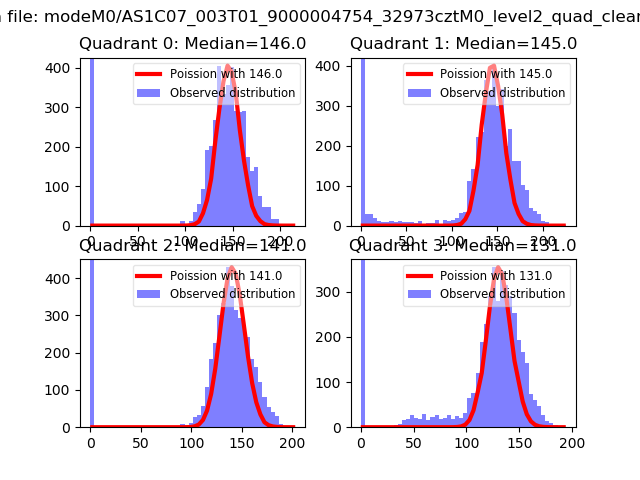 |
 |
| Quadrant-wise count rates Data is divided into 100 sec bins |
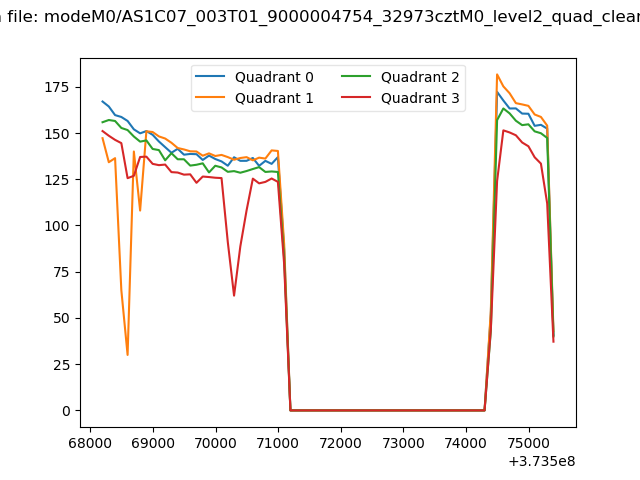 |
|
| Module-wise count rates for Quadrant A Data is divided into 100 sec bins |
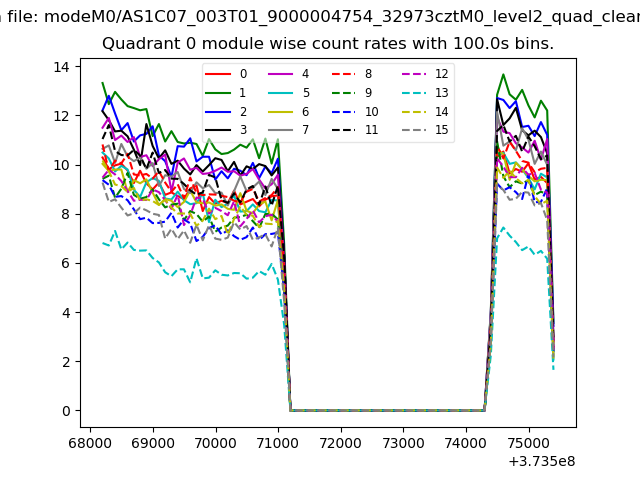 |
 |
| Module-wise count rates for Quadrant B Data is divided into 100 sec bins |
 |
 |
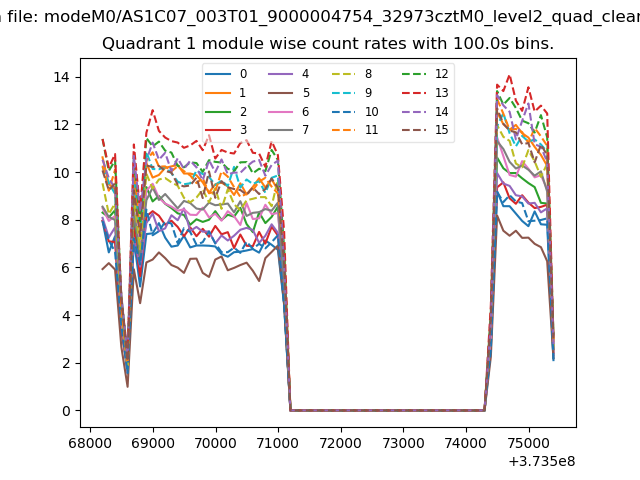
| Module-wise count rates for Quadrant C Data is divided into 100 sec bins |
 |
 |
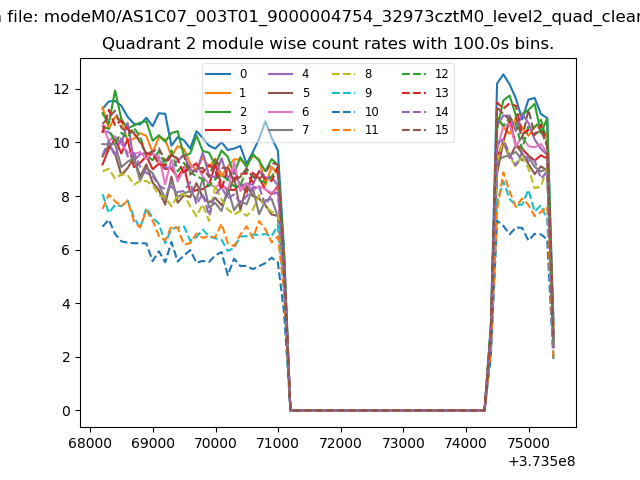
| Module-wise count rates for Quadrant D Data is divided into 100 sec bins |
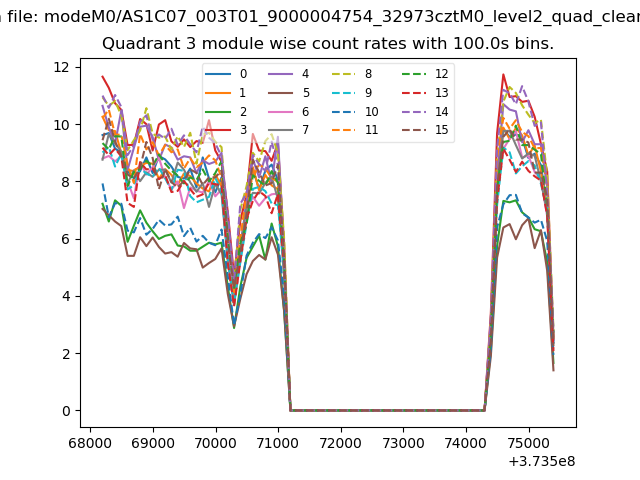 |
 |
| Parameter | Plot |
|---|---|
| CZT HV Monitor | 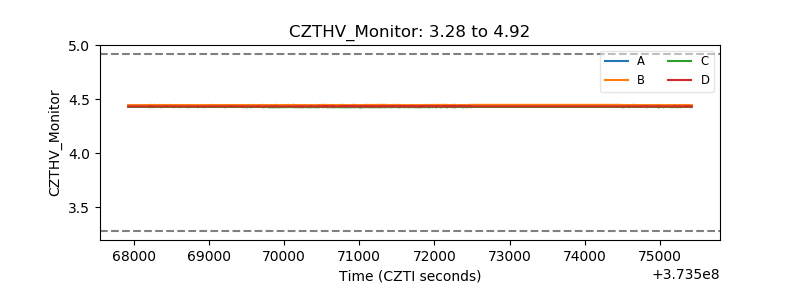 |
| D_VDD | 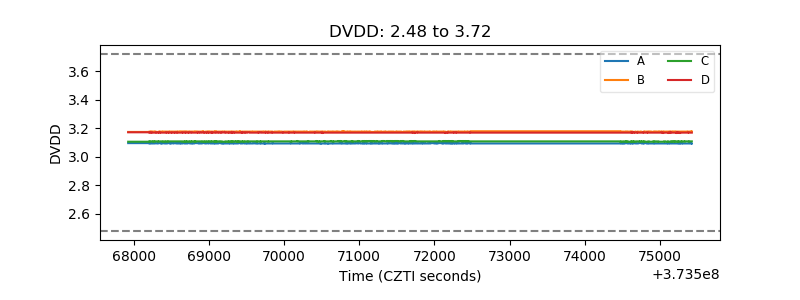 |
| Temperature 1 | 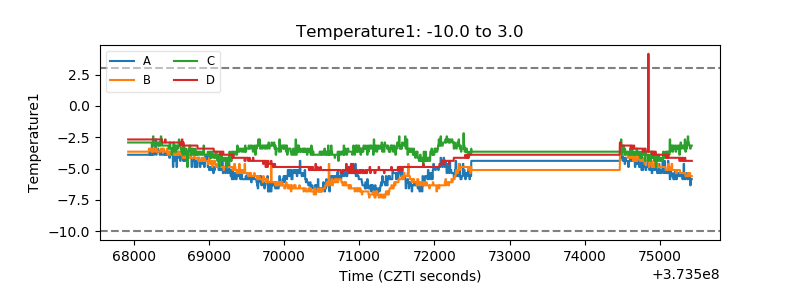 |
| Veto HV Monitor | 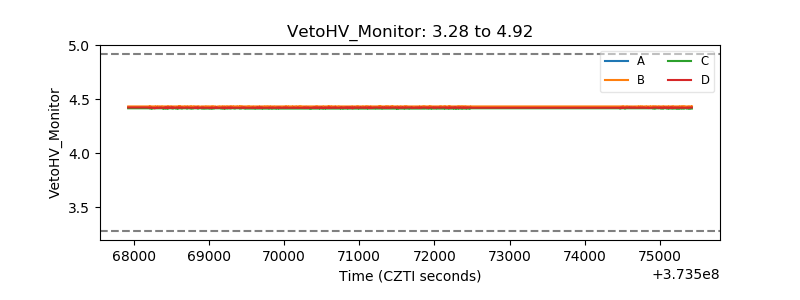 |
| Veto LLD | 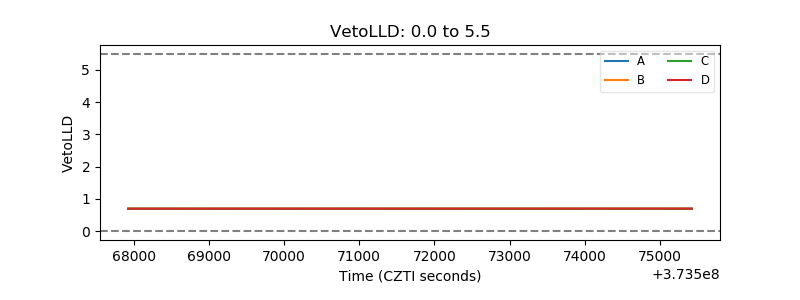 |
| Alpha Counter | 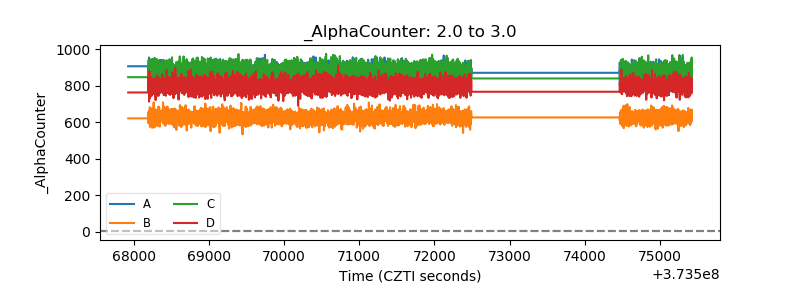 |
| _CPM_Rate | 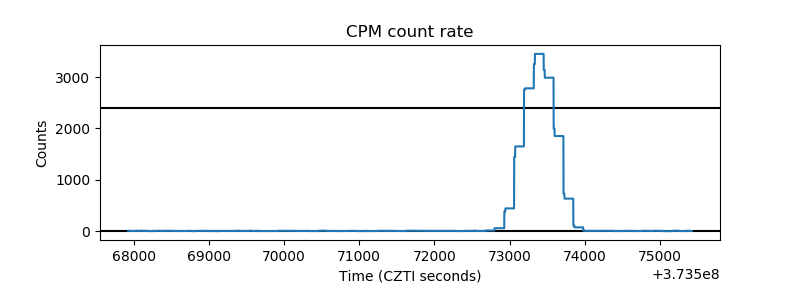 |
| CZT Counter | 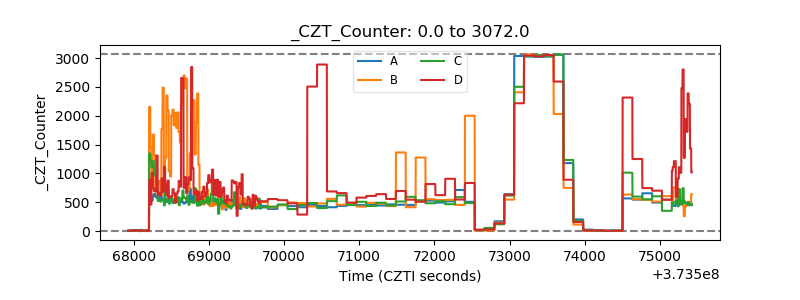 |
| +2.5 Volts monitor |  |
| +5 Volts monitor |  |
| _ROLL_ROT | 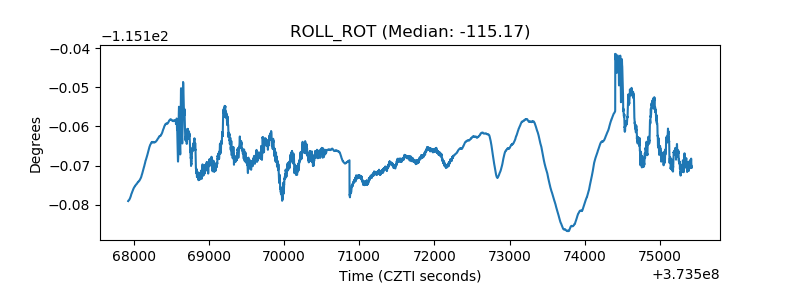 |
| _Roll_DEC | 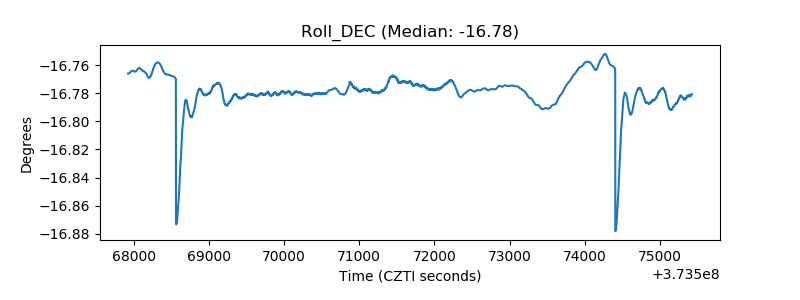 |
| _Roll_RA | 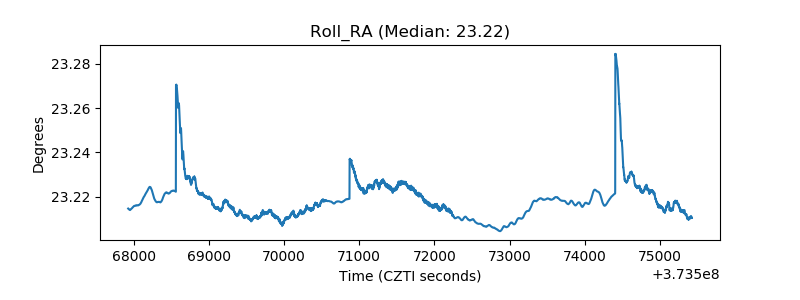 |
| Veto Counter | 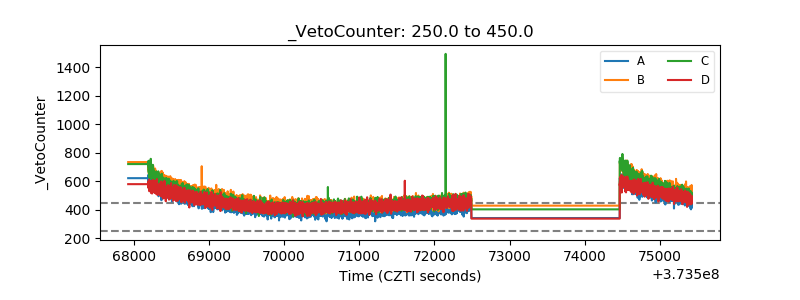 |